Note: Posts on this site are for education purposes only. They provide one firm’s insight on the markets. Not investment advice. See additional disclaimer here.
From Reminiscences of a Stock Operator, ‘Turkey’, aka Mr. Partridge, was much older than the rest.
The rumor in the broker’s office was that he was rich.
Even so, he was not contributing to heavy commissions (i.e. day and swing trading) as far as Livermore could tell.
The other thing was, that he never offered advice.
If a stock tip worked out, he would thank the tipster … if not, you never knew if he took a position or not.
Losing The Position & Psychological Impact
Turkey’s ‘losing the position’ remarks impacted Livermore the most. He recognized that Partridge wasn’t some old duffer; he was an astute speculator.
Losing the position: Not the same as holding a loser.
Maintaining a profitable position during a correction while at the same time, recognizing a big move could be in the works, requires (mental) strength; let the market itself say when to get in and out.
This link has Prechter’s ‘missing out’ story on big gains.
Continuing on with Turkey.
In the book, he said he ‘paid a high price for his tuition’ and does not want to incur a second fee.
Attempting to ‘play’ the market in and out then repeat, by definition, leaves one out of the big move.
It’s not the move itself; it’s the recognition that fiddling with the position and losing it, has resulted in a lost opportunity that will never come back.
The psychological damage is immense.
It’s worse than taking major loss. Watching a move take off without you when you had planned for months (or years) for the set-up, may have left no way to recover.
Which brings us to the market at hand.
Gold (GLD):
This site is not advice, and it does not make market ‘calls’.
Presented here, are posts documenting how Wyckoff analysis is being used to spot market set-ups.
Those set-ups have shown themselves over time to be potentially profitable (not advice, not a recommendation).
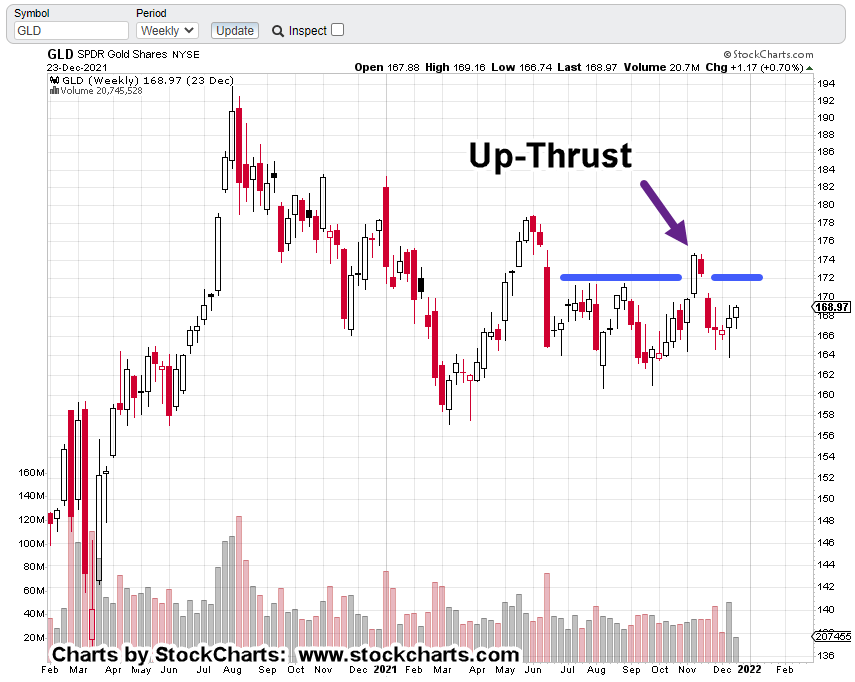
The weekly chart of gold (GLD) shows the up-thrust that was months in the making.
We’re going to invert the chart and so, the ‘up-thrust’ now becomes a ‘spring’.
Note:
Back in the day, when I wasted time posting on SeekingAlpha, I would get numerous complaints about ‘inverting the chart’.
They wanted it spoon-fed and did not have the mental plasticity to look at situations from the opposite perspective.
The ‘inverting the chart’ came from none other than Dr. Elder, himself … discussed in Trading For A Living or Come Into My Trading Room if memory serves.
The main interest on the ‘Alpha’ site seems to be pontificating about how sharp your pencil is; how close you can come to guess what earnings (or some other meaningless fundamental) will be at the next release.
I have not been back in years … they’re probably out there still arguing … only this time, the banter may be about which “masks” are most effective. 🙂
But I digress.
Months To ‘Spring’, Weeks To ‘Test’:
The inverted chart of GLD shows it took months for price action to penetrate support and create a spring condition.
Since then, we’ve had a move higher and now lower coming back near support.
Is this a test or a failure of the move?
It was a short week. However, it may still provide actionable data. For example, range of GLD, GDX and NEM, all narrowed. Volume contracted as well.
The inference is, thrust energy is weakening and thus weights the probabilities to a ‘test’ and not a ‘failure’.
Deflation Pivot:
Interestingly, we’re starting the see the consumer has finally reached the limit of their spending. Price are staring to edge lower as reported here and here by Economic Ninja.
Another data point, a bit esoteric, is ammunition. Pices are starting to taper off as well. Most notable is 22-LR.
A couple of months ago, 22-LR was about 0.10 per round (bullet). Looking at this site, we see the cheapest price has dropped to .080/round.
That does not look like much but it’s a 20% decline.
Summary:
Everyone has their own time frame and market approach.
Taking a cue from Turkey, referenced above, I would rather sit through a correction, incur the erosion of profit than exit and ‘click my heels’ as Prechter puts it; then watch the original position move for a huge gain without me aboard (not advice, not a recommendation).
We’re likely to find out very soon if this is a major pivot lower or if somehow, gold (GLD) bulls gain control and drive prices higher.
Note: Posts on this site are for education purposes only. They provide one firm’s insight on the markets. Not investment advice. See additional disclaimer here.
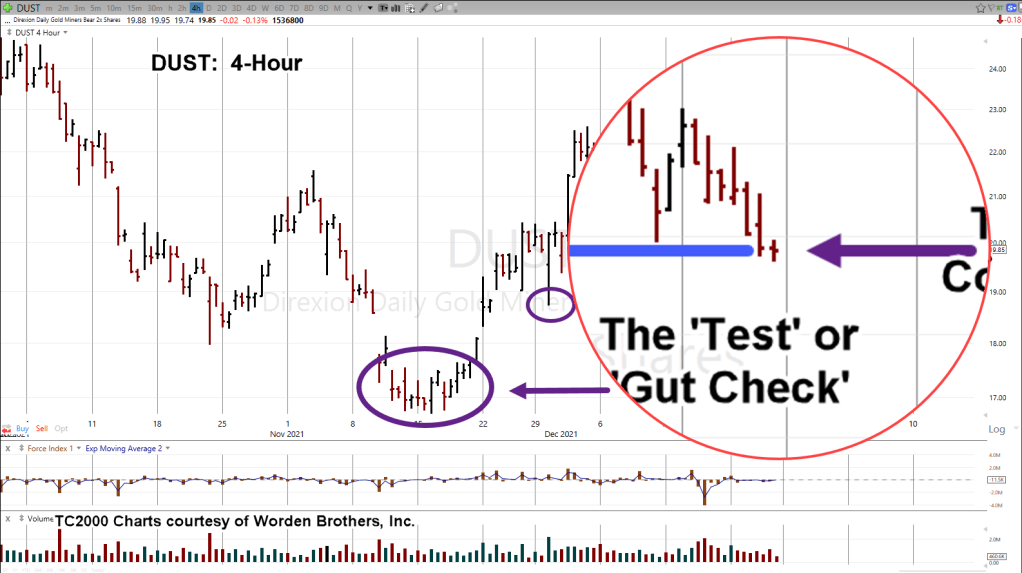
Newmont (NEM) will be analyzed over the weekend. For now, we’ll use GDX, leveraged inverse fund DUST.
GDX, Inverse DUST (4-Hour)
The first two trade points are clear. The ‘set-up’ and the ‘gut check’.
Whether or not we’re completing the first correction won’t be known until price action at least makes a new daily high, above today’s DUST: 20.45.
The zoom chart below, helps show DUST, is penetrating support … now in spring position.
Obviously, stating the first correction as ‘complete’ was premature.
However, if we are going to see a continued downtrend in GDX and uptrend in DUST, the chart above looks like today’s action is a good area for pivot/reversal.
With today’s screaming 40-year inflation news (first link, above) all gold could do (as of this post) in the futures market, was a meagre 0.43% blip higher.
Stay Tuned
Note: Posts on this site are for education purposes only. They provide one firm’s insight on the markets. Not investment advice. See additional disclaimer here.
That’s the training given by the late David Wies years ago concerning springs and up-thrusts.
His inference, if the volume contracts on the pull-back, the set-up has been tested; resumption of the reversal (up or down) is now expected to continue in earnest.
More analysis to follow but that’s where Newmont looks to be at this juncture.
Both gold (GLD), Newmont (NEM), and the miners (GDX), are at the danger point.
At this juncture, price action distance to trade failure or continued sucess is quite small (not advice, not a recommendation).
Note: Posts on this site are for education purposes only. They provide one firm’s insight on the markets. Not investment advice. See additional disclaimer here.
It’s not always what’s happening; it’s also what’s not happening.
‘The curious incident of the dog in the night-time’ … the dog did not bark and so indicated, it knew the killer.
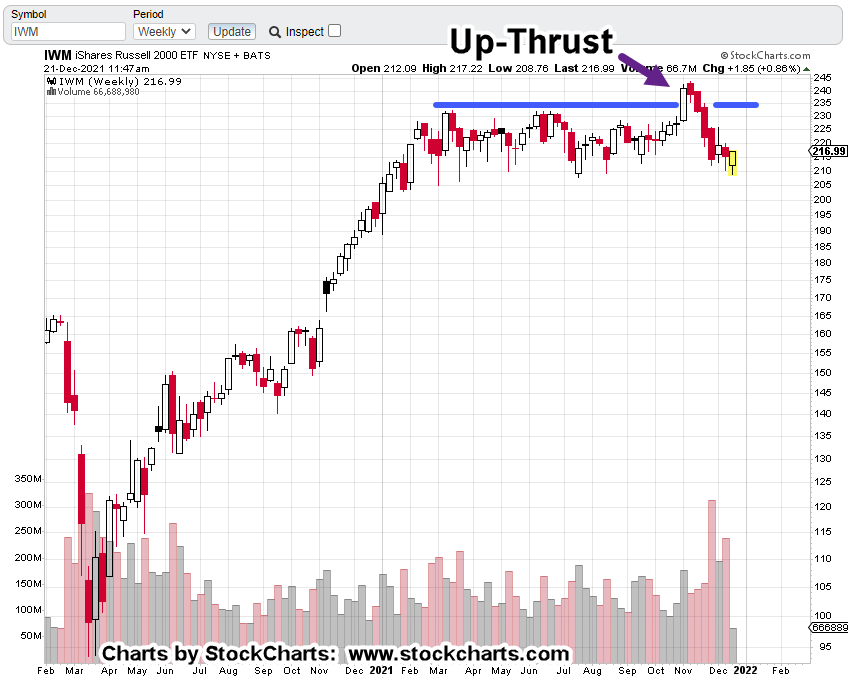
In Steven Van Metre’s Sunday night update (time stamp 5:55), he highlighted that small caps, IWM, (Russell 2000) tracking fund is in a ‘crash pattern’.
We’re going to look at the small caps and see what’s there and what’s not.
Russell 2000 (IWM):
Weekly Chart of IWM
The up-thrust is clear … we can see that.
However, the question is, what’s not happened with this (potential) set-up?
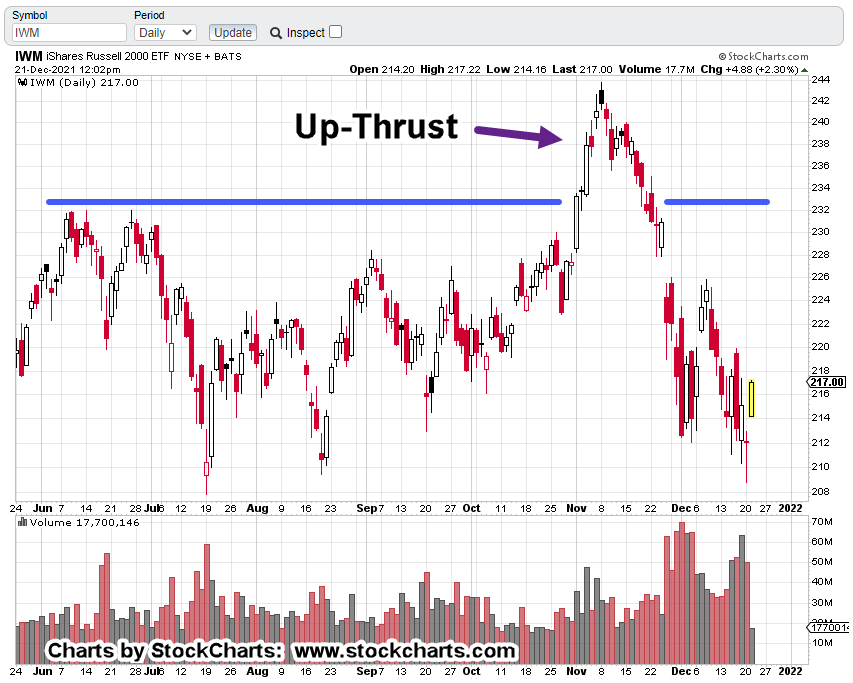
Moving to the daily chart, it shows the up-thrust has not been tested.
There’s no rule that says it has to be.
However, price action shows a spring set-up and retrace in process (below). We also have a Fibonacci target that looks like it might work out.
Moving closer in on the daily.
A retrace to the 62% level, would (could) act as the test of the up-thrust shown on the weekly chart.
That move if it takes place, would create its own up-thrust of the resistance area (below the 62%, level).
On top of that, we may have financial media helping out by getting participants on the wrong side; if so, they’re likely to foment news stories of continued ‘recovery’ or ‘inflation’ moderating … or some such non-sense.
The Media’s Role
In fact, if we get a retrace and the press does not jump on board … I’d be wary of the set-up (not advice, not a recommendation).
Remember what a good job they did with gold … $3,000/oz, is “imminent”, right?
Gold Down, Market Up?
Is that possible?
For starters, the question is what’s called a ‘mind-trap’. A certain way of thinking that causes one to get boxed-in.
The dollar continues its rally and gold appears to still be inversely correlated. We’ll stay with that as the main indicator of GDX downside potential.
Yesterday, it was thought the up-side correction in GDX, was complete … and that may still hold true. Today’s action looks like a minor test (thus far) of that correction.
Note, at this juncture, heavy-hitter, NEM, has posted out-side-down from yesterday’s price bar … hinting that it’s ready to continue lower.
Note: Posts on this site are for education purposes only. They provide one firm’s insight on the markets. Not investment advice. See additional disclaimer here.
Having been on the wrong side of major moves numerous times, I have first-hand experience on what’s likely to happen next.
If the bulls are trapped for a second time, those in control, the bears, are going to put the screws to those on the wrong side (not advice, not a recommendation).
It could be a straightforward downward thrust or a slow capital draining grind.
We won’t know how bad it’s going to be (for them) until it’s over; Keeping in mind at all times, anything can happen.
“Price action permitting, we’ll discuss how this first correction may be a brief one as opposed to a drawn-out choppy affair.”
Price action in GDX, has posted a new daily low (below last Friday’s low); a potential indication we could be starting the next leg lower.
The basis of that assessment is from a technical discussion published by Robert Prechter, Jr., in the early 2000s (’02, ’03, if memory serves) as ‘the rule of alternation’.
Basically, what happened last time, won’t happen this time.
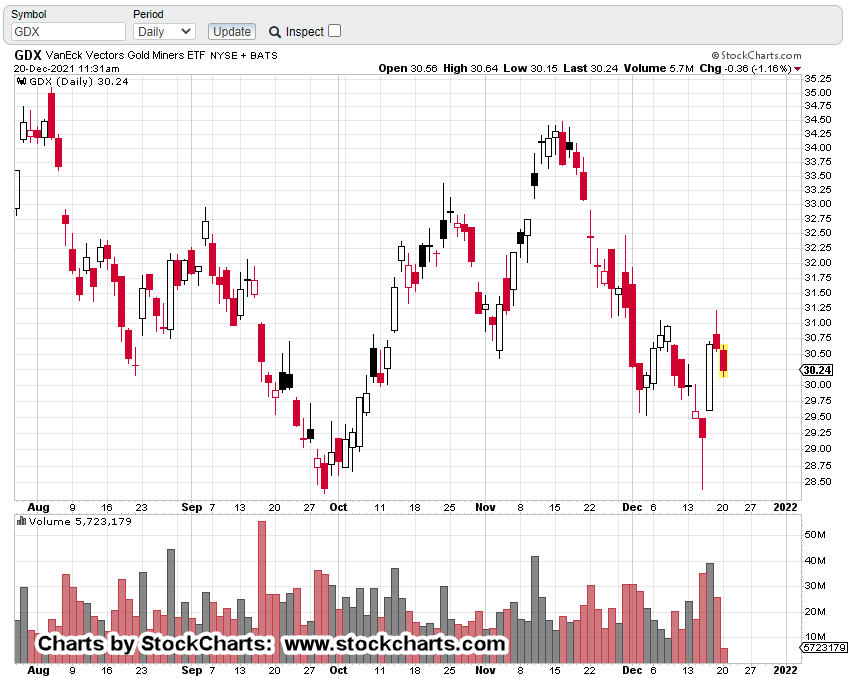
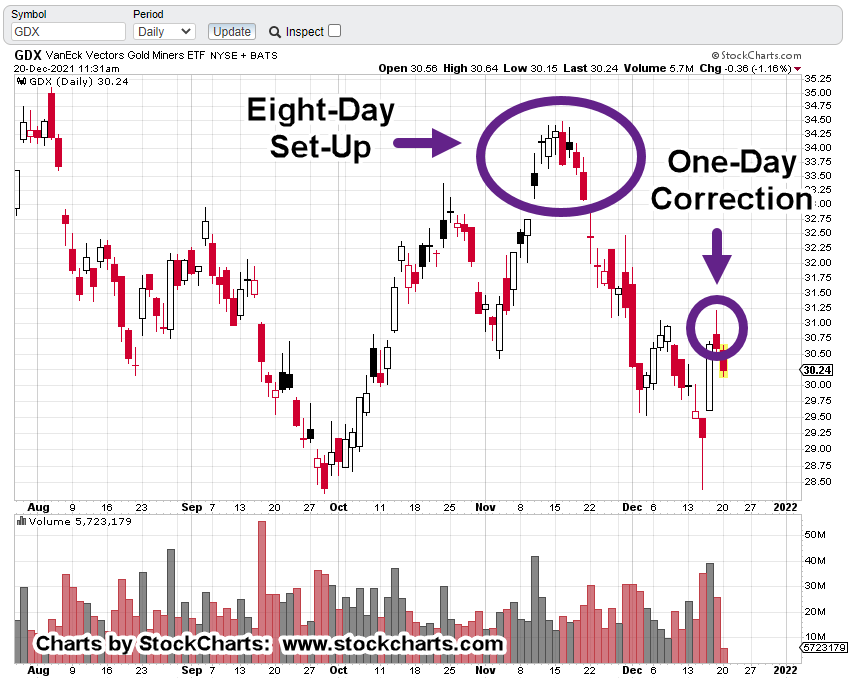
Senior Miners, GDX
The daily chart shows the eight-day up-thrust, along with current action.
The mark-up makes it clear
It was eight days above resistance battling it out between bulls and bears.
Now, we’ve had one day above resistance (level posted on, 12/7) followed by a new daily low.
Correction Complete ?
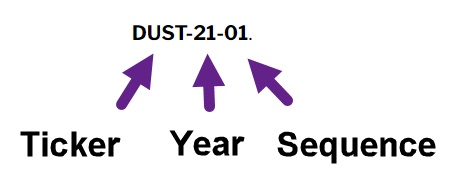
The following (DUST-21-01), is the trade sequence currently being used.
Based on the above analysis, we’re going to tentatively call ‘The first correction’ as complete (not advice, not a recommendation).
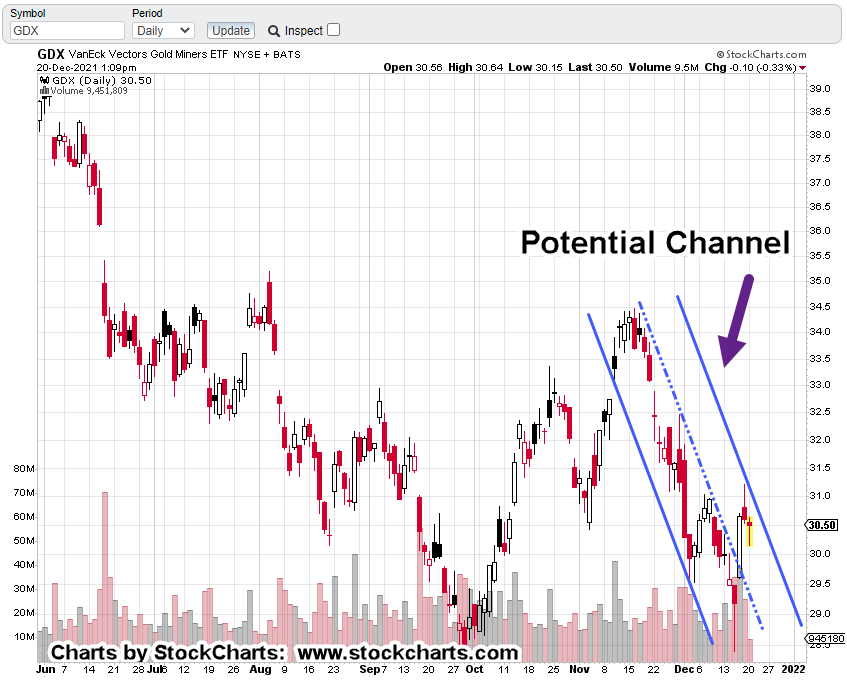
Next up in the trade sequence, is identification of a trend or trends … if any.
For now, we have the potential channel shown below.
Now comes the part most traders/speculators find difficult; That is, wait.
As Livermore said in Reminiscences, (paraphrasing): ‘It wasn’t the thinking that made me money … it was the waiting’ (not advice, not a recommendation).
Note: Posts on this site are for education purposes only. They provide one firm’s insight on the markets. Not investment advice. See additional disclaimer here.
No fan, and no endorsement of Buffett but the quote is applicable.
If yesterday’s Newmont analysis holds, meaning, it’s the last stand before another leg-lower, gold bulls might start acting irrationally.
Is it even possible to be more irrational?
Remember their manic prediction of $3,000/oz, gold in months, not years?
Barring a major reversal, the tide’s going out.
From the comments section of this ZeroHedge article, some in the herd are figuring it out as well.
As one of them says … ‘another year to wait before the Great Pumpkin’ (i.e., gold moving higher).
As this post is created, comments continue to pour-in.
Gold bulls are frustrated, confused, pontificating, crypto loving/hating, central bank blaming, it’s all there.
Thus far, there’s not one comment on what price action is actually doing.
Public Service Announcement
This whole business with the financial media and its attendant hucksters (recent examples, here and here) is actually a fantastic public service.
For anyone who’s still able to think (an act of rebellion in itself), it’s clear, or should be, if you’re on TV, or the mainstream media, you’re a shill until proven otherwise.
The good part?
All of this media, podcast, carpetbagging and corruption, plays right into the hand of Wyckoff analysis.
Wyckoff focused on what is … not what should be.
Even back in the early 1930s, he was adamant about ignoring the financial press. ‘You’ll never be successful’, he said if you listen to the hype.
Mixed Messages
On cue to support that statement, is Dan, from i-Allegedly; he reports ‘we’re getting mixed messages‘ in the economy.
Proving the point.
The (Trade) Plan Forward
With the caveat, anything can happen; gold could rally in a couple hours when the futures open, the short via DUST (not advice, not a recommendation), is as follows:
Even if the trade fails at the next session, it would still provide valuable information.
With that in mind, no matter what happens it’s likely to be referenced in the future; so, it needs a name (or number).
Taking a cue from prior engineering work (creating numbering schemes), the current trade will be identified now, and in future posts, as: DUST-21-01.
Seems straightforward.
The ‘First’ Correction
No. 3, above is titled ‘The first correction’.
This labeling is borrowed from a trade discussed by William Doane, in Dr. Elder’s book: Entries & Exits.
Price action permitting, we’ll discuss how this first correction may be a brief one as opposed to a drawn-out choppy affair.
Stay Tuned
Note: Posts on this site are for education purposes only. They provide one firm’s insight on the markets. Not investment advice. See additional disclaimer here.
Founded by William Boyce Thompson in 1916, Newmont (NEM) was around over a century ago during Livermore and Wyckoff’s day.
Thompson is center in the photo with President, Warren G. Harding at left.
Wyckoff and Thompson were interconnected.
In Wyckoff’s autobiography, he writes about working for Thompson’s firm (Thompson, Towle & Co.) in 1910.
During that time, he describes no fewer than two stock ‘manipulation’ schemes; one by renowned James R. Keene and the other by Thompson himself during a deal-gone-bad with the Guggenheims.
Also in 1910, Wyckoff published his seminal work: Studies In Tape Reading. If there’s any one book to read concerning how markets work, ‘Studies ..’ is that book.
Wyckoff had first-hand exposure into market operations by the wealthy and super wealthy. More importantly, he saw how those transactions showed themselves on the tape.
Last check, a first edition ‘Studies’ went for around $3,500. A quick search as of this post, turns up nothing currently available.
For those who complain ‘it’s rigged’, to that we can say, ‘it’s always been rigged’.
Determine what those ‘rigging’, are trying to accomplish and you may have a trade.
Now, to the market at hand: Newmont Mining.
It’s the key; the largest cap equity in the Senior Mining Index (GDX).
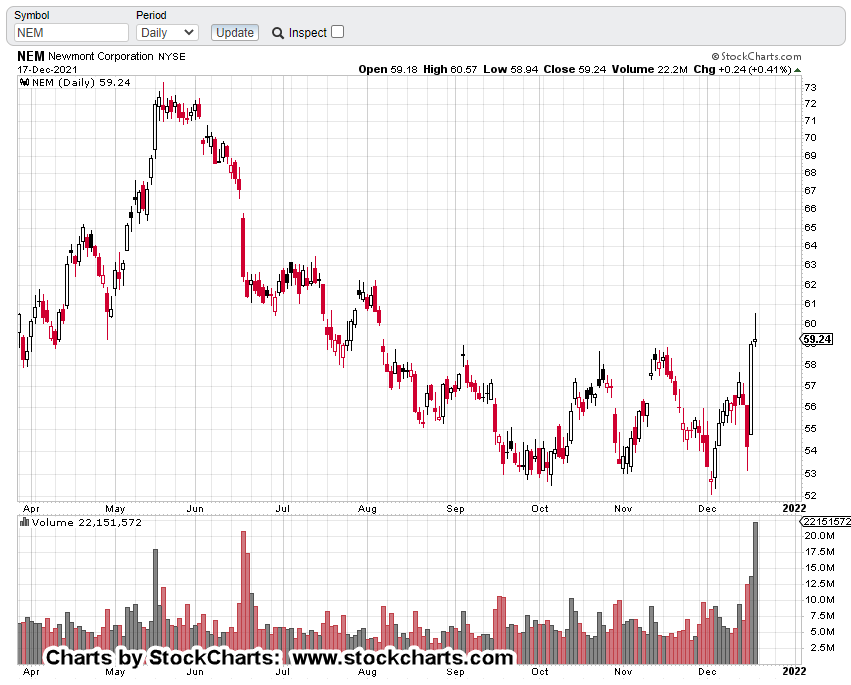
Newmont, NEM
The daily chart:
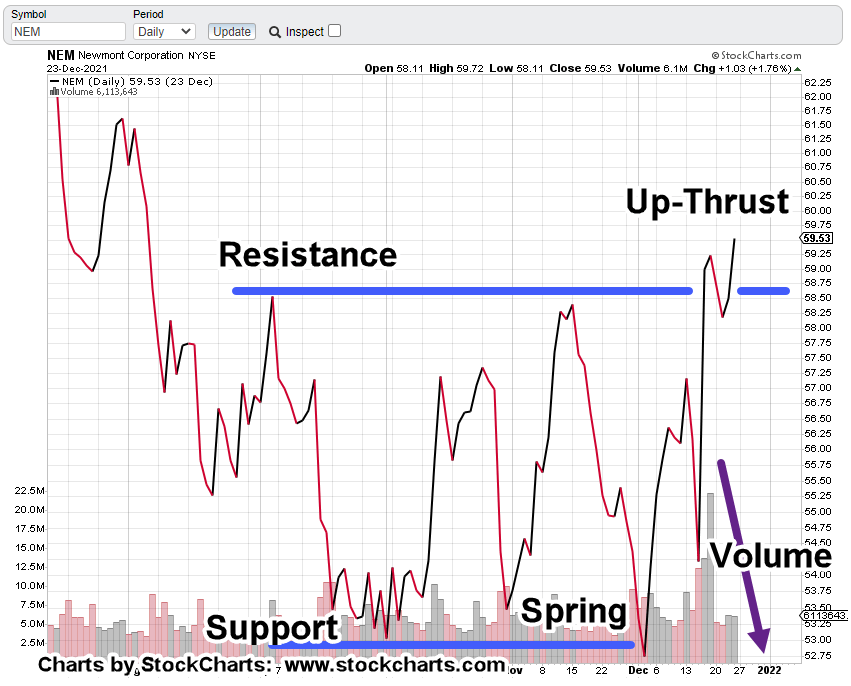
For those who have been with this site for a while, you may instantly see the set-up: Spring to Up-Thrust.
The marked-up chart makes it clear.
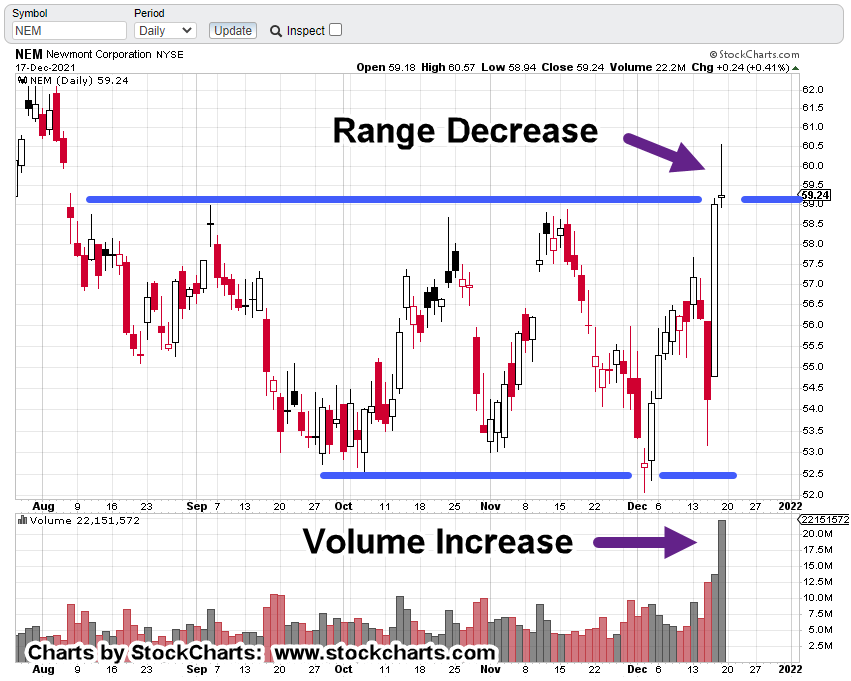
Moving in a little closer for additional clues:
We can see from the volume itself, there were a huge number of transactions this past Friday.
NEM penetrated long established resistance.
In so doing, it set off a massive number of orders: Buy orders, sell orders, sell-short.
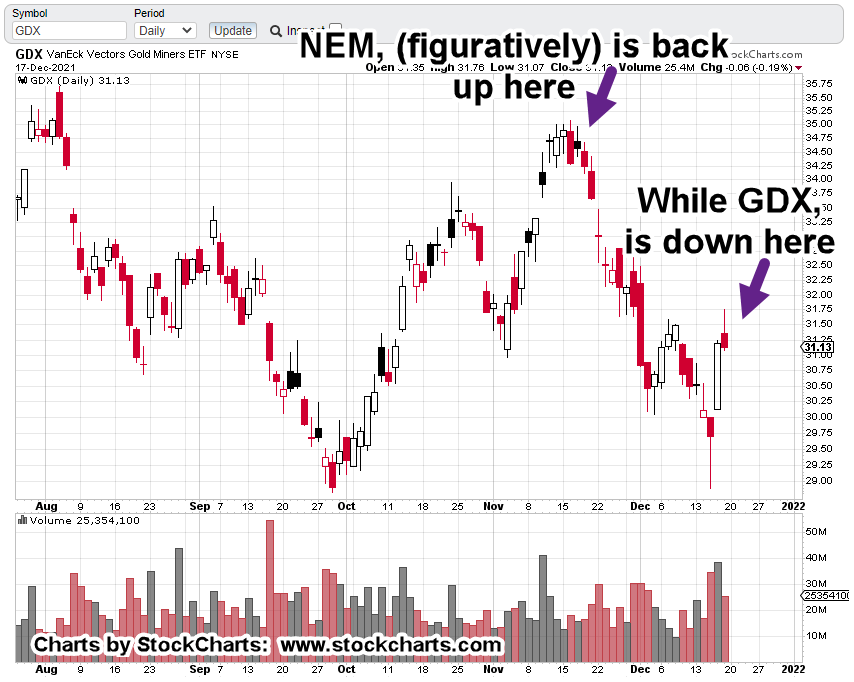
Senior Mining Index: GDX
The other part of the story and the one that weights it to the bears:
While NEM, is at multi-month highs, senior miners GDX, is nowhere near its highs.
Daily chart, GDX:
What does that mean?
It means the market is ‘thinning-out’
The professionals and maybe some investors alike, are abandoning the non-performing lesser cap equities; pouring funds into the last man standing NEM, in hopes that it will keep moving higher.
It’s desperation and signals market weakness.
As always, anything can happen and bulls may somehow take control.
However, from the charts themselves, hyper-stretched major indices coupled with insiders bailing out the most in history, uneducated ‘retail’ willingly stepping up to hold the bag, it does not look good for any bulls … gold or otherwise.
Summary:
We could find ourselves in a situation similar to the oil market in mid-2014 where it spontaneously deflated for eighteen months … nary a blip higher all the way down.
With that, we’re maintaining short via DUST (not advice, not a recommendation).
Note: Posts on this site are for education purposes only. They provide one firm’s insight on the markets. Not investment advice. See additional disclaimer here.
Is today the day we find out who’s really in control?
The day where it’s either inflation or deflation?
It’s about 30-minutes before the open.
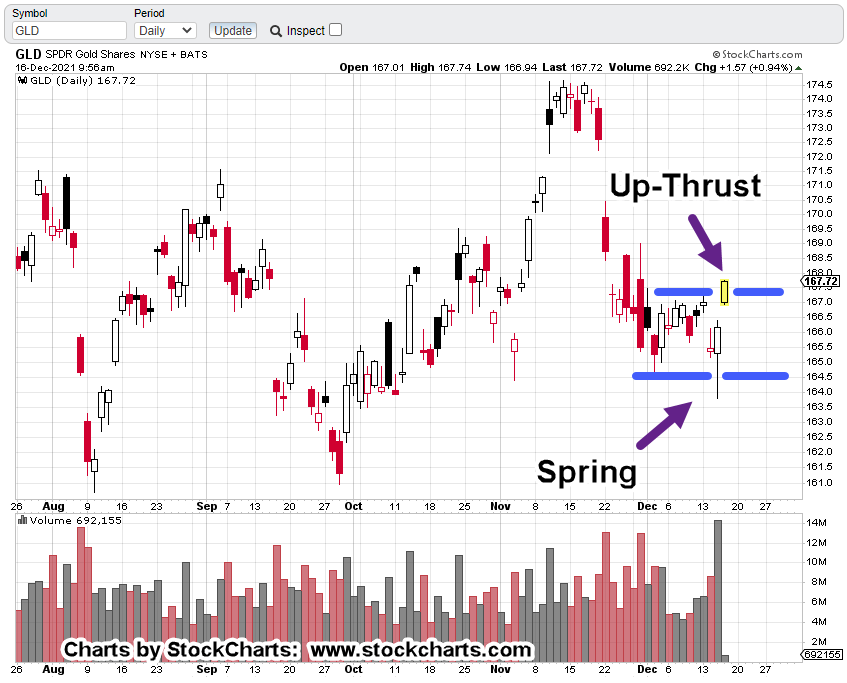
Pre-market action has gold (GLD), right at the Fibonacci 50% retrace level shown in the 4-Hour chart.
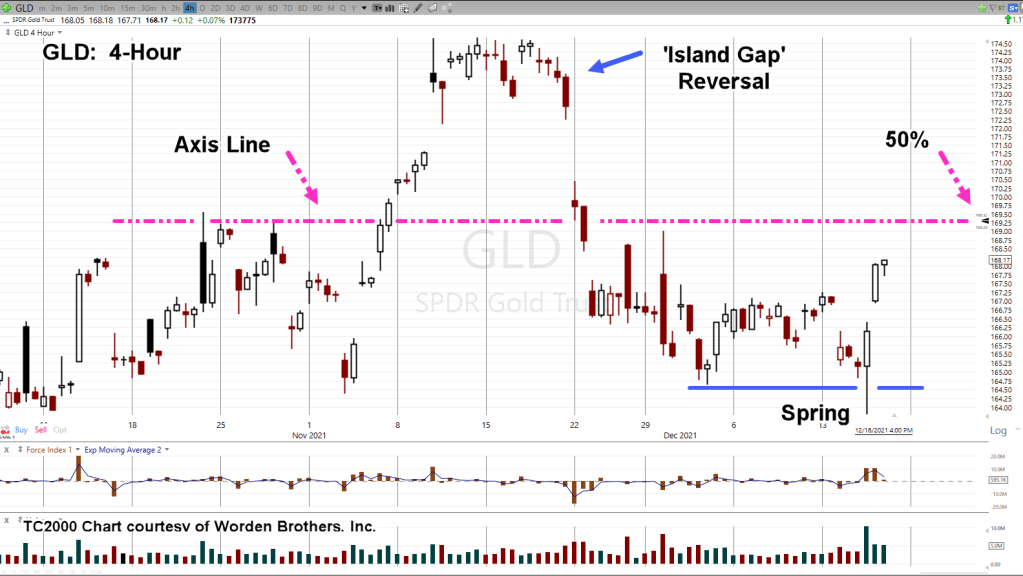
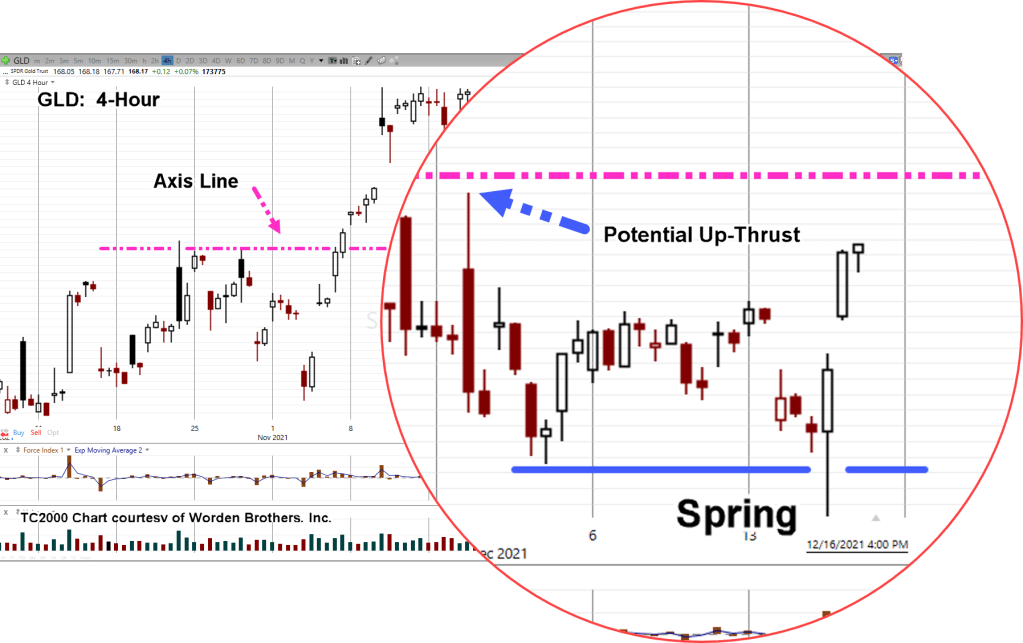
Gold (GLD) 4-Hour
Looking at the chart we see the following:
The up-thrust from November, was an island gap reversal (bearish).
During the Fed announcement (Wednesday, the 15th), price action penetrated weekly lows and set up a spring condition (bullish).
We’re at Fibonacci Day 3, of the spring and current trading at 50% retrace in the pre-market (neutral).
Pre-market trading is at an axis line which also indicated prior resistance on November 30th (bearish).
If price action opens or trades at the 50% level, it would also up-thrust the November 30th print high; therefore, creating a potential reversal condition (bearish).
Summary:
There’s a lot going on in the gold market.
The ‘man on the street’ YouTubers are screaming inflation and the need to “exit the system”.
That’s a great idea (exit). Just exactly how does that work anyway? A topic for another time.
Meanwhile, here we are.
We’re doing what price action’s telling us to do. That is, stay short until proven wrong (not advice, not a recommendation).
That proof, for bulls or bears could come today.
Stay Tuned
Note: Posts on this site are for education purposes only. They provide one firm’s insight on the markets. Not investment advice. See additional disclaimer here.
Note: Posts on this site are for education purposes only. They provide one firm’s insight on the markets. Not investment advice. See additional disclaimer here.