Note: Posts on this site are for education purposes only. They provide one firm’s insight on the markets. Not investment advice. See additional disclaimer here.
Note: Posts on this site are for education purposes only. They provide one firm’s insight on the markets. Not investment advice. See additional disclaimer here.
It’s a bear market; we have non-stop headline induced whipsaws, never-before seen extremes, massive downdrafts followed by (face-ripping) short covering squeezes.
Then, there’s the ‘fatigue’:
“Investor Fatigue Has Set In”: Goldman’s Desk Summarizes The Key Market Themes, link here.
Judging from the links below, the professionals (seem to) have an idea of what’s likely; the other side (the retail side), remains clueless or confused.
‘Depression Cycle Is Here’ Charles Nenner Warns “It Will Be Much Worse In 2026”, link here.
As Professional Traders Panic Sell, Retail Investors Just Can’t Stop Buying., link here.
The recent sharp recovery has shown us where to go for short-side opportunity.
One such sector, is the healthcare industry (not advice, not a recommendation).
Health Care Select Sector SPDR, XLV, Daily
The wedge is obvious.
Typical classical analysis market guidelines for wedge:
Whatever direction was the entry, that’s the (most likely) direction for exit (not advice, not a recommendation).
If there is a downside exit, we’ll discuss measured move(s) at that time.
Note: Posts on this site are for education purposes only. They provide one firm’s insight on the markets. Not investment advice. See additional disclaimer here.
If things don’t change soon, the wheels have come off the bond market (not advice, not a recommendation).
At this point, it’s common knowledge the (U.S. Treasury) bull market of forty-years, ended in March of 2020.
It’s been nothing but rates ratcheting higher, ever since.
Recession Reversal … Where?
However, a strange thing happened on the way to the anticipated bond reversal … typically, a long-time indicator of an impending recession.
Just weeks ago, during the market meltdown with the largest trading volume ever recorded, bonds did not respond as expected.
The Blip
During that wipe-out, bonds (TLT) blipped higher into a false breakout, a Wyckoff Up-Thrust, and have since collapsed on the largest weekly downside (thrust) energy and volume ever seen.
Note: Posts on this site are for education purposes only. They provide one firm’s insight on the markets. Not investment advice. See additional disclaimer here.
That’s the way it looks at this point as we’ll see below.
The ZeroHedge article in question, is linked here.
You can see, it starts off (before being grey-ed out) with referencing the Non-Farm Payrolls report; a report, that another article calls ‘rigged’. So, there’s that.
With each passing day, it’s ever more apparent, price action itself, is telling us the most probable market direction.
Just to prove the point, Blackstone’s sending out a ‘talking points‘ memo to keep clients calm and help ‘guide the conversation’ … i.e., ‘thought shaping’.
Thoughts ‘shaped’ or take action.
For this update, we’re taking action; looking at what the real estate market is telling us.
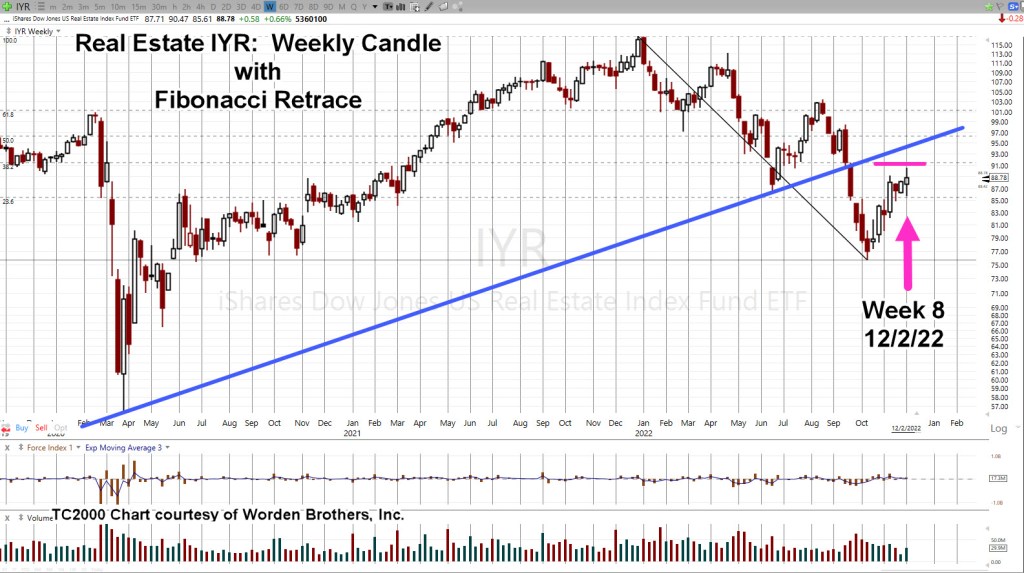
Real Estate IYR, Weekly
Let’s go back to the IYR, update from late October.
It showed the most probable direction; a move higher into a test, giving both the location, and the date.
Fast forward, to now:
We’re right at 38.2%, retrace and on time with Fibonacci Week-8, from the lows.
The daily chart shows a possible up-thrust (reversal) and test … the very same day that Goldman ‘gives-up’.
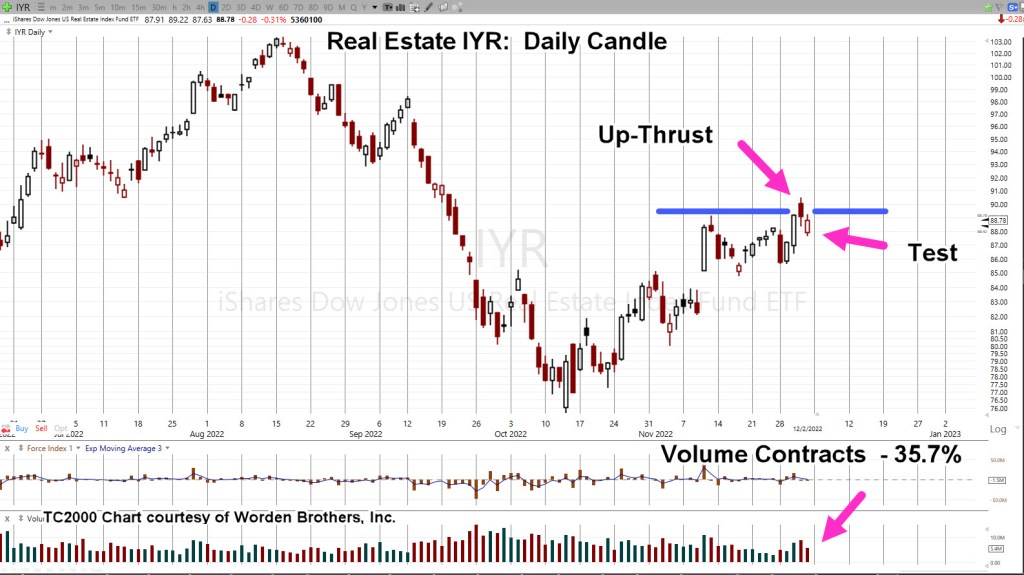
Real Estate IYR, Daily
Not shown on the daily; from the lows, October 13th, to the (print) high, December 1st, is a Fibonacci 34 (+1) Days.
Volume increased on the reversal bar December 1st, and then contracted on the upward test the next day … pointing probabilities to the downside.
Printing a new daily low at the next session, will help confirm the reversal.
Summary
Let’s see what happens next.
The Goldman report may be contrary indicator; telling us the ‘professionals’ are throwing in the towel, changing their approach right at a potential top.
Positioning
Not advice, not a recommendation.
LABD-22-13: Closed
It’s become apparent from this article; the truth, that was counted on as a tail-wind (for a short position) is not going to come out anytime soon.
Those that know, already know.
Moving on to other markets (below) that will be affected by the consequences of biotech.
DRV-22-06:
Short real estate IYR, via DRV (not advice, not recommendation)
Note: Posts on this site are for education purposes only. They provide one firm’s insight on the markets. Not investment advice. See additional disclaimer here.
In fact, Wyckoff’s stock market training course, first published in 1934, (still available), says that until you can ignore the financial press completely, ‘You will never be successful in the markets’.
Price action itself, properly interpreted, will tell you where to look for the opportunity.
The Ponzi Implosion, Cometh
The market is littered with Ponzi schemes. Some have already imploded, CVNA, HOOD, Crypto; some have not.
Concerning Crypto, here’s an excellent update from Michael Cowan. Buried in that update, at time stamp 4:58, looks like HOOD, may be in even more trouble.
Biotech is in a class of its own and was discussed in yesterday’s update.
For gold, we’re going to look at the Junior Miners GDXJ, and last week’s action.
Junior Miners GDXJ, Daily Close
The Junior’s are the weakest in the sector; therefore, that’s where we look for a short opportunity (not advice, not a recommendation).
To move higher, above resistance, normal market behavior, is to come back to the lower blue line (i.e., support) to gain enough energy to move higher for a breakout.
To move lower, normal market behavior, is to come down to the lower blue line as a test which subsequently fails; the move continues lower.
Either way, normal behavior at this juncture, is to move lower. We’ll see.
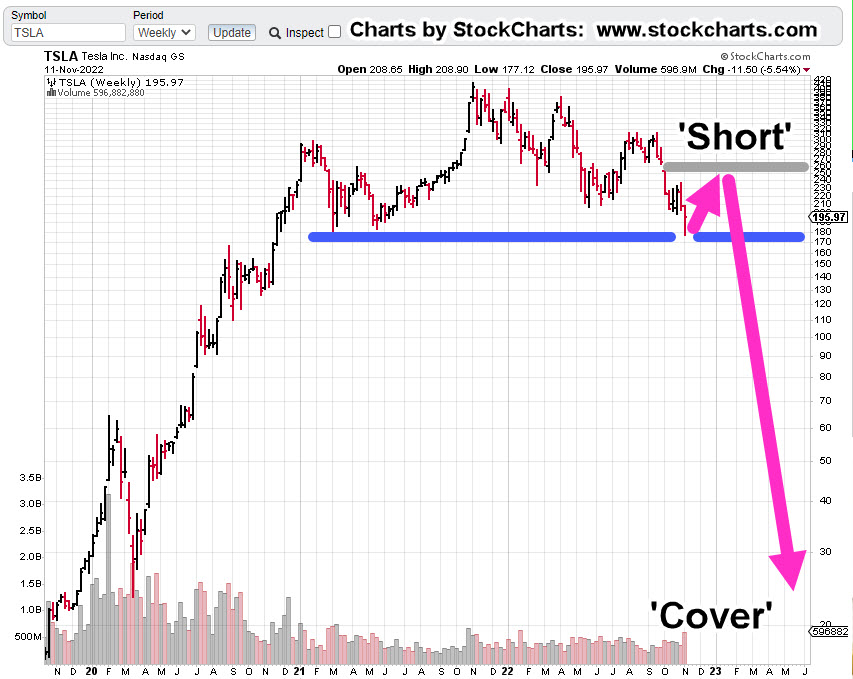
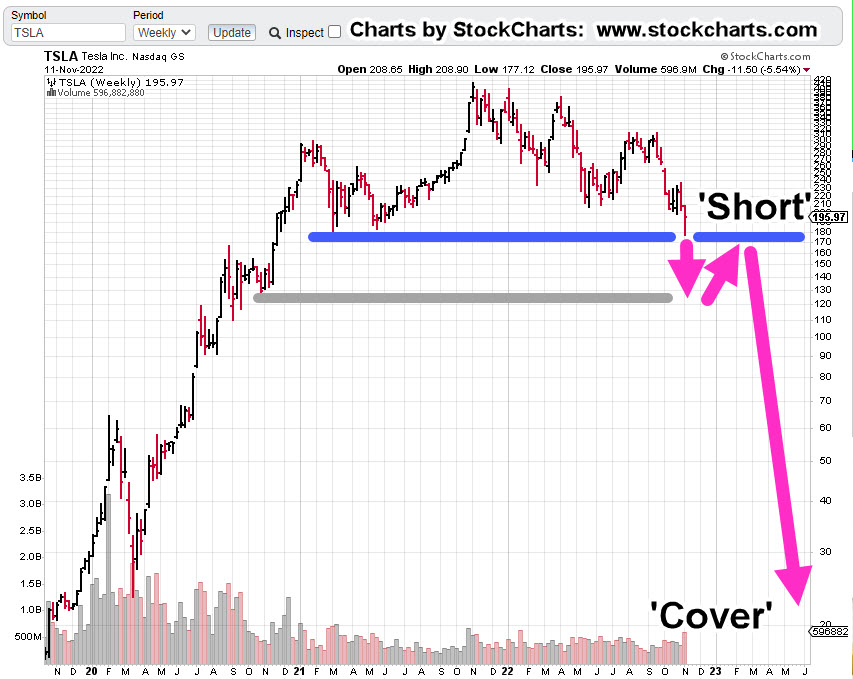
Now on to the chief cook and bottle washer … Tesla.
Tesla (TSLA), At The Edge
For starters, let’s recognize there’re a lot of moving parts; U.S. ‘parts’ and China ‘parts’.
If one’s going short, another task is to forecast under what conditions a short would have enough risk removed.
For that answer, oddly enough, we go to gold, GLD.
Gold GLD, Weekly: 2015 – 2017
GLD posted a massive upthrust above the blue line lasting over fourteen weeks before breaking decisively lower.
Then, it labored four weeks to come back up for a test.
After that, collapse; lower weekly closes for seven consecutive weeks.
In the chart above, the area identified as ‘Short’, has as much upside risk removed as possible, right at resistance.
Now on to Tesla.
Tesla TLSA, Weekly
Two scenarios are presented where risk may be reduced.
Chart 1
Chart 2
One of these may happen or neither of them.
Either way, for risk to be reduced, a short entry is needed to be at a known resistance level (not advice, not a recommendation).
Let’s move on to the current positioning.
Positions: (courtesy only, not advice).
One of three events will happen at the next session.
1: Both positions stopped out
2: One position stopped out
3: No positions stopped out
Each outcome will provide a data-point where to focus (or not) in the current environment.
LABD-22-10:
Entry @ 18.1398: Stop @ 16.83
JDST-22-05
Entry @ 9.1666: Stop @ 8.79
Note: Positions may be increased, decreased, entered, or exited at any time.
Note: Posts on this site are for education purposes only. They provide one firm’s insight on the markets. Not investment advice. See additional disclaimer here.