ChatGPT, Tops-Out

And With That, It’s Over

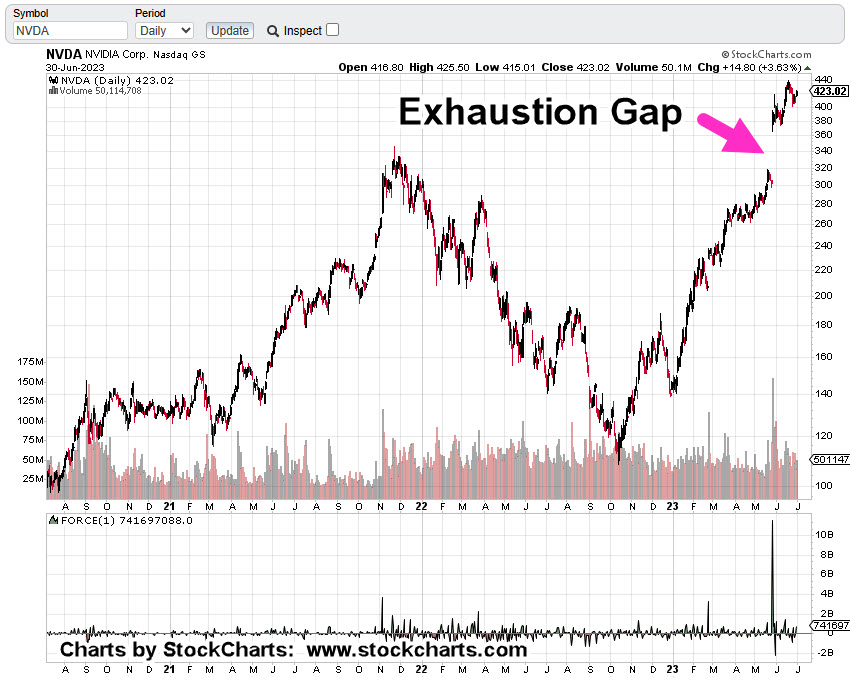
The ChatGPT craze lasted just long enough to ramp Nvidia and the SOXX, to stratospheric levels.

In the coming weeks and months, we’re likely to see who ‘cashed-in’ (a la Elon Musk) and for how much.

When a bull market nears the end of its lifecycle, it tends to thin-out.

As the smaller cap stocks fall away and underperform, they’re sold and that capital’s funneled into the ‘last man standing’; in this case, Nvidia (NVDA).

Broadcom (AVGO) is there as well, but it’s a distant second at 1/3rd, the market cap of NVDA.

Short Positioning

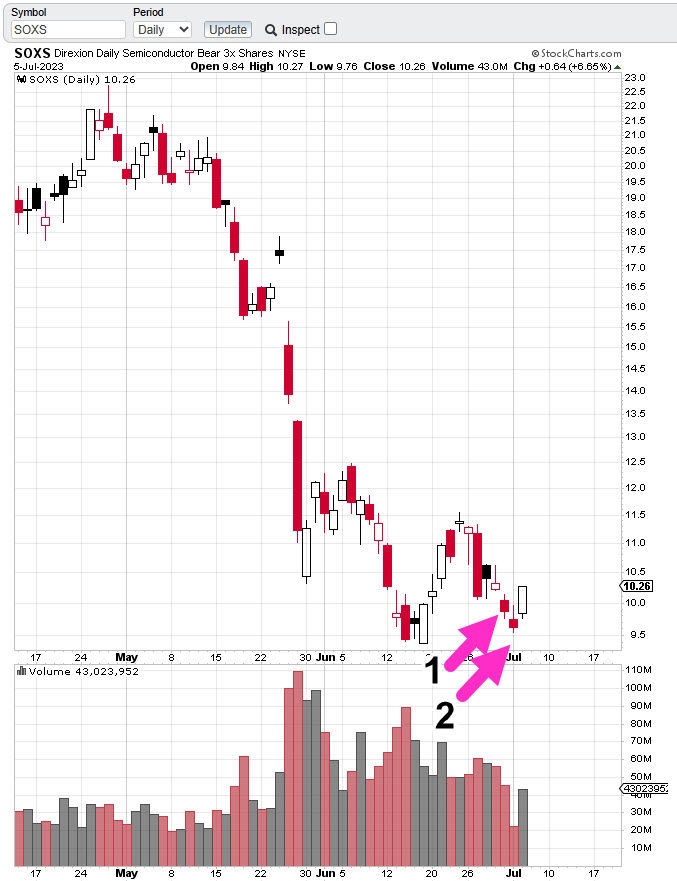
We’re short this sector via SOXS (not advice, not a recommendation) with entries shown in the prior update.

There was a third entry on 7/6 (not shown), but it’s minimal size when compared to the others.

Now, on to the charts

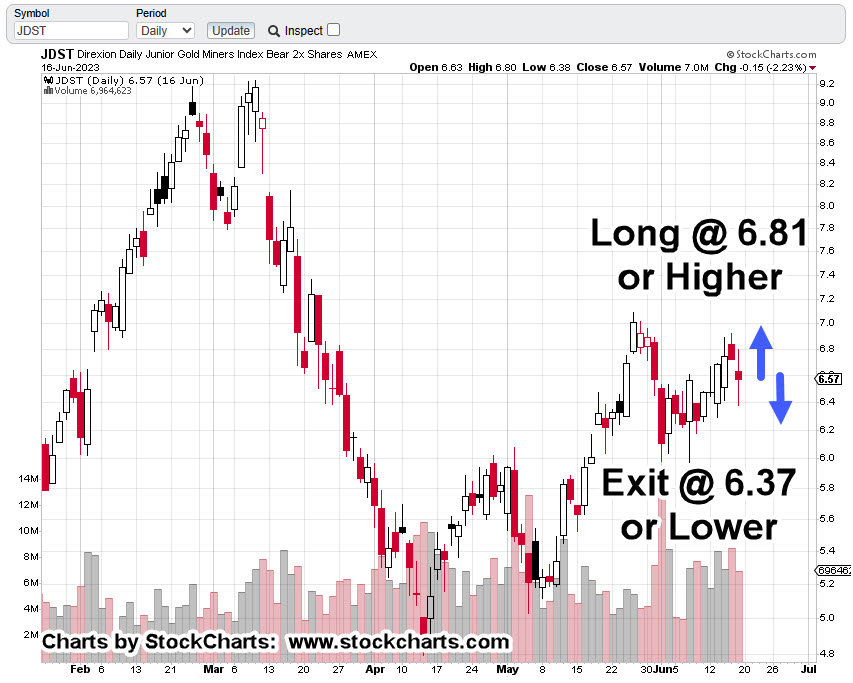
Semiconductor Leveraged Inverse Fund, SOXS

The following chart has the current hard-stop progression and soft-stop (trader discretion) locations.

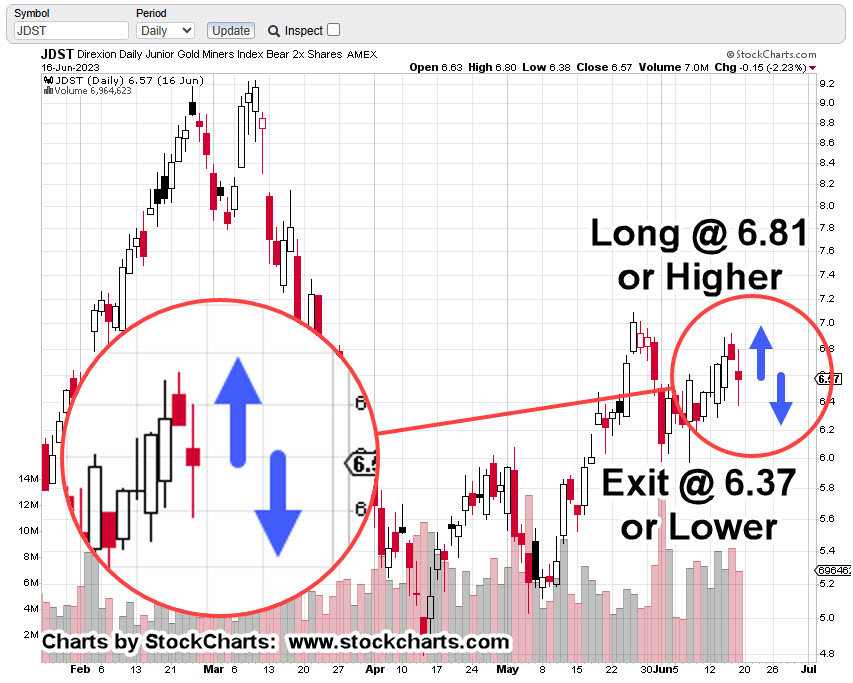
Moving in closer with the zoom version.

The ‘AI’ bulls are in their brain stem (un-thinking), enabled in their fantasy by articles like this one and this one.

Of course, there’s more like here and here but we get the picture.

Taiwan Semi (TSM) Earnings Date

At the time of this update, TSM earnings date was an estimate, now confirmed as July 20th, before the open.

It’s about to get interesting.

Stay Tuned

Charts by StockCharts

Note:  Posts on this site are for education purposes only.  They provide one firm’s insight on the markets.  Not investment advice.  See additional disclaimer here.

The Danger Point®, trade mark: No. 6,505,279

Managing The (SOXS) Trade

The ‘AI’ Reversal

It looks a little unstable for the ‘AI’ bulls.

The top in the SOXX, was correctly identified, here.

The potential completion of the downside test and reversal was discussed, here.

After that last post, the SOXX limped higher for one day, before reversing, today.

In fact, today’s session lows took out the daily lows of the prior two sessions.

This update will be brief.

A short position (via SOXS) was initiated on Friday June 30th, then increased by 20%, this past Monday, July 3rd (not advice, not a recommendation).

Semiconductor Leveraged Inverse Fund SOXS, Daily

Entries are shown as Arrow No. 1 and No. 2

An original soft stop (trader discretion) and hard stop were given of 9.75, and 9.48, respectively.

Price action on Monday pushed through the soft stop and trader discretion was to maintain the position.

As a result of today’s action, the hard stop has been moved up to SOXS 9.54, with a soft stop at today’s SOXS low of 9.76 (not advice, not a recommendation).

Stay Tuned

Charts by StockCharts

Note:  Posts on this site are for education purposes only.  They provide one firm’s insight on the markets.  Not investment advice.  See additional disclaimer here.

The Danger Point®, trade mark: No. 6,505,279

Beware … The ‘Ides’ of July

Well, July 13th, Actually

Thursday, July 13th, is when Tiawan Semi (TSM) is scheduled to release its earnings.

At this point, the date is still an estimate as this link says it could be as late as the 19th.

Either way, we’re going to find out (very soon) if there’s any correlating support for Nvidia’s ‘fantasy‘, $11-Billion.

The historic chart for NVDA (since 1999), shows an incredible rise that has apparently reached a climax top.

That climax is shown by the ‘off-the-chart’ reading of Force Index; never before seen in the 24-years, a near quarter century of trading history.

Nvidia, NVDA Daily Chart, Historical

Moving closer in on the daily, we see the magnitude of the thrust higher.

The gap has been labeled ‘exhaustion’.

That premise is supported by the fact of immense thrust (and volume) higher.

Exhaustion means just that; it can’t be sustained (not advice, not a recommendation).

Stay Tuned

Charts by StockCharts

Note:  Posts on this site are for education purposes only.  They provide one firm’s insight on the markets.  Not investment advice.  See additional disclaimer here.

The Danger Point®, trade mark: No. 6,505,279

‘Show Me The Money !’ … NVDA

Waiting, For August 23rd

From a strategic standpoint, this past Friday was the end of the Quarter and possibly the lowest risk spot to short the semis (not advice, not a recommendation).

‘Low risk’, does not mean, ‘no risk’.

We’ll look at the chart below for the SOXX, but first some housekeeping on the Junior Miners, GDXJ.

As stated in the last update, if there was more GDXJ, upside, shorts (via JDST) would be exited. That’s what happened with an overall gain of + 3.57%, on the series (beginning 6/16/23).

Now, on to the next circus … Artificial Intelligence; more specifically, NVDA and its cohort, the SOXX.

Where’s The Money?

With the quarter over, money managers have dutifully shown they’re like everyone else, ‘investing’ in AI.

That’s out of the way, so let’s move on to the specifics:

‘Hey NVDA, where’s the $11 Billion?’

Referring back to the excellent investigation done by The Maverick, in his view, the $11 Billion, is “Fantasy”.

The tricky part from a chart standpoint, is to identify when or if that fantasy is going to be exposed.

Semiconductor SOXX, Weekly (Inverted)

We’ve taken the weekly chart of SOXX, and inverted it as if going long the leveraged inverse SOXS (not advice, not a recommendation).

Downside force dissipating with each major thrust.

Last week was an ‘inside week’; price action could not make a new weekly low.

Couple that with end of quarter, potential ‘window dressing’ and this past Friday, may have been the lowest risk point, for shorting via SOXS (not advice, not a recommendation).

Analysis … not Advice

This site cannot and will not give advice.

What it can do, is provide analysis and strategy so that you can make your own determination on the market.

With that said, the ‘heads-up’ for a top in the SOXX, was posted on June 17th, link here.

Since that time, the SOXX reversed down and has now come back to test.

Positioning

On Friday, the SOXX, was shorted by entering long the inverse fund SOXS, at 10.01.

Soft stop (trader discretion) for the position is the session low at 9.75, and hard stop (no excuses exit) at all-time low of 9.48 (not advice, not a recommendation).

The coming weeks may prove interesting. All eyes will be on that ‘$11-Billion’.

Show Me The Money

Charts by StockCharts

Note:  Posts on this site are for education purposes only.  They provide one firm’s insight on the markets.  Not investment advice.  See additional disclaimer here.

The Danger Point®, trade mark: No. 6,505,279

Supply & Demand … Junior Miners

Testing The Right-Side

It’s a good thing we’re not listening to the ‘inflation’ narrative, just like we didn’t listen to ‘The Speck’ narrative of the past few years.

Turns out, ‘The Speck‘ was just the re-branded, common flu.

Inflation or Deflation

One has to wonder if the mainstream will ever acknowledge we’re in a deflation impulse.

The ‘inflation’ we’re seeing is (potentially) more associated with supply, product, and population destruction than any ‘money printing’ (not advice, not a recommendation).

As ‘Winston’ says at this link (time stamp (1:21:48),

People are allergic to the truth.’

The truth for the day, concerning the Junior Mining Index GDXJ, is that we’re testing the right-side trend line, the supply side.

Junior Miners GDXJ, Daily Candle

Today’s price action is technically a ‘Key reversal’.

As such, the typical response is continuation to the upside during the coming days and or weeks.

Key reversals are not perfect and at times, will fail.

The important session for GDXJ, is tomorrow, Friday.

Continued upside most likely results in exit of short positions (not advice, not a recommendation).

Stay Tuned

Charts by StockCharts

Note:  Posts on this site are for education purposes only.  They provide one firm’s insight on the markets.  Not investment advice.  See additional disclaimer here.

The Danger Point®, trade mark: No. 6,505,279

Mind The (Miner) Gap

‘Straightforward’ … Sort Of

‘Real (market) opportunities are rare. When one is found, it must be used to its fullest extent’; Gerald M. Loeb, the late, and former Vice Chairman, of E.F. Hutton

What a refreshing quote that is, back in the day when we had ‘Chairmen.’.

So, are the Miners the Juniors GDXJ, that opportunity?

From a technical standpoint, there’s the bearish divergence on MACD when looking at the weekly. Then, we have Fibonacci correlation on the weekly as well (shown below).

The daily has the short entry signal given yesterday (not advice, not a recommendation).

Fundamentals Collapse

Next, we have industrial demand in collapse, not to mention the world economies. If industrial demand is collapsing for photovoltaic components (link here), then silver demand must be collapsing.

The ‘Gap’

The analysis was working fine in the pre-market for shorting the GDXJ (not advice, not a recommendation), but then at the open, there was the gap.

Let’s address that but first get started with the weekly chart of GDXJ

Junior Miners, GDXJ, Weekly

The technical details are clear: Bearish divergence on MACD as well as Fibonacci time correlation.

The original Fibonacci 89-weeks was covered in this post.

Yesterday, there was a gap-lower open and price action kept posting lower.

Will this gap be filled? That’s the question.

Junior Miners GDXJ, Daily

As the chart implies, was yesterday a breakaway gap?

Price action’s right at support … or slightly below, which technically put us in Wyckoff ‘spring’ position.

The ‘Probabilities’

Given the bearish overall condition of this sector both on a technical and fundamental basis, a gap-fill is unlikely … but one has to be prepared.

As stated in the last update, the short position via leveraged inverse JDST was increased (not advice, not a recommendation).

To account for possible gap closure on the inverse JDST, a soft stop (trader discretion) is at 6.80 and below, with an absolute hard stop (no excuses exit) at 6.38 (not advice, not a recommendation).

It’s now, 20-minutes before the open.

Let’s see what happens next.

Stay Tuned

Charts by StockCharts

Note:  Posts on this site are for education purposes only.  They provide one firm’s insight on the markets.  Not investment advice.  See additional disclaimer here.

The Danger Point®, trade mark: No. 6,505,279

Entry Signal(s) … Short The Miners

Classic, Textbook

It’s rare to get a ‘textbook’ signal … but every now and then, it does happen.

The last update on the Junior Miners, GDXJ, said a short position in the sector was re-established.

Today’s trading action may be straightforward; we either get stopped-out, or the market gives the signal to enter a full (sized) position (not advice, not a recommendation).

The bearish case for the miners has already been established many times over. Recent posts are here, here, here and here.

Since we’re looking at the sector from the short side, we’ll use the chart for the leveraged inverse fund JDST.

Junior Miners, Leveraged Inverse JDST, Daily

As said at the top, it’s (potentially) straightforward.

If JDST, price action exceeds 6.81, a full position will be entered with hard stop at this session’s low (determined at the close of the day).

If price action declines to 6.37, or lower, the existing (small) position is closed out.

Closer in, with a zoom of the price action.

As of this post (8:41 a.m., EST) JDST is trading in the pre-market slightly higher at, 6.65 which is + 0.08, or + 1.22%.

Stay Tuned

Charts by StockCharts

Note:  Posts on this site are for education purposes only.  They provide one firm’s insight on the markets.  Not investment advice.  See additional disclaimer here.

The Danger Point®, trade mark: No. 6,505,279

Key Reversal … Gold Miners

New Daily Lows

We’re now about mid-way into the session.

The daily lows of the past four trading days have been penetrated: thus, defining today as a ‘key reversal’ or ‘outside-down’.

Spring Position

Ironically, since those lows have been penetrated, it sets up the GDXJ, in Wyckoff ‘Spring’ position.

There’s a possibility of some type of rising action as we get near the close … but don’t count on it (not advice, not a recommendation).

The weekly MACD, is in a bearish divergence (not shown) and it looks like the daily upside testing is complete.

This bearish set up may continue to develop into a significant downside move or just as easily, dissipate into randomness.

Junior Miners GDXJ, Daily Candle

If this turns out to be an important directional move, we’re still early (not advice, not a recommendation).

Following updates will present trendlines and support/resistance areas.

Stay Tuned

Charts by StockCharts

Note:  Posts on this site are for education purposes only.  They provide one firm’s insight on the markets.  Not investment advice.  See additional disclaimer here.

The Danger Point®, trade mark: No. 6,505,279

‘Bump & Run’ … Gold Miners

Upside Test Can’t Hold

With less than an hour into the session, Junior Miners (GDXJ), have tapped upper resistance, pushed past by just 0.07-points, and are now eroding to the downside.

If the index continues lower, it has the classic near textbook look of ‘bump and run’.

It’s a price action response to stops placed just above resistance that get executed and then the market continues lower.

If that’s the case, it could get very serious to the downside (not advice, not a recommendation)

Short positions via JDST, have been maintained with a hard stop at today’s JDST, low of 5.974 (not advice, not a recommendation).

Charts to follow.

Stay Tuned

Charts by StockCharts

Note:  Posts on this site are for education purposes only.  They provide one firm’s insight on the markets.  Not investment advice.  See additional disclaimer here.

The Danger Point®, trade mark: No. 6,505,279

‘Mania’ or ‘Money’ … Your Choice

The Challenge Vs., The Money

The ‘Artificial Intelligence’ (AI) clown show’s in full swing with a ‘predicted‘ single quarter target of $11-Billion, from NVDA.

That’s not to be confused with the budget clown show just ended in Washinton D.C.

And where does that leave Tesla? They seem to be left out of the latest round of cult-like insanity.

Back in the day, Dr. Alexander Elder stated, professionals don’t look for the ‘challenge’ in the markets (trying to figure out the NVDA, top), they look for the ‘money’ … there’s a huge difference.

Junior Miners GDXJ, Weekly Candle

As of 12:35 p.m., EST, from a technical perspective, even though we’re up for the day (so far), MACD momentum’s increasing to the downside (magenta arrow).

Nobody seems to be paying attention to gold and silver; all eyes are focused on the next shiny object.

Pulling out a bit farther on the weekly, there’s no question we’re in a channel.

The question is, are we (GDXJ) going to say in that channel or reverse from here?

The last update said we’d likely be testing the wedge break and that’s what’s happening.

A ‘test’ will take however long is needed. It’s either pass or fail. Pass in this case is resumption to the downside.

Technical conditions (MACD, wedge break) favor the downside (not advice, not a recommendation).

In addition, we need to keep in mind there’s a new circus in town; the miners may be well on their way to more downside before anyone steps out of the big-top to notice.

Stay Tuned

Charts by StockCharts

Note:  Posts on this site are for education purposes only.  They provide one firm’s insight on the markets.  Not investment advice.  See additional disclaimer here.

The Danger Point®, trade mark: No. 6,505,279