Le Denouement

The final outcome. Real estate IYR has met key technical points that indicate reversal is imminent. It might not be much of a turn at the start, but the market rarely announces its intent.

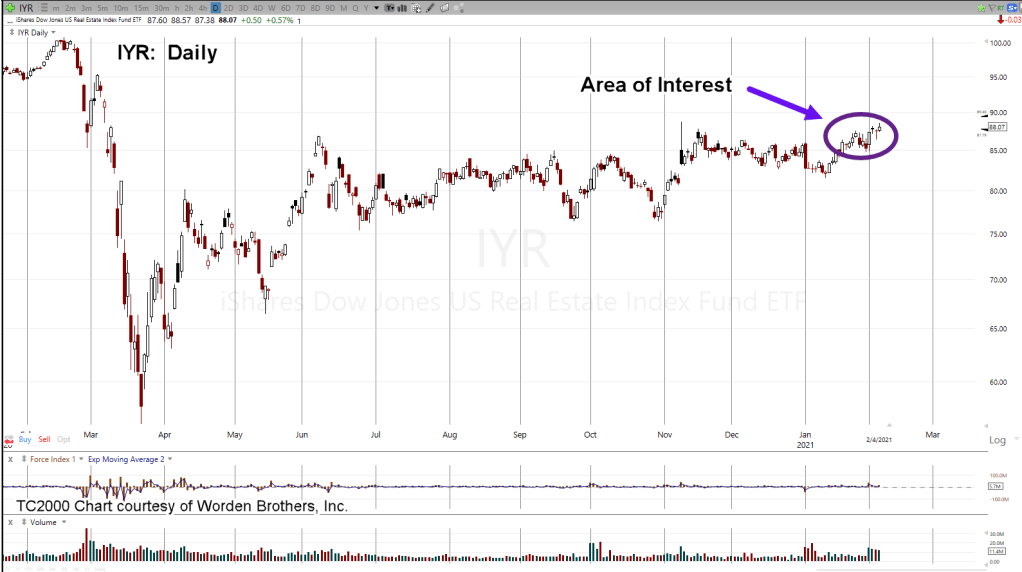
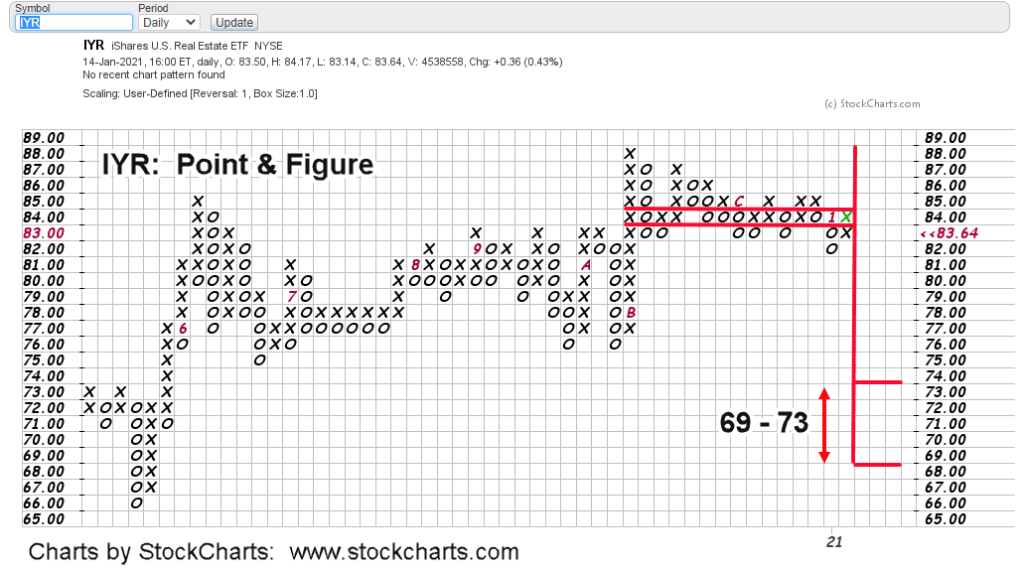
Time spent analyzing real estate seems like forever; it’s actually only been a few weeks. The daily chart above, puts it into perspective.

For the most part, trading and positioning action has been focused on the tiny circled area. Not advice, not a recommendation.

To be concise, we’ll list the known facts about the current juncture.

  • IYR is at Fibonacci 76.4%, retrace level from the down move that started in February – March last year.
  • Price action has met a Fibonacci 61.8% projected move off ‘a-b-c’ wave action from the January 12th, 2021 lows.
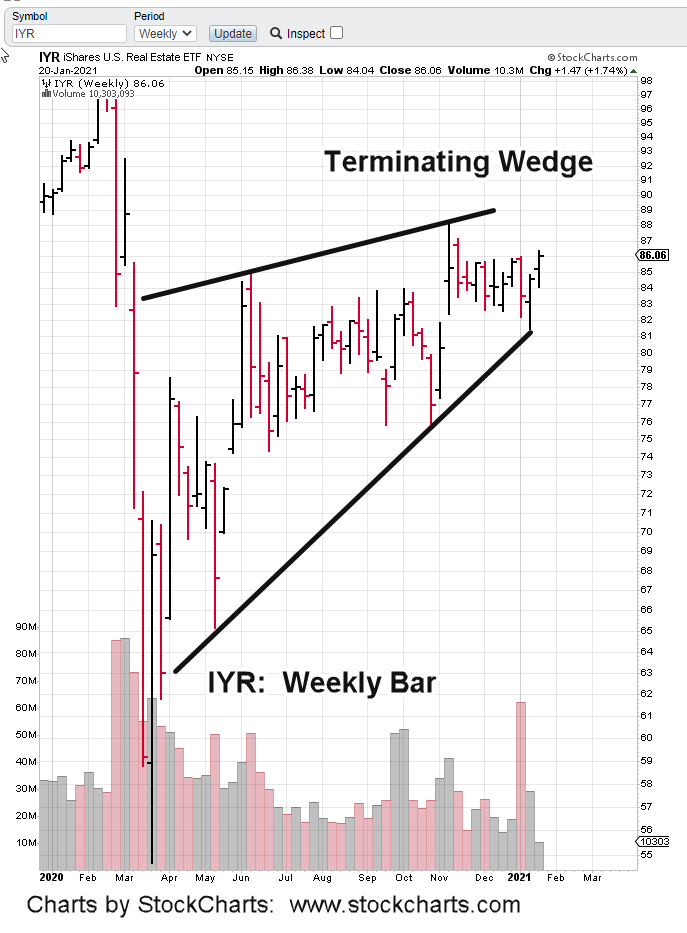
  • While meeting that 61.8% projection, price action formed a terminating wedge; complete with a throw-over early in the session yesterday.
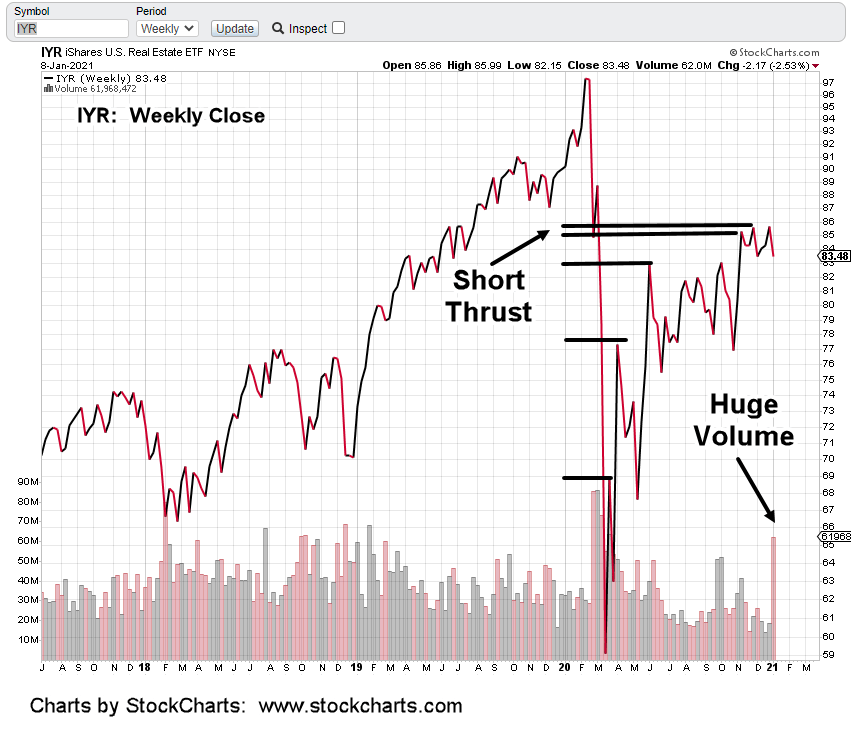
  • Price action closed below the prior near time high of 88.11 (close was at 88.07).
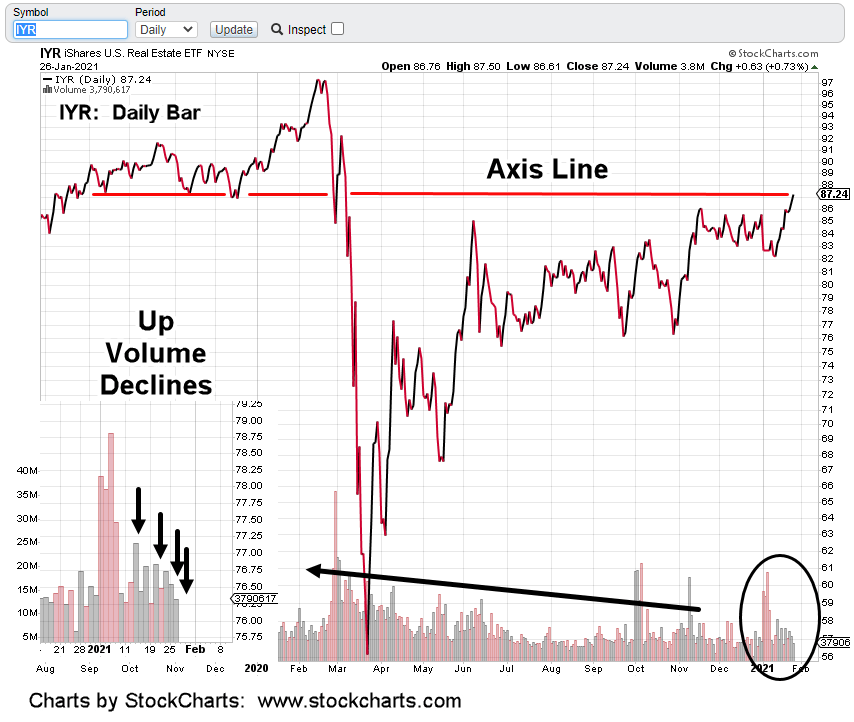
  • High levels of volume over the past four sessions, indicate distribution; just as it indicated accumulation at the beginning of the current move. The “Book-Ends”
  • Successive lower momentum energy with each net upward close since April 9th, 2020.
  • Supporting the potential for market reversal, bonds are at short level (and price) extremes and the dollar has already reversed.

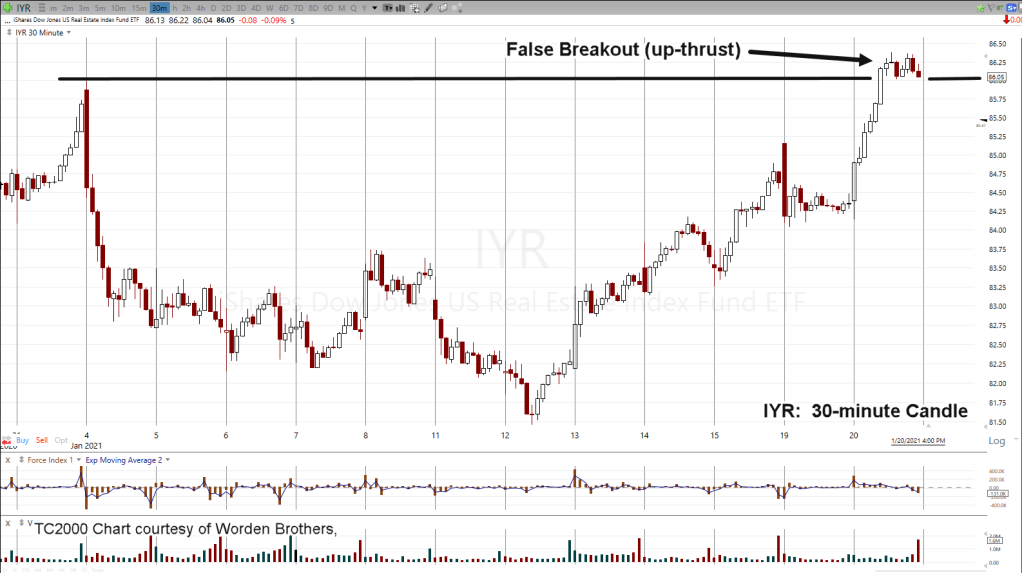
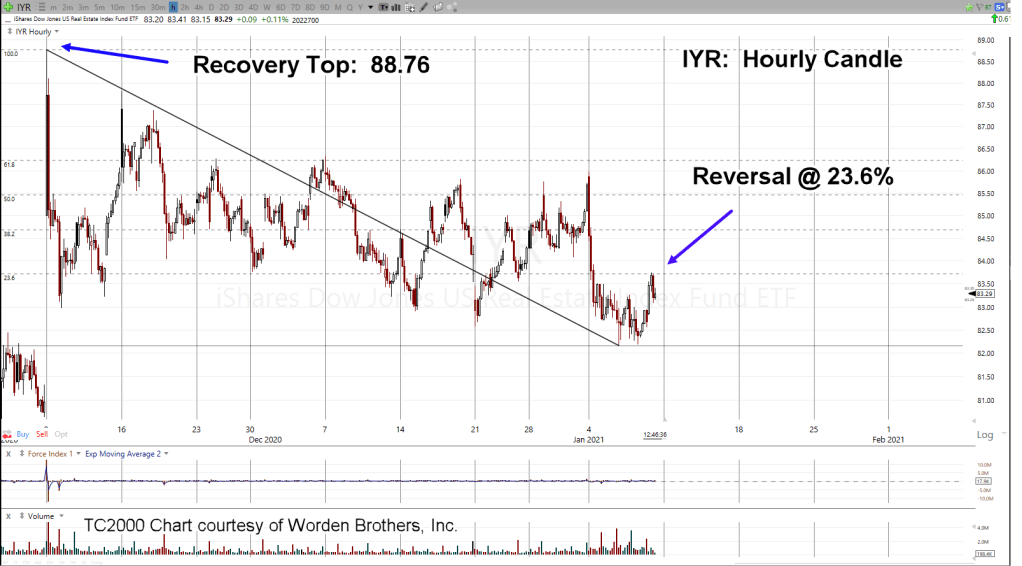
The area of interest shown in the daily above has been expanded to hourly charts below:

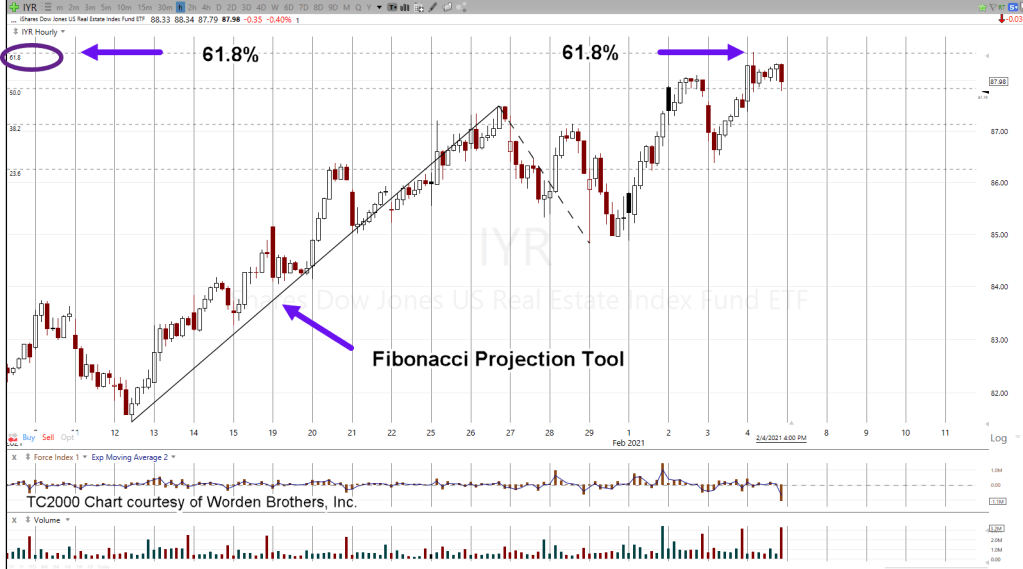
It may be a little hard to make out the Fibonacci numbers (61.8%, circled), but early yesterday, price action posted higher and reversed off the Fibonacci 61.8% level.

The hourly below, shows in addition to meeting Fib targets, a terminating wedge had also been formed:

The last chart, the daily, has IYR posting right at Fibonacci 76.4% retrace of the entire down move from February – March last year.

If IYR does not reverse at this juncture (or within tenths of a point), then it’s headed to much higher levels.

Considering all the facts; the extremes, bonds, dollar, and now gold and silver in a deflation impulse; significantly higher prices for IYR seem unlikely indeed.

Stay Tuned

Note:  Posts on this site are for education purposes only.  They provide one firm’s insight on the markets.  Not investment advice.  See additional disclaimer here.

P & F Forecast: IYR

Unless IYR posts a new daily high, it’s in a reversal.

P&F chart forecasts an ‘initial’ target: 69 – 70 range.

Initial target because as (and if) IYR moves down, it generates even lower targets having posted prior congestion in the 76 – 82, chart area.

Charts by StockCharts

Note:  Posts on this site are for education purposes only.  They provide one firm’s insight on the markets.  Not investment advice.  See additional disclaimer here.

All Markets Down

Pre-market action has all major indexes trading lower; SPY, DIA, QQQ, SOXX and IWM; all down.

Real estate, IYR has no real pre-market volume (20-shares) so its open is unknown. However, inverse fund DRV, does have volume (3,700 shares) and its action is up about 4%.

The daily close chart of IYR (above), has price action contacting an established axis line.

That was yesterday. Over the past two-weeks, as price ratcheted higher volume has declined (circled area enlarged).

That decline indicates lack of commitment at these levels.

Yesterday’s close also put IYR firmly in up-thrust position (ready for reversal).

Over the past week, short positions were opened using DRV (not advice, not a recommendation)

Average price of the short equates to DRV @ 9.92; not far from current pre-market trading.

If IYR posts a new daily low (below 86.62), it’s another data point the anticipated reversal may be at hand.

The rising action has changed the P&F forecast reported a few days back. Updates will be forthcoming.

If this is the start of a sustained reversal, the plan is to build the short position as price action dictates.

The downside of the entire market (S&P, Dow, etc.) is immense. Commercial real estate is especially vulnerable. Price action itself tells us that.

Stay Tuned

Charts by StockCharts

Note:  Posts on this site are for education purposes only.  They provide one firm’s insight on the markets.  Not investment advice.  See additional disclaimer here.

The Plan

The image below may be the best descriptor of the (economic) plan going forward. Full (forced) compliance won’t be achieved until every vestige of small-business (Mom & Pop) is destroyed.

On the bright side, at least we know what’s coming.

The near instant, within hours fracking about face, could be used as the economic model; destroy everything and do it quickly.

Self employment (S-Corp of one) may or may not be the ultimate answer. One thing it might do, is offer more time for maneuvering. That’s critical when ‘speck’ injectors show up at large firms and force everyone into line.

With that in mind, two sectors have been the focus as opportunities for short positions.

Oil & Gas, XOP and real estate, IYR.

There are others like gold with GDX down again in the pre-market … thus confirming a bearish trend.

It could wind up that shorting GDX was the best option.

However, since there’s such rabid indoctrination into the hyper-inflation theme, it could be a bumpy road to the bottom … the exact worst thing for an inverse ETF.

Those trading vehicles prefer straight down action. Otherwise, they erode (value) quickly.

Analysis of the Oil & Gas sector was covered just recently, right along with identifying a reversal. XOP is down again in the pre-market with DUG up.

The short position in DUG is being maintained (not advice, not a recommendation) with chart analysis to come over the weekend.

Real estate, IYR shows a lower open as well.

Going short this one (via DRV) has been more time consuming. As IYR heads lower after an apparent false breakout (Wyckoff up-thrust), increasing the line (position size) is the objective; not advice, not a recommendation.

Depending on today’s price action, chart analysis on IYR and DRV will be forthcoming.

Note:  Posts on this site are for education purposes only.  They provide one firm’s insight on the markets.  Not investment advice.  See additional disclaimer here.

Fake Breakout

It’s possible yesterday’s real estate breakout was false.

This update includes three charts; two are on the weekly time-frame and one, is a 30-minute chart.

Yesterday, IYR barely nudged the resistance zone and attempted to hold. Late in the session, price action eroded a bit into the close.

We’re in a terminating wedge.

This type of action is counter-trend. Price bars overlap and are struggling against the main trend which remains down.

The 30-minute chart (above) has more detail.

Barely able to hold the highs, price action is at the boundary. Like yesterday’s update on XOP, we have IYR in a similar position:

At the edge of the lake.

Pre-market action is highly unusual (because of the wide spreads) in the IYR inverse funds SRS and DRV. However, that’s what we have now.

Pre-market in DRV points to a higher open (lower for IYR).

Anecdotal evidence from Jerimia Babe, shows us nobody’s home; a wide swath of vacant rea estate. It’s reasonable to say, this situation is repeated in various degrees nationwide.

We’re still short the sector (via DRV); admittedly it could have been better. Not advice, not a recommendation.

From a strategic standpoint (for the firm), it’s an initial position and so not too concerned about the draw-down.

At this point, two outcomes are possible with one more probable.

First, IYR price action may continue on higher (less probable) and if so, we’ll have to exit DRV.

Second, and based on pre-market action, IYR will open below yesterday’s highs, then a potential upward test, followed by downward action.

That may all happen today or over a number of days.

Lastly, based on news and internet scuttlebutt, no time will be wasted on destroying what’s left of the economy and remaining vestiges of the middle class.

The final nail could include a swift, unrelenting market collapse that includes seizure of IRA accounts (at minimum). A topic researched long ago with more detail in the link above.

Stay Tuned

Charts by StockCharts

Note:  Posts on this site are for education purposes only.  They provide one firm’s insight on the markets.  Not investment advice.  See additional disclaimer here.

Ancient Art: Point & Figure

You don’t hear about Pont & Figure anymore. P&F looks old, stodgy and boring; but that’s exactly how one should approach the markets to be consistently profitable.

Paraphrasing Dr. Elder from ‘Come Into My Trading Room‘, he says:

‘Trading is an old man’s game; you need to have a good, long memory.’

Well, the author of these updates is certainly old … well into his sixties and with a long memory; The crash of ’87, debt wipeout of ’98, tech bubble crash of 2000, the 2008 meltdown and now, today.

Those advanced years tempers one’s desire to constantly jump in and out on the swings. Not to say that might need to be the method at the time; but like Van Metre’s approach, the big money’s in the big move.

The jobs data released yesterday basically tells us ‘The economy ain’t coming back’ … possibly ever, in our lifetimes.

We’re at an order of magnitude greater than 1929; it was thirty years before that market returned to its prior levels.

Which brings us back to real estate and IYR. The P&F chart shows us, if there’s a breakout to the downside, initial projection of the move is to support around 69 – 73.

Keep in mind that if (or as) price action passes down through the low 80’s, it then builds up another area of congestion projecting even lower. The initial breakdown would only be the start of downside potential.

With that in mind, the firm is in position (not advice, not a recommendation) using DRV as the trade vehicle. Stop level is in the vicinity of yesterday’s DRV low @ 10.38.

Charts by StockCharts

Note:  Posts on this site are for education purposes only.  They provide one firm’s insight on the markets.  Not investment advice.  See additional disclaimer here.

Real Estate: Subdividing Lower

Lower highs, lower lows, real estate (IYR) is subdividing.

The weekly close (above) has upward thrusts getting shorter, stalling out, then reversing.

Note the massive volume; up over 234%, from the week prior.

Drilling down to the daily, price action rose slightly (last Friday) to close just under the axis line.

We’re still below the 23.6%, retrace as reported here.

Volume evaporated on the session; declining 60% from the day prior and indicating not much interest to the up-side.

This is the danger point where the risk is least. If price action continues higher from here, it’s possible IYR may attempt a new high.

Price action declining (more probable), indicates the pivot’s in place.

Right now, bonds are stretched; ready to reverse along with the dollar.

Those two markets may put the kibosh (big time) on risk assets if they short squeeze.

Recall that IYR did not follow the rest to new highs. For months, it’s been languishing, building congestion.

Stay Tuned.

Charts by StockCharts

Note:  Posts on this site are for education purposes only.  They provide one firm’s insight on the markets.  Not investment advice.  See additional disclaimer here.

Real Estate Dead

As markets power higher, real estate topped last November; its been dead ever since.

IYR is telling us something. That something may be it’s about to be one of, if not the leader to the downside.

The last report said IYR is breaking down. This morning’s action was an upward test, then reversal.

Testing at Fibonacci 23.6%, (shown above) then reversing indicates severe weakness.

Inverse fund DRV (3X inverse IYR) is moving back into its prior trading range (11.00 – 11.50) after pushing lower in the early session.

Today could be the day. The day were real estate (IYR) begins a dynamic drop to much lower levels.

Note:  Posts on this site are for education purposes only.  They provide one firm’s insight on the markets.  Not investment advice.  See additional disclaimer here.

All But One

Of the nine market indices listed below, only one has a bearish weekly MACD cross-over:  Biotech

IYM:  Basic Materials

IBB:  Biotech

DIA:  Dow 30

IYT:  Dow transports

QQQ:  NASDAQ 100

IYR:  Real Estate

IWM:  Russell 2000

SOXX:  Semiconductors

SPY:  S&P 500

Yesterday, the indices were are at all time highs except for real estate (IYR), biotech (IBB), and Russell 2000 (IWM). 

Looking at IYR and IWM, we can see, although they are below the high, there’s still a persistent up-trend.

Even with today’s on-going reversal (three-hours before close), only biotech has posted a bearish, weekly MACD cross-over.

Of course, it won’t be known until after the fact why biotech is unique.  A hint at what might be the reason, is here (if it’s still available).

A gallery of the weekly index charts, listed above (as of 9/2/20) can be found here.

The focus of this firm, since June 3rd, exactly three months ago, has been biotech and its impending reversal.

A significant short position has been established over those three months via BIS, the 2X, inverse fund. Current Stop: 32.18

So, just what is ‘significant’?  How big is that?

To be transparent, without giving specifics, avoiding the usual internet keyboard warrior, and/or hater, the position is as follows:

We’re short what amounts to a full year’s wage for the typical American worker.  Fair enough?

When the position is closed out, results will be posted on the company site, located here.

Note:  Posts on this site are for education purposes only.  They provide one firm’s insight on the markets.  Not investment advice.  See additional disclaimer here.

Shorting The Bond Market

Who goes first?  Do bonds break to the downside, rates up, market reverses lower into a potential crash; a-la October 1987?

Or, does the market (S&P 500) peak and reverse with a flight to safety (bonds) that mitigates or negates a sharp rise in rates.

Fotosearch_k6354877Maybe it’s stocks and bonds going lower together.  No safe havens.  Is it possible?

Early this session, the ten-year rate (inverse of bonds), is hovering just below the trend-line shown in the last post.

The bond bull market has lasted forty years.  Since 1980.  Obviously, at some point, it’s over.

With long bonds (10-yr, 20-yr) hovering near a breakout to lower levels, all it would take is some kind of ‘event’ to tip the scales.

Remember that Prechter  (no matter what you think of him) said years ago, the market leads the news … not the other way around.  It’s a complete mind-shift to understand that market position, price action, actually set the conditions for news events.

The market does not ‘react’ to the news, it ‘creates’ the news itself.  So, the bond market may be about to create an event.

With that in mind, inverse fund TBT attempts to give exposure to twice the downside of the 20-year bond.

In a nutshell, if the long bond moves lower, TBT moves higher at approximately twice the percentage amount.

The chart of TBT is below and it looks very similar to the $TNX chart in the prior update.  Looking closely, one can see the downward bias errors.  With each move lower in the $TNX, the TBT moves lower still.

It’s common with all inverse funds.

2020-08-17_9-07-32-TBT-Daily-3-bar-notesEffectively trading TBT requires a sustained down move in the corresponding market (to mitigate the down-bias).  The latest example shows bonds ready to break lower with rates ($TNX) moving higher.

TBT could be in a position for trade entry (not advice).

Additionally, if bonds break decisively lower, they have potential to stop dead what’s left of the economy:  Housing market, lumber market, building construction, and on.

Remember ‘the speck‘.  It’s all about the speck floating through the air.

On a separate topic and as a courtesy (not financial advice), the short position in biotech via BIS, was closed early this session as price action hit the pre-determined 8.15, stop.

Gain on the overall short position was about 5%.


Charts by StockCharts

Note:  Posts on this site are for education purposes only.  They provide one firm’s insight on the markets.  Not investment advice.  See additional disclaimer here.