Note: Posts on this site are for education purposes only. They provide one firm’s insight on the markets. Not investment advice. See additional disclaimer here.
Nothing gets sharks in the water faster, than a failed move.
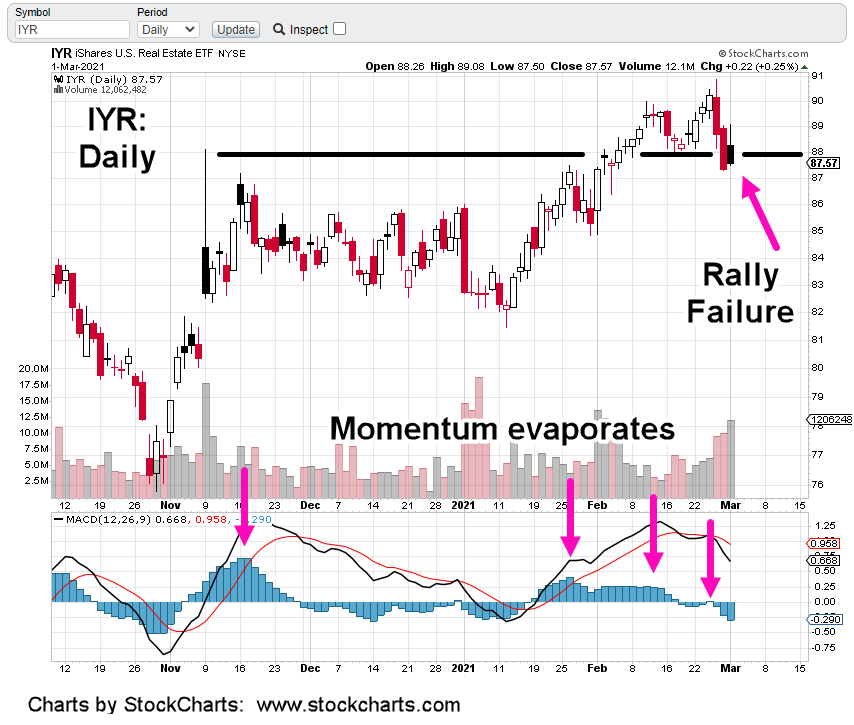
Last Friday, real estate IYR closed below support (black line). Doing so, put itself in Wyckoff spring position.
‘Spring position’ is a technical condition of instability where price can reverse dramatically.
At the open yesterday, that’s exactly what happened. IYR launched nearly instantly to a 50% retrace.
From there it was a long day of moderate price erosion all the way to the last hour; then it all went south.
IYR closed just 0.22 points higher or +0.25%, after being as high as +1.73 points (+1.98%), early in the session. In addition, that close was back below support on the heaviest volume since February 2nd. … another bearish sign.
We can see momentum, MACD has exhausted itself and posted numerous bearish divergences.
On the fundamental side, just in the past 24-hours, there’s been a raft of news articles posted showing commercial real estate’s in serious trouble.
IYR could still rally from here. However, with the conditions described in this post, it’s not likely.
Summary:
We’ve been short this market in a big way (not advice, not a recommendation) via DRV. The plan is to increase position size as long as price action allows low risk entries.
Note: Posts on this site are for education purposes only. They provide one firm’s insight on the markets. Not investment advice. See additional disclaimer here.
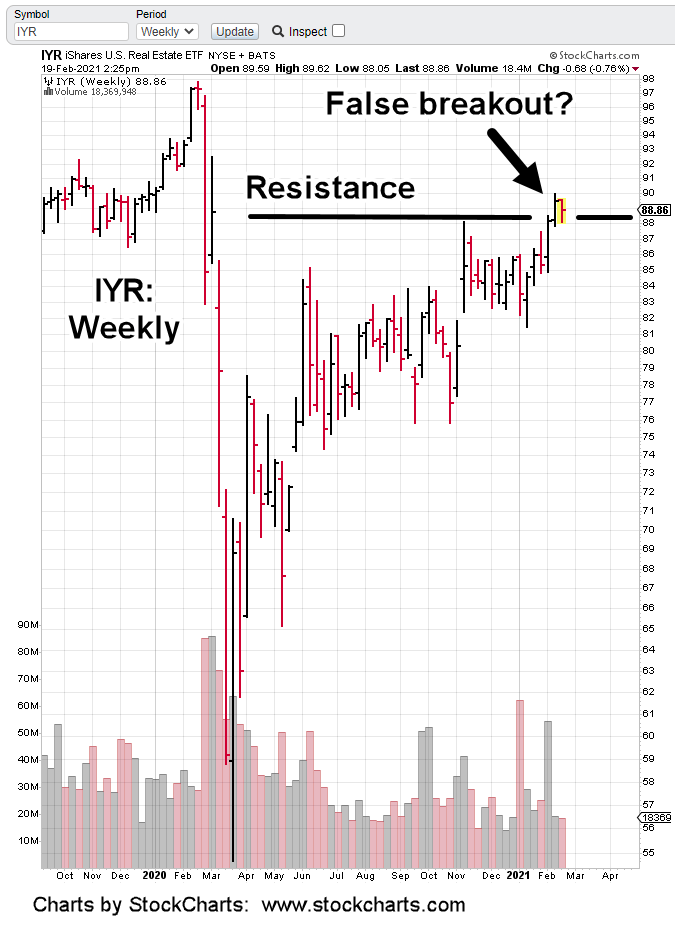
IYR has reversed with a decisive ‘outside-down’ week.
This sector has likely seen its highs for the year and probably its all-time (recovery) highs.
The latest news from Steven Van Metre does not paint a good picture for the economy or the markets (bonds excepted).
Jerimiah Babe (J.B.) has also posted an update on Los Angeles. It’s a human and economic tragedy. Unfortunately, this is where the Cadillac has gone off the cliff.
We’ve continually held to the stance, there’s no recovery.
The “recovery”, is a mainstream narrative intended to keep the herd focused in the wrong direction and on the wrong things.
Judging by the hysteria with small cap short squeezes, physical silver and bitcoin (kind of hard to access when the power goes out), the promulgator to the proletariat, the mainstream media, has done an excellent job.
Note: Posts on this site are for education purposes only. They provide one firm’s insight on the markets. Not investment advice. See additional disclaimer here.
Of course, it’s all part of the plan but that’s a topic for another time.
What’s shown in J.B.’s video(s) is that one after another, commercial properties are boarded up and fenced off.
One might think it’s only progressive utopia California that’s having a rough time; taking a look at comments to his videos shows otherwise.
Just one example taken from the video link:
“Even if the U.S. lifted all lockdown restrictions 100% TODAY, I still think for many companies, its too late.”
The economy is not coming back … not in our lifetimes anyway.
No matter what happens, re-building will take many decades. Even so, the destruction has to be completed first.
We’re nowhere near downside end (economy, markets or otherwise).
On Thursday you would’ve thought from the news, we just collapsed by 50% or more. In fact, the S&P (SPY) was only down -2.41%.
Think about what happens we get the hit … that does not come back.
As early as May 12th of last year, this site began to note the similarities of the markets to August of 1987. In retrospect, that post (and the ones that followed) seemed a little premature.
It’s a different story now.
Markets even more extended; bond rates higher.
Throughout the years, going back to the early 1900’s, the professionals always preferred down markets. Profits (and fortunes) can be made much faster and with more reliability.
Fear is much easier to gage (on the charts) than greed.
With that in mind, we can look at real estate with a clear head and assess the opportunities.
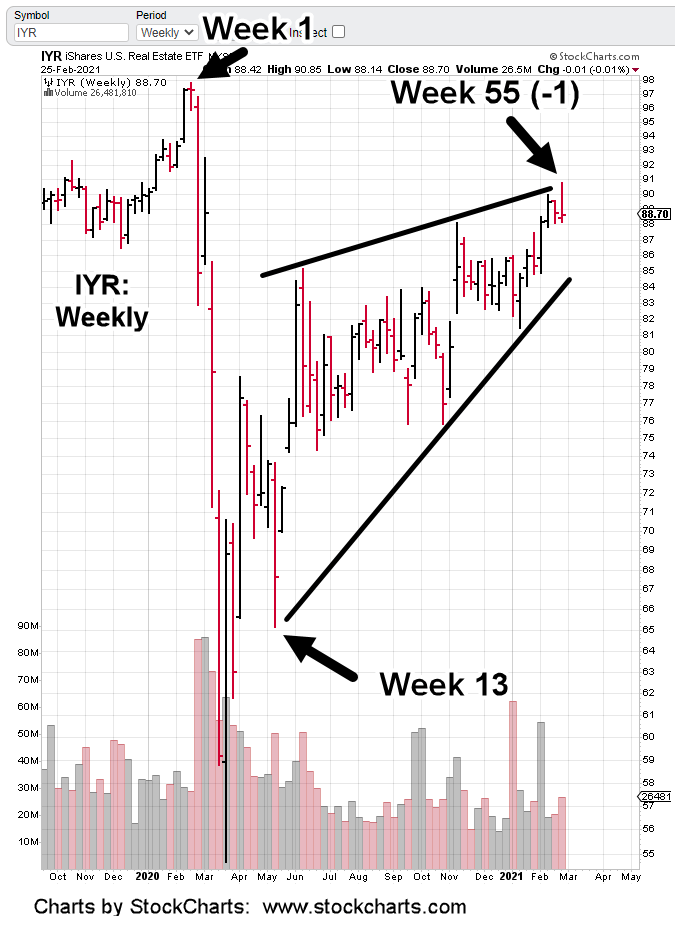
It turns out, not only has IYR got itself into a terminating wedge, it’s doing so at Fibonacci time frames.
During the past six-weeks, my firm (link here) has been positioning in and out, and back in, several times using short fund DRV (not advice not a recommendation).
Just yesterday, before IYR broke decisively lower, that DRV position was increased to its maximum level thus far.
Obviously, a new high in IYR is not anticipated. The reason for selecting real estate as a strategic short (unlike the LABD swing trade) is for the downside potential.
Inverse leveraged funds work best during a sustained, directional move. It remains to be seen if DRV was a good selection; not only for a trade vehicle, but for the anticipated collapse in real estate.
Note: Posts on this site are for education purposes only. They provide one firm’s insight on the markets. Not investment advice. See additional disclaimer here.
Note: Posts on this site are for education purposes only. They provide one firm’s insight on the markets. Not investment advice. See additional disclaimer here.
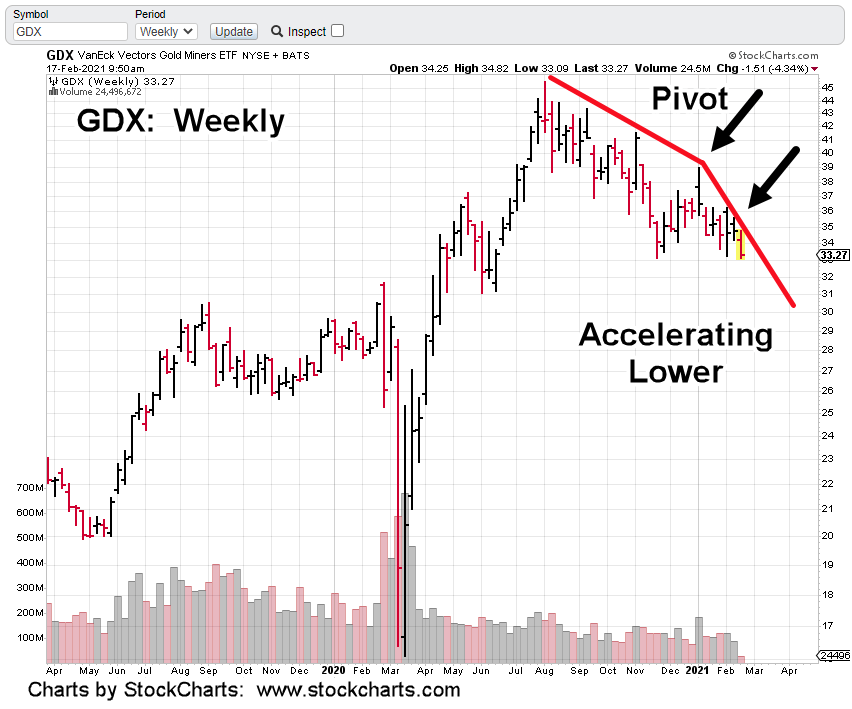
With GDX posting a new weekly low (below 33.23) early this session, it’s helping to confirm a pivot and acceleration to the downside.
Bullish or bearish, it’s a crowded trade that we’re avoiding (not advice, not a recommendation).
It took over a week of oscillating price action before GDX decided to post below the February 4th, low.
Even so, when an established low is penetrated, it puts the market in “Wyckoff Spring Position’.
That means there’ll (potentially) be some type of rally or rally attempt. If that happens, it’s just more oscillations that result in erosion of leveraged inverse funds.
Other areas of the market are performing better on the downside. Real estate IYR, looks like it may post a narrow range day (as of mid-session).
It’s typical action when at support. If there’s no break lower today, then IYR could make an attempt higher at the next session.
Based on previous analysis, that attempt (if it occurs) is expected to be short lived.
Note: Posts on this site are for education purposes only. They provide one firm’s insight on the markets. Not investment advice. See additional disclaimer here.
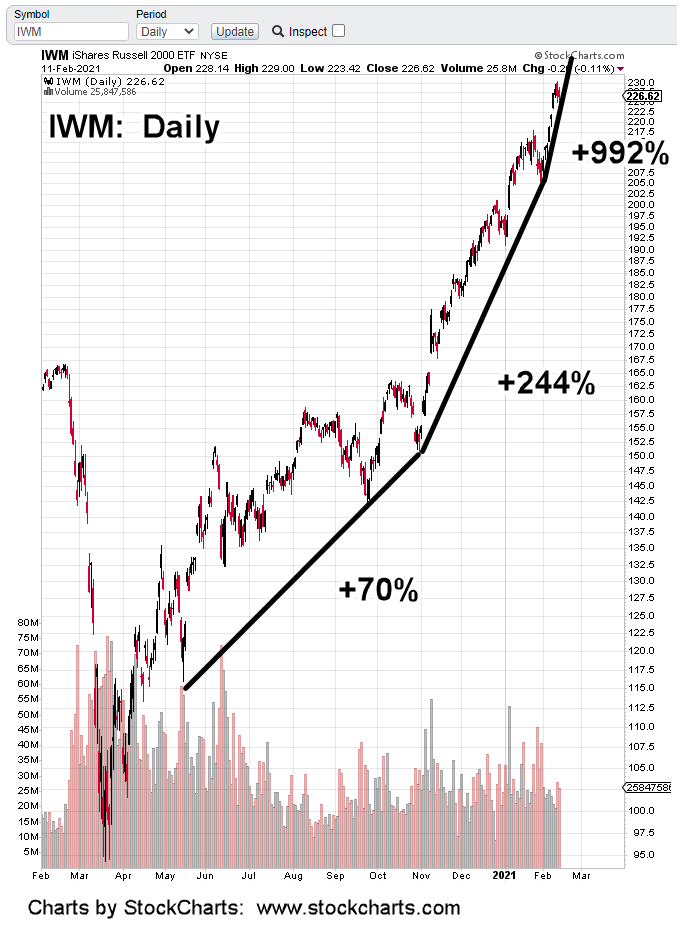
Trending higher at nearly 1,000% annualized, it’s obvious a break is coming.
Exactly how or when of course, is not known.
However, it has been proposed by this site (for years), when the final bubble-break comes, it’s likely to be an over-the-weekend event that results in a severe gap down open.
A gap down of say, 20% – 50%.
Can’t happen? After the events of 2020, we should all know that anything can happen.
Theoretically, a gap down of -25% from current levels, puts IWM right at long-time support around ~170.
Under such conditions when a severe disconnect is possible, one approach is to prepare on the short side (not advice, not a recommendation).
Using Wyckoff analysis techniques (for bear markets), that means to look for sectors not participating in the mania. When the downdraft hits, those markets will (potentially) move lower farther and faster.
That brings us to real estate, IYR
Using the same time-scale and trend line notations, we get the chart below:
From a purely visual perspective, the struggle to move higher is obvious. The past two sessions have made no net progress.
Looking more closely at recent action, IYR is following a Fibonacci time sequence.
From the low on January 12th, to the most recent high on Wednesday the 10th, is a Fibonacci 21 days.
The added bonus is the inflection point on Day 13.
Bid/Ask spreads on inverse fund DRV, in the pre-market are not that reliable; at this juncture, 8:10 a.m., EST) they indicate a higher open.
Note: Posts on this site are for education purposes only. They provide one firm’s insight on the markets. Not investment advice. See additional disclaimer here.
The final outcome. Real estate IYR has met key technical points that indicate reversal is imminent. It might not be much of a turn at the start, but the market rarely announces its intent.
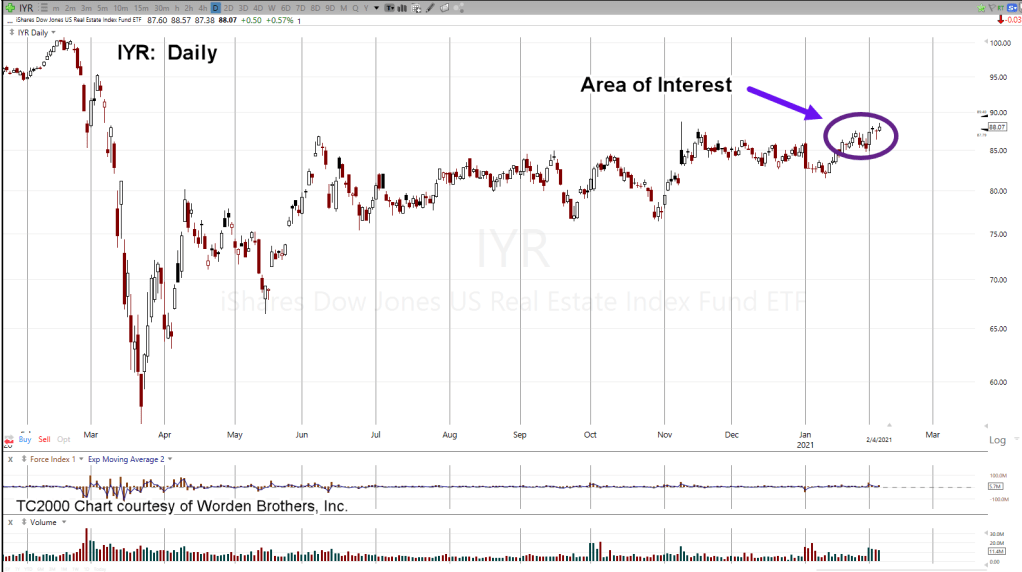
Time spent analyzing real estate seems like forever; it’s actually only been a few weeks. The daily chart above, puts it into perspective.
For the most part, trading and positioning action has been focused on the tiny circled area. Not advice, not a recommendation.
To be concise, we’ll list the known facts about the current juncture.
IYR is at Fibonacci 76.4%, retrace level from the down move that started in February – March last year.
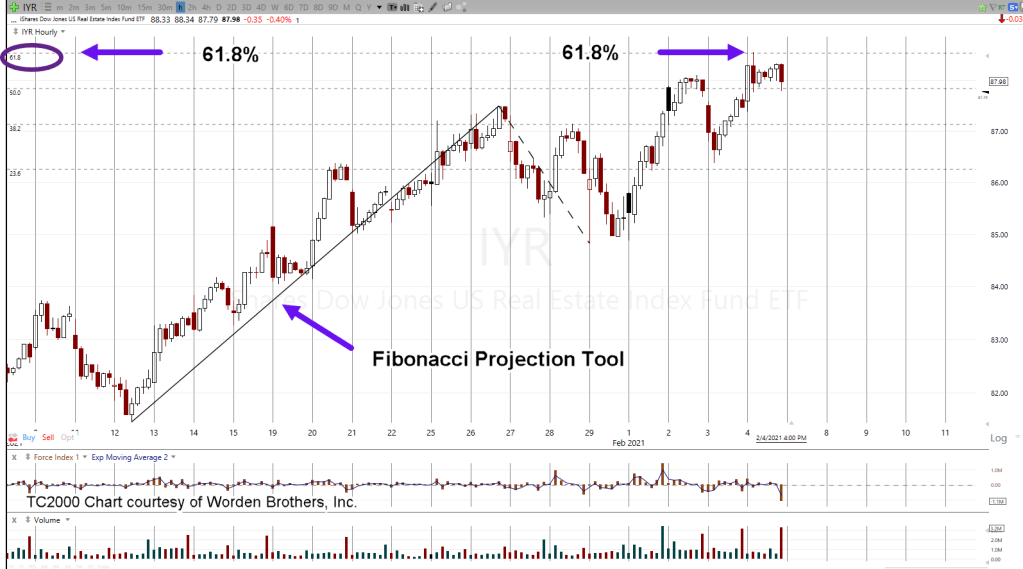
Price action has met a Fibonacci 61.8% projected move off ‘a-b-c’ wave action from the January 12th, 2021 lows.
While meeting that 61.8% projection, price action formed a terminating wedge; complete with a throw-over early in the session yesterday.
Price action closed below the prior near time high of 88.11 (close was at 88.07).
High levels of volume over the past four sessions, indicate distribution; just as it indicated accumulation at the beginning of the current move. The “Book-Ends”
Successive lower momentum energy with each net upward close since April 9th, 2020.
Supporting the potential for market reversal, bonds are at short level (and price) extremes and the dollar has already reversed.
The area of interest shown in the daily above has been expanded to hourly charts below:
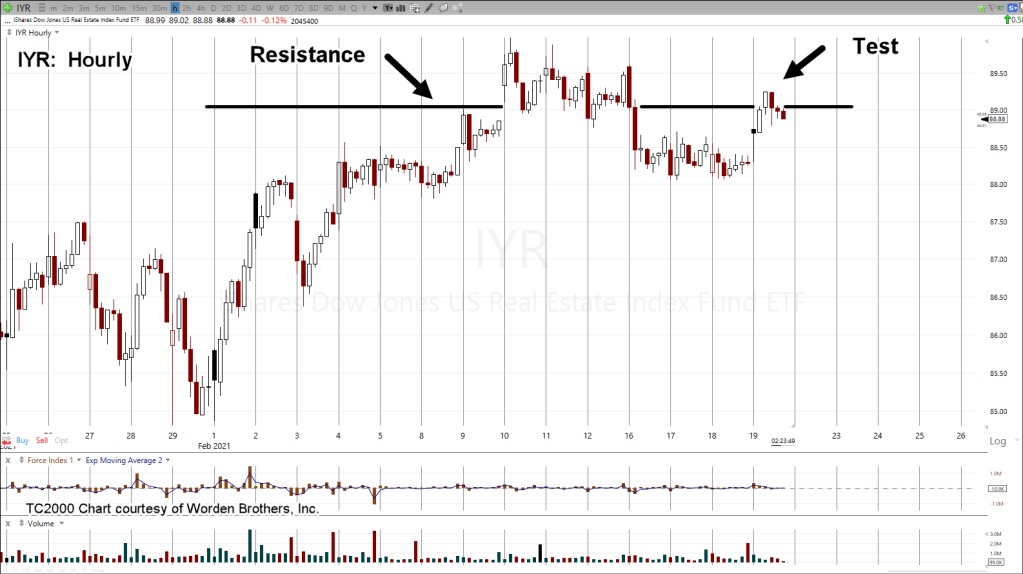
It may be a little hard to make out the Fibonacci numbers (61.8%, circled), but early yesterday, price action posted higher and reversed off the Fibonacci 61.8% level.
The hourly below, shows in addition to meeting Fib targets, a terminating wedge had also been formed:
The last chart, the daily, has IYR posting right at Fibonacci 76.4% retrace of the entire down move from February – March last year.
If IYR does not reverse at this juncture (or within tenths of a point), then it’s headed to much higher levels.
Considering all the facts; the extremes, bonds, dollar, and now gold and silver in a deflation impulse; significantly higher prices for IYR seem unlikely indeed.
Stay Tuned
Note: Posts on this site are for education purposes only. They provide one firm’s insight on the markets. Not investment advice. See additional disclaimer here.
Note: Posts on this site are for education purposes only. They provide one firm’s insight on the markets. Not investment advice. See additional disclaimer here.
Pre-market action has all major indexes trading lower; SPY, DIA, QQQ, SOXX and IWM; all down.
Real estate, IYR has no real pre-market volume (20-shares) so its open is unknown. However, inverse fund DRV, does have volume (3,700 shares) and its action is up about 4%.
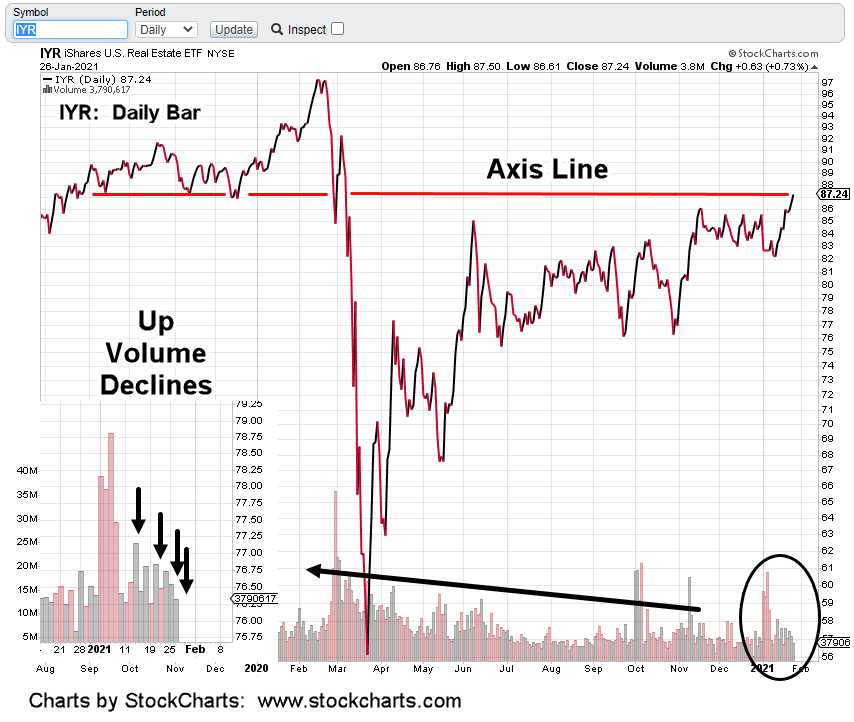
The daily close chart of IYR (above), has price action contacting an established axis line.
That was yesterday. Over the past two-weeks, as price ratcheted higher volume has declined (circled area enlarged).
That decline indicates lack of commitment at these levels.
Yesterday’s close also put IYR firmly in up-thrust position (ready for reversal).
Over the past week, short positions were opened using DRV (not advice, not a recommendation)
Average price of the short equates to DRV @ 9.92; not far from current pre-market trading.
If IYR posts a new daily low (below 86.62), it’s another data point the anticipated reversal may be at hand.
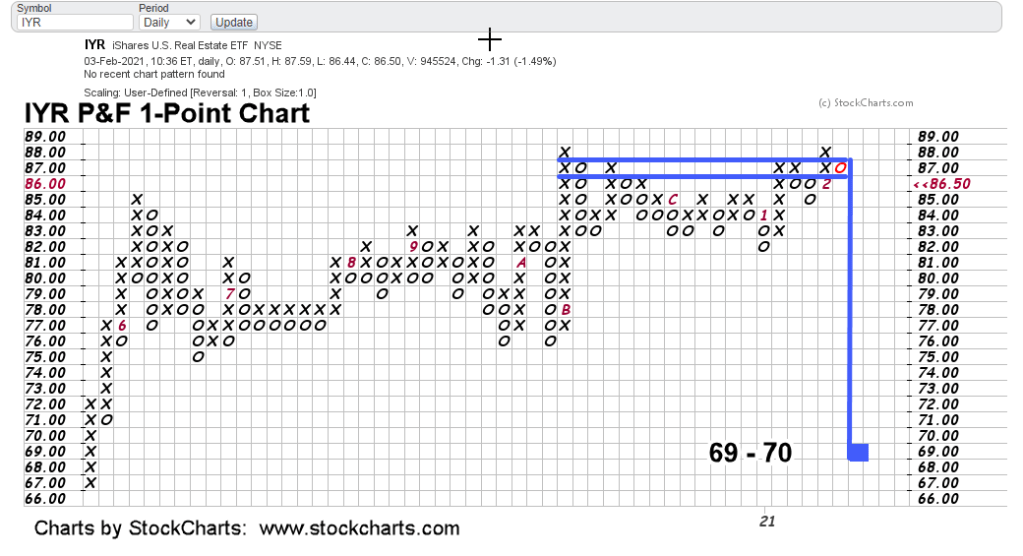
The rising action has changed the P&F forecast reported a few days back. Updates will be forthcoming.
If this is the start of a sustained reversal, the plan is to build the short position as price action dictates.
The downside of the entire market (S&P, Dow, etc.) is immense. Commercial real estate is especially vulnerable. Price action itself tells us that.
Note: Posts on this site are for education purposes only. They provide one firm’s insight on the markets. Not investment advice. See additional disclaimer here.