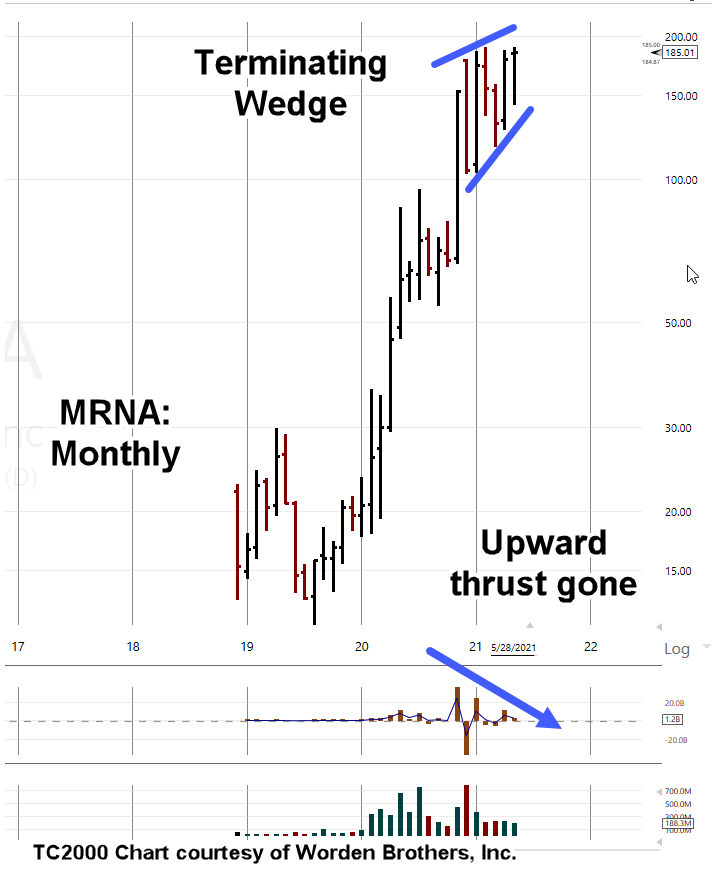
Insiders are bailing out. The jig is up.
Insider transaction data at this link.
MRNA has not been around long from a trading standpoint.
Long enough though, for a quick 1,000% price increase so insiders can bail with huge profits; leaving the bag to the uninformed retail ‘investor’.
SeekingAlpha:
A quick search of the proletariat at SeekingAlpha turns up several ‘analysis’ articles on MRNA.
Specific links won’t be provided.
We’re not going to provide links and justify the brainwashed, everybody’s thinking the same thing mentality that seems to permeate the site’s ‘presenters’.
Incredibly, the last three articles on MRNA do not contain a single price chart. It’s hard to say where a company is headed without consulting the truth; that is, price action.
Search MRNA if you like but be prepared to hold your nose.
To be fair, the comment section on the latest Moderna post does have a few frustrated souls attempting to get the word out.
It’s a futile effort to argue … no one can tell the difference and the sane person looks to be insane.
Spending time either creating articles for SeekingAlpha or commenting on such, is a waste. It’s a distraction (like attempting to locate the source of the ‘speck’) from the real work at hand.
However, it does provide a fantastic insight into the current group-think.
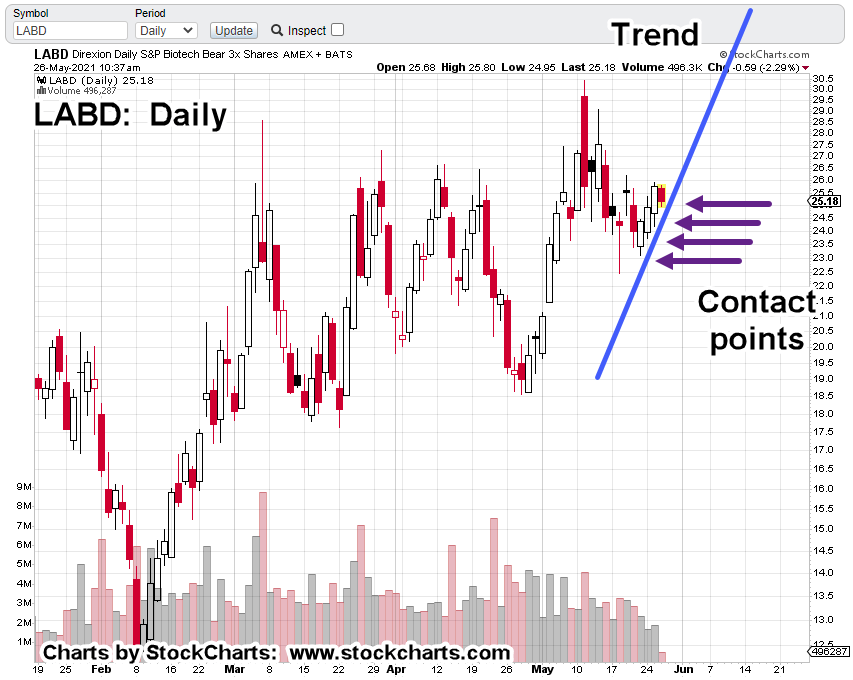
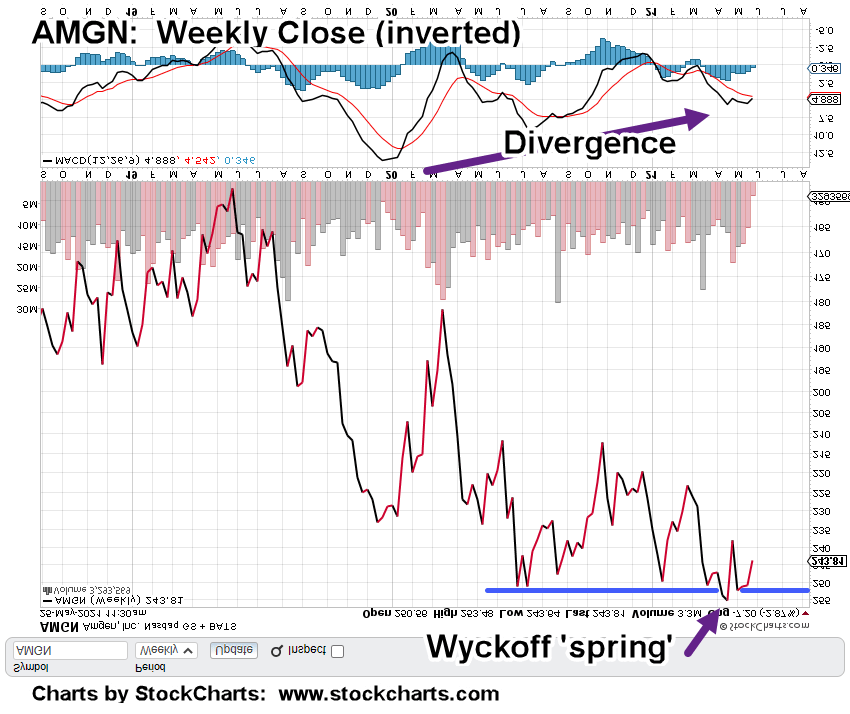
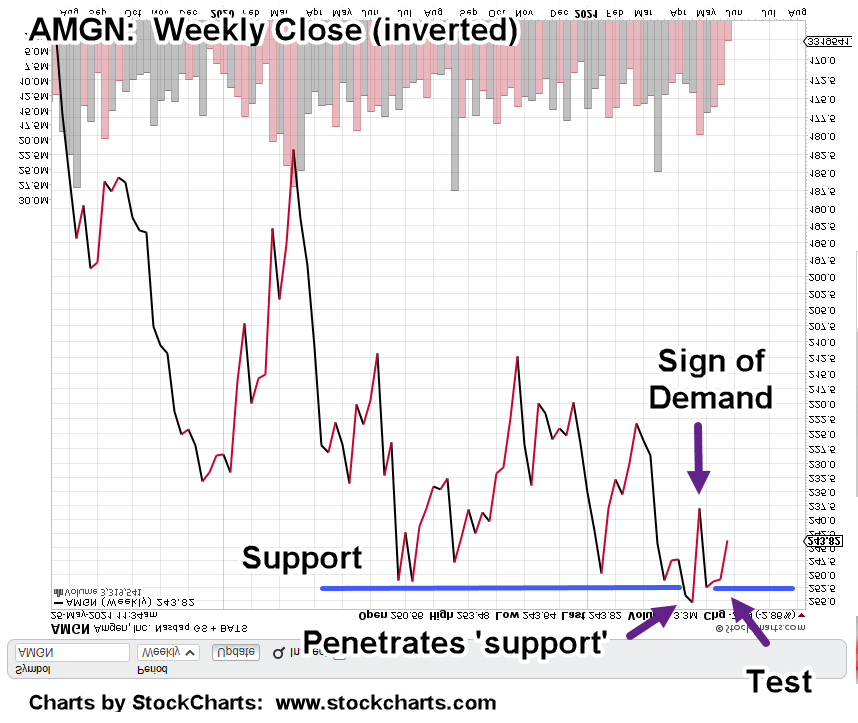
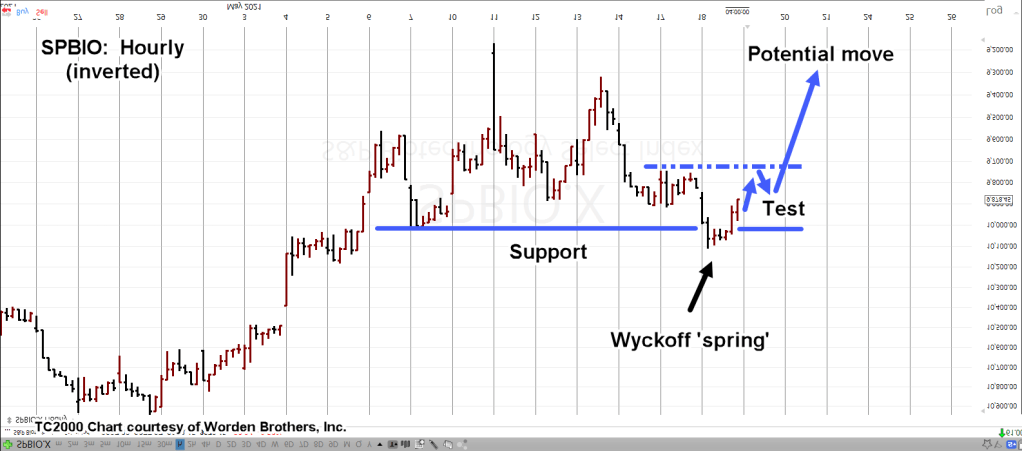
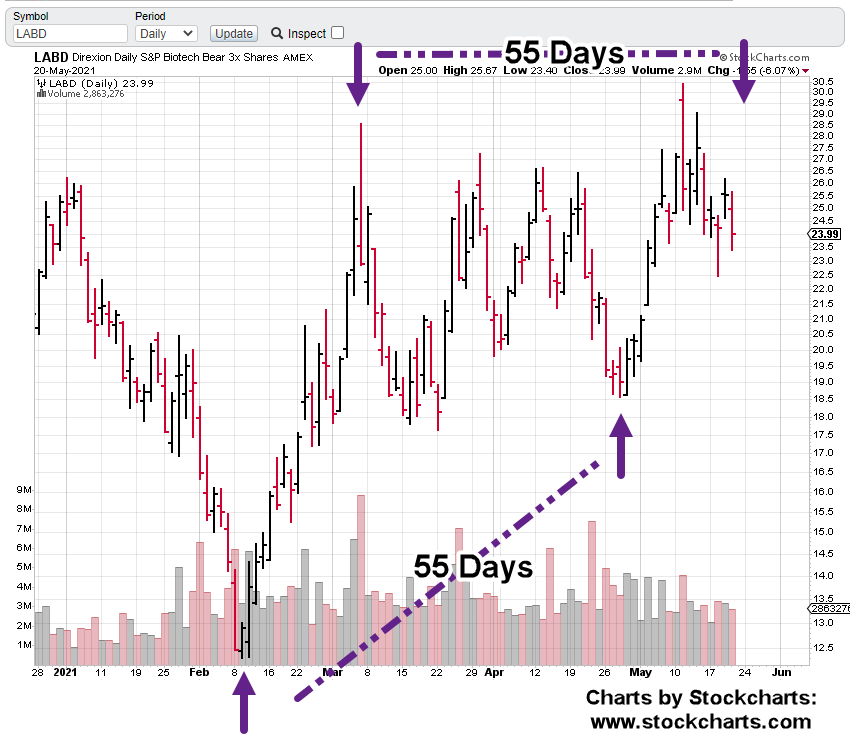
Biotech Sector:
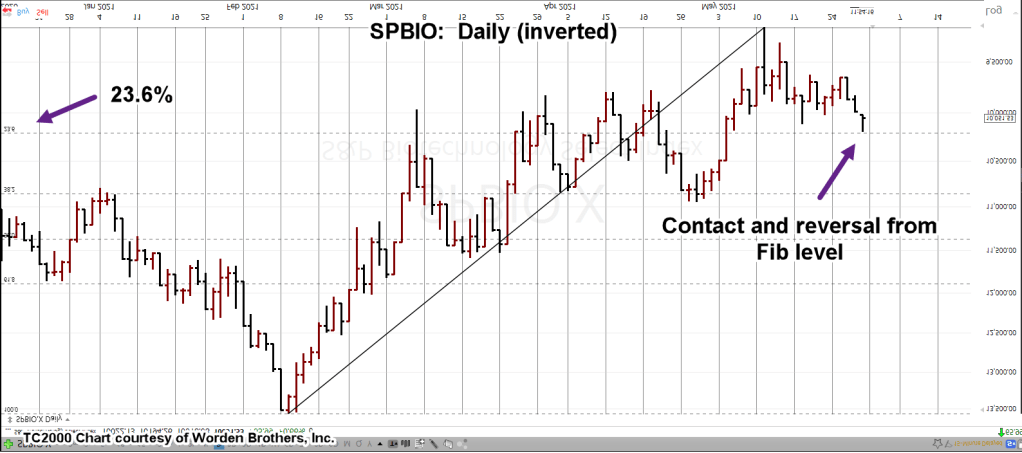
The last update on SPBIO, had it testing and reversing at the Fibonacci 23.6%, level.
The index could continue lower without delay. Or, as is typical market behavior, it will attempt to re-establish some kind of upward move.
Updates on the sector to be forthcoming based on price action.
Stay Tuned