There was an initial gap-lower open for SPBIO with LABD, opening higher … but then what happened?
Price action went all the way down (for LABD) to the prior session low. That low was then penetraed by just 0.04-points.
That’s just enough to clear out tight stops, novices and short-term traders; all in one shot (no pun intended).
The fact LABD price action immediately rebounded from the lows, now trading higher, indicates possible trend line verification.
LABD (SPBIO) Analysis:
The LABD daily chart (above) has potential right-side trend verification happening now.
Price action cleared out the stops and hit the support/resistance boundary (dashed magenta line) simultaneously.
The weekly chart below, has one potential move:
Many “Ifs”
If we’re verifying the right side of a trend line and if that trend line is actually part of a channel and if LABD price action is pivoting to the upside, then we’ve got a potential trade (not advice, not a recommendation) that might culminate during the third week of October when markets typically bottom out.
So, we’ve got three “ifs”, one “then”, one “potential”, one “trade”, one “might” and one “typically”.
That sounds reasonable 🙂
On the plus side, there’s not yet been a serious upside move in SPBIO, that would negate the downside potential.
Fundamentals are coming out by the day if not the hour. Whether or not it’s all controlled opposition is unknown to us in the proletariat.
We’re not counting on legal action but price action itself.
That action continues to say that biotech is sub-dividing lower with LABD higher.
Stay Tuned
Note: Posts on this site are for education purposes only. They provide one firm’s insight on the markets. Not investment advice. See additional disclaimer here.
If you’re serious about your growth with market analysis and trading, at some point in the journey, you’ll discover this fact:
The most successful and effective market speculators operate alone.
Livermore had his office with the ticker, ‘board boys’, and not much else.
Wyckoff (from his autobiography) refused over and over the overtures of his wealthy clients to establish a more personal relationship.
The late David Weis was the same; managing his own account.
One difference with him; he provided a mentoring service that passed on his valuable insight.
It was a steal of a price (back in 2011) … just $1,500.
Personal Anecdote (being mentored by Weis):
It was April, of 2011:
As Weis interviewed me on the phone, asking all sorts of questions about my background (engineering), my parents (my late father, a Yugoslav national, shot by Germans in an attempted execution during WWII), and my trading objectives, it became clear to me, I would pay whatever price necessary to gain an audience with him.
This all took place before his website was complete and before his book was published. It was sort of a ‘golden time’.
Stretched Growth:
Weis traded the futures markets. If I was to be mentored by him, I would need to get up to speed and trade futures as well.
I knew almost nothing (except they were highly leveraged) about those markets. However, I was determined to learn very quickly.
During the phone interview, which lasted maybe forty minutes to an hour, he did not mention (and I did not ask) the cost of his services.
As the call progressed, I was literally getting sick with anticipation.
Coming to a close, almost absentmindedly, he said: ‘It’ll be $1,500’.
I fully expected him to say, and would have gladly paid $5,000 or more … which was the going rate for a typical trading course.
He then ‘suggested’ that I open a futures account; our mentoring sessions would start the next week.
Fast Track:
After that call, three things happened in quick succession.
First: A check (he was old-school) was mailed off to him in Boston so that it would clear before the next week.
Second: I contacted TradeStation and got their futures paperwork to open an account. That happened quickly and $15,000 (an amount suggested by Weis), was wired to the account.
Third: Buy the time of the first session, I already had the futures account set up and had determined what markets I would be trading: The LIFFE mini-futures (now part of ICE Futures Europe) for gold and silver.
On The Fly:
One last thing about trading futures and learning quickly.
I noticed about two weeks into trading silver, the volume on the contract I was in, started to drop off.
I did not understand why the liquidity was drying up … that is, until I checked my e-mails.
Turns out, I was about to ‘take delivery’, and pay $37,000 for a bar of silver if I did not exit the contract (that day).
The entire time with Weis was a growth experience. Very painful most of the time as knowledge had be acquired on the spot.
During our sessions, I would have the phone to my ear and be feverishly taking ‘screen shots’ of his computer (via gotomeeting,com) as he progressed through the session.
This link is probably as close as one will come to a typical mentoring session.
No Group Consensus:
Going to the link and watching for even a few minutes, it’s obvious this type of analysis is in a class of its own.
Nowhere in the video does he mention P/E ratios, Sales-to-Book or any number of useless metrics.
Deciding to pursue this type of trading, will of itself, separate you from the crowd.
The mainstream financial press will never present this level of detail. The general pubic does not have the intellectual capability or discipline to really get down and craft this skill.
Of course the financial media, YouTuber’s and the like, are all too happy to cater this (mediocre) crowd by showing their supposed prowess on dissecting financial reports and/or pontificating on the latest Fed speech.
Little does the public know, this type analysis (fundamental metrics) is just a ruse; a distraction promulgated over the life of the markets to distract and disable the masses.
The fact that ruse keeps going, is proof in itself of its effectiveness.
Which brings us, once again, to biotech.
SPBIO (LABD): Analysis
In this case, which could be one of a kind in history, the fundamentals are important.
Those in the biotech sector have intentionally (depending on whose data is used) fatally poisoned millions if not billions.
Their natural immune systems have been forever destroyed and their life expectancy drastically shortened.
Even so, this fundamental backdrop must not cloud interpreting the market behavior at hand and the Wyckoff analysis.
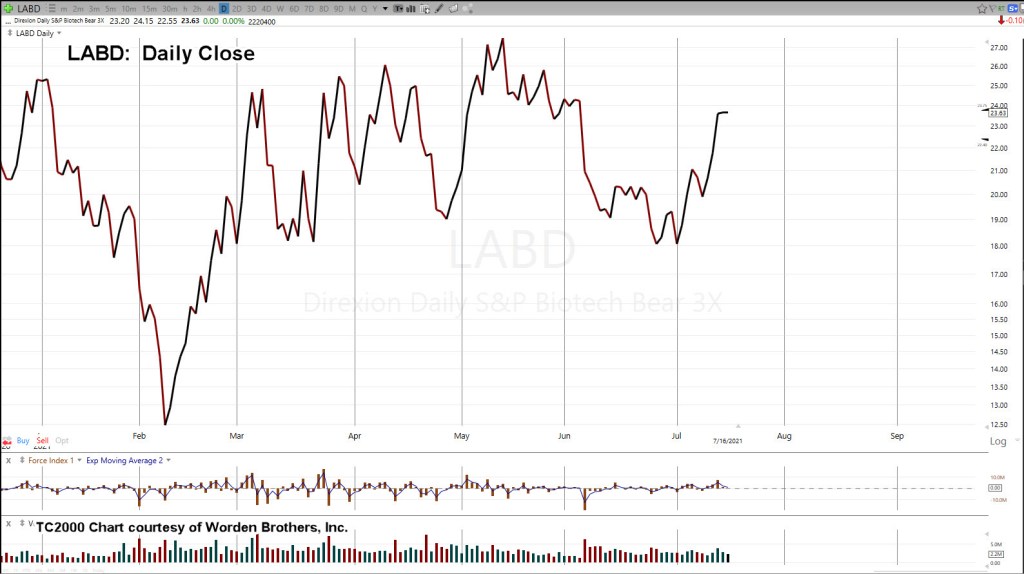
We’ll start as Weis does in the video link, with an un-marked chart. Daily close of inverse fund LABD:
Next we’ll show how the right side action is alternating its behavior:
At this juncture, the market is not able to retrace.
Price action from the last intermediate low in late June, has formed a double, then single, and then no bottom.
Adding in the repeating trendline study, LABD is currently near a contact point on the right side trend:
Price action itself points to more downside for SPBIO (LABD higher).
With the overall markets closing poorly on Friday, the implication is for lower action in the coming week.
Consumer All Done:
The post on Friday, showed how the consumer is literally spent.
Then, couple that with Dan’s (iAllegedly) assessment: “The Party’s Over”; the pressure continues to build.
We might take the example of lumber futures as a model for upcoming price action; essentially, straight down -66.3%, in 48 trading days.
Wistful Conclusion:
David Weis is now gone (passed away last year).
After listening to his voice once again, I have let it personally admonish me to remain focused and diligent.
Even a decade after our mentoring sessions, with focused effort, the search for mastery is never ending.
To borrow a quote from Oswald Chambers: “One must determine to be limited and focus their affinities.”
We’re at a critical time in world history and that’s not overstated.
Our conditions have brought so many cowards to the fore.
In a way, it’s a tremendous public service.
It’s clear to see who is leading and who is cowering in place.
If anyone has a hope of surviving (even prospering) in this environment, for some it will be taking control of their own market decisions; separating themselves from those who want them to remain ignorant.
Stepping out into the raw edge of life, has no guarantee of success.
However, what is guaranteed, is stretching of oneself into a new level of thinking, experience, and wisdom.
That, is its own reward.
Stay Tuned
Note: Posts on this site are for education purposes only. They provide one firm’s insight on the markets. Not investment advice. See additional disclaimer here.
That’s a comment often seen on any number of Jerimiah Babe’s updates; openly mocking his doom and gloom assessment.
Whether he’s at the local homeless camp in Los Angeles, or in his home next to the golf course, the question remains the same;
‘J.B., When’s the collapse?’
Sometimes his response (if he’s at home) is to turn his head to the window and say “Have you looked outside?”
A good number of American’s have become so pathetically weak, ignorant, and just (to overuse the word) plain stupid, they expect to sit on their newly built patio deck (using last year’s stimmie check) and observe the fall of the U.S. from the comforts of their own back-yard.
Of course, there are some (including this author) who are first generation Americans. Their parents and grandparents emigrated (or escaped) from communist countries.
Those people do not have to ‘wake up’; they were never asleep.
Coming Attractions:
South Africa gives us the model for what’s in store … at least for sections of the U.S.; probably starting first with the blue sates (we’ll see).
You might say, it’s already happening in Portland.
Yesterday’s update showed how the so-called ‘bloodbath‘ was actually a set-up to go long (not advice, not a recommendation).
It didn’t take long for bonds (TLT) to give a Weis method ‘buy signal’. That happened at the open today.
The bull move in bonds does not confirm the ‘re-opening’ hype. That in itself, should be all that’s needed to make decisions.
It is interesting to note; on sites like ZeroHedge, there’s no talk whatsoever that biotech has (already) reversed and is leading the way down.
As of this post, inverse biotech fund LABD, is up about 38%, from its lows of late June. It appears poised for yet another breakout; lower for SPBIO and higher for LABD.
Note: Posts on this site are for education purposes only. They provide one firm’s insight on the markets. Not investment advice. See additional disclaimer here.
Inverse biotech, LABD above, is confirming a pivot.
The magenta arrows show contact points morphing into a pivot that has two more contacts.
The new trendline was copied, then pasted to the far left of the chart.
It’s clear the new (pivot) trend is identical to the one created when LABD bottomed out this past February.
While the overall markets (S&P, Dow, COMPX) are still showing green, biotech looks like it has started the next leg down.
The original short position via LABD, has remained intact (not advice, not a recommendation) and has been increased five times (including today) since the beginning of this month.
In our view, biotech’s signaling the potential for a very dangerous situation.
Biotech’s headed down and we’re already short; not advice, not a recommendation..
As Livermore said a hundred years ago, ‘surprises tend to happen in the direction of trend.’
Stay Tuned
Note: Posts on this site are for education purposes only. They provide one firm’s insight on the markets. Not investment advice. See additional disclaimer here.
Events have been set in motion; not necessarily immediately but it has started nonetheless.
Market Positioning:
So, here we are going into the weekend.
Does anyone want to be long the market at this point (not advice, not a recommendation)?
There must be some that do as we’re still at elevated levels.
The trade approach implemented on this site (i.e., positioning short), takes into account and actually plans for a ‘disconnect’.
Only the inexperienced or naïve think (at this time in market history) they can get out as easily as they got in; i.e. day and swing trading.
Analysis: SPBIO (LABD):
We’ll start close in first and look at the hourly LABD:
Price action has come back to test the boundary (blue line).
As frustrating as it might seem (and it is), this is normal market behavior. The market itself has to define who is in control; bulls or bears.
It’s never ending.
That’s why a case has been built on the fundamental side; why biotech is subject to a massive implosion.
That backdrop, is being supported (little by little) with price action and thus, helps keep the mind focused.
If we pull out to the daily, we see the familiar trend-line(s):
We’re at another danger point. Price action can go either way.
If LABD pivots higher from here, it’s one more confirmation that we’re trending higher (SPBIO, lower) into our October-exit timeframe (not advice, not a recommendation).
Stay Tuned
Note: Posts on this site are for education purposes only. They provide one firm’s insight on the markets. Not investment advice. See additional disclaimer here.
This morning’s gap lower in SPBIO (LABD higher) was fully expected.
Expected as well, is the retrace in progress as of this post.
Today, is Fibonacci Day 8 from the LABD, pivot low of June 28th.
Biotech (SPBIO) has posted a fantastic time sequence on the daily as well as the weekly.
The gap-lower open in the S&P (more so for SOXX) has everyone sharpening their pencils; wondering, if ‘this is it?’.
It could be.
However, with attention now focused on potential downside, the clean Fibonacci sequences are likely to morph into chaotic movement.
The time for low-risk short positioning (not advice, not a recommendation) in this sector may be coming to an end.
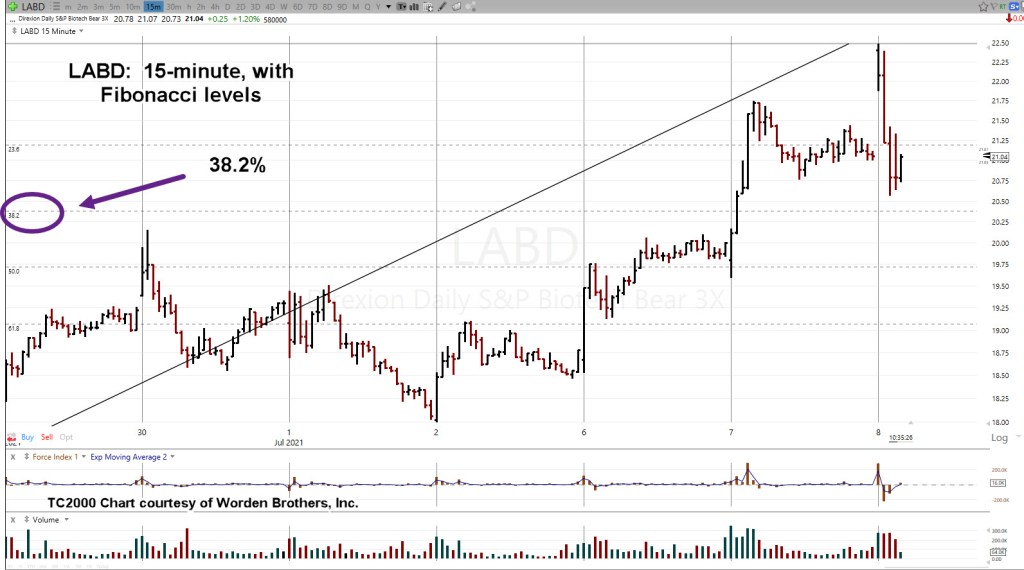
Looking at inverse LABD, and using the Fibonacci retrace tool, it’s likely price action will retrace to at least the 38%, level.
At this point, it’s already close:
The inverse biotech LABD, 15-minute chart (above) shows we’re near the 38%, level.
After today, the expectation is for price action to become SPBIO downside chaotic … long enough to frustrate the late-comers to the sector.
After that, and however long that is, price action may once again become orderly.
Stay Tuned
Note: Posts on this site are for education purposes only. They provide one firm’s insight on the markets. Not investment advice. See additional disclaimer here.
After BA pilot fatalities were confirmed, at least one airline is backing off from insisting their pilots are injected.
Some adverse reactions linked above, occurred in-flight; the pilot was incapacitated.
“Is there a pilot on-board?”
That could become a frequent call through the cabin intercom in the months … even years to come.
The bottom line implications are obvious.
The response to ‘back-off’ probably has nothing to do with safety and more to do with protecting those executive stock options.
Which brings us to the markets.
Analysis: SPBIO (LABD)
The last update for biotech said it was ‘about to get real’. So, it has.
Looking at SPBIO inverse fund LABD, we have the familiar trend lines:
The market itself says it wants to follow this trend.
Pulling out to the weekly, we get what seems to be an incredible picture.
At the beginning of the trade, the short position in SPBIO, via LABD (not advice, not a recommendation), had an exit time-frame during the second, or third week of October.
From an empirical and seasonal standpoint, that’s when on-going downtrends tend to reach their lows.
Already Baked In:
Various numbers are bandied about as to how many have been injected.
One estimate is 2-Billion, world-wide (Dr. Coleman if memory serves).
Total population at 7.9-Billion; 2-Billion, equates roughly to 25%
No matter what happens, de-population is already baked-in.
Stay Tuned
Note: Posts on this site are for education purposes only. They provide one firm’s insight on the markets. Not investment advice. See additional disclaimer here.
It’s a list of empirical observation that market tops (reversals) tend to occur during holiday weeks.
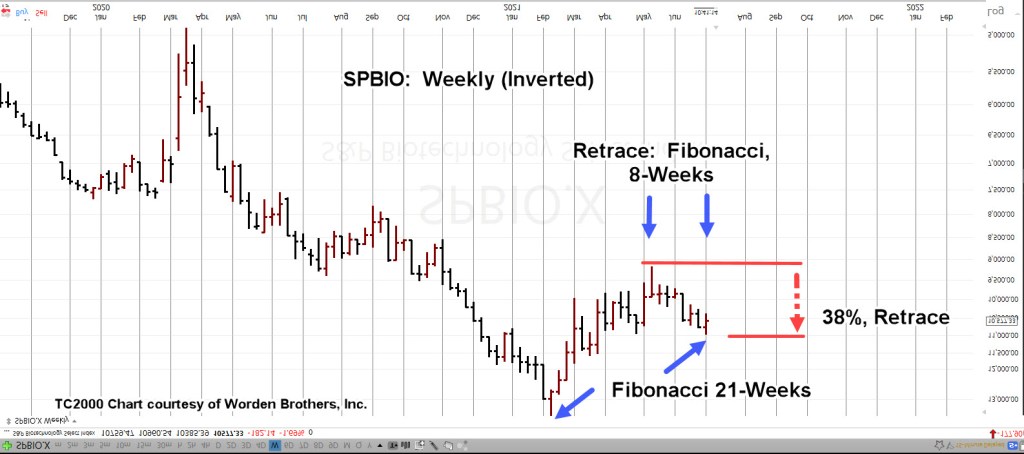
The weekly chart of biotech SPBIO (which has been inverted), shows a Fibonacci 21-weeks, from the all time high (low on the chart) to this week’s pivot:
Not only is SPBIO adhering to Fibonacci time prints on the weekly, it’s doing it on the daily as well.
It was a Fibonacci 34 days to complete the 38%, retrace.
It was a Fibonacci 5 days to complete the most recent reversal and test; culminating early this session.
As stated many times, the bottom may fall out of biotech.
Someone or something in the criminal cabal is going to let loose; fully exposing the real intent of the entire operation.
Recall Prechter’s admonition; ‘price leads the news’
If SPBIO reverses at week 21, with a decisive move lower, it may not be long before news precipitates out into the mainstream.
We’re now two-hours into the trading day.
It’s typical for SPBIO, to begin its erosion (discussed here). Let’s see if it can retrace the sharp down move from the early session.
Stay Tuned
Note: Posts on this site are for education purposes only. They provide one firm’s insight on the markets. Not investment advice. See additional disclaimer here.
However, those fully immersed in their evil, are not aware when sentiment changes.
How can they be?
They don’t have the discernment (a God-given gift), that lets them know when the jig is up.
The statements made by the organization’s CEO listed in the title block, sorry, you’ll have to do your own search, we’re not providing links for what should be obvious reasons, has instantly brought the entire ‘charitable foundation’ schtick under suspicion if not outright exposure.
The visceral response to those statements was immediate.
Complexion of the so called ‘charitable’ industries has forever changed.
Has sentiment for the biotech euthanasia project changed also?
As always, price action is the final arbiter. Anything can happen.
Chart Analysis: Biotech, SPBIO
At this juncture biotech and specifically SPBIO, has pivoted decisively to the downside.
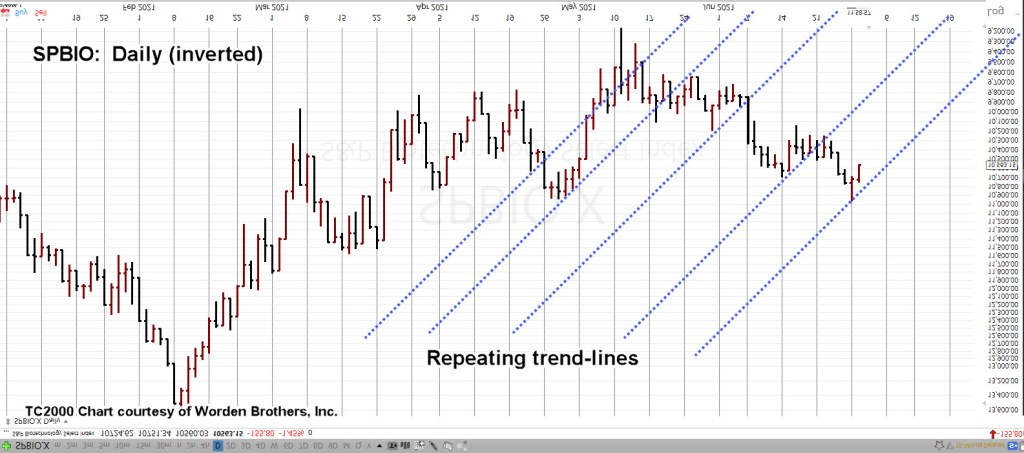
As with yesterday’s update, the daily SPBIO chart is inverted and annotated:
The ‘repeating trendline’ concept that’s been discussed for nearly the entire seven week corrective period, is included above.
This time, it looks like we’ve reached the right-edge.
Stay Tuned
Note: Posts on this site are for education purposes only. They provide one firm’s insight on the markets. Not investment advice. See additional disclaimer here.
Over the past seven weeks, as the biotech indexes worked their way through a corrective retrace, there were no guarantees we’d get such an obvious reversal.
A market disconnect could have happened at any time (and is still a possibility).
At this juncture with SPBIO, penetrating and rejecting a prior resistance area, we’re likely on the way to much lower levels.
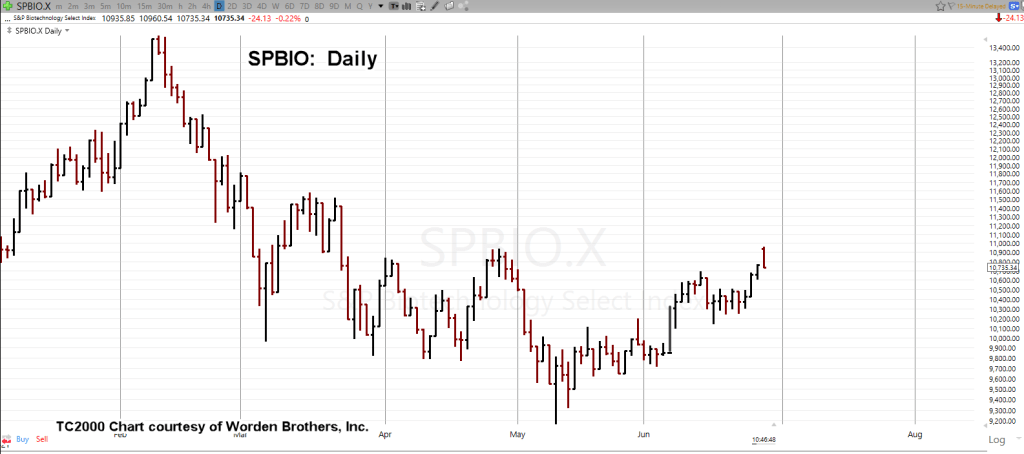
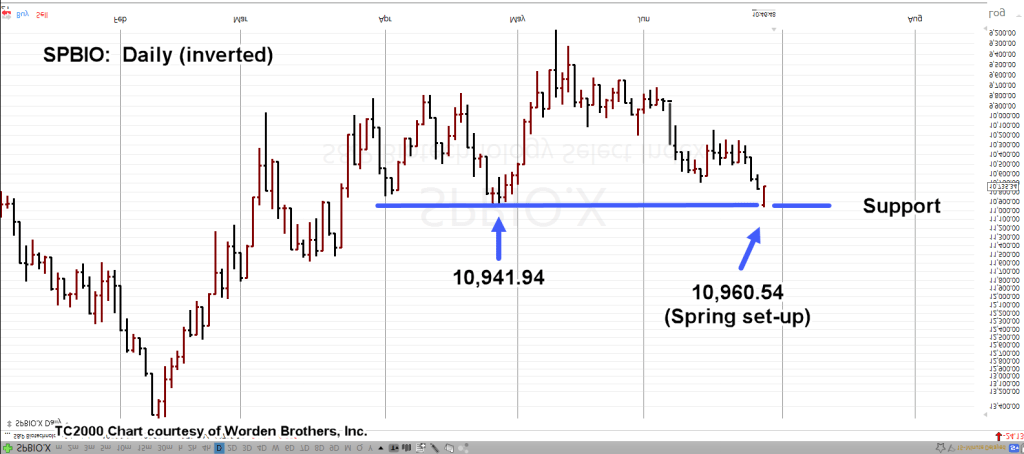
The daily SPBIO is below. The next chart has it inverted with notations added:
Inverted. Notations added:
We see penetration below the blue line support area. This sets up the Wyckoff spring condition (up-thrust, non-inverted).
The last update, showed thrust energy already divergent; set for reversal.
Note:
The criminal behavior within this sector continues to mount by the day.
Operating with impunity.
When, how, or if that breaks out into the open, is the big unknown.
SPBIO, Character Change:
One of the benefits (if you can call it that) of having a position that’s eroding by the day, is that you get very intimate with the behavior of price action.
Consider it an ‘opportunity’ to focus the mind.
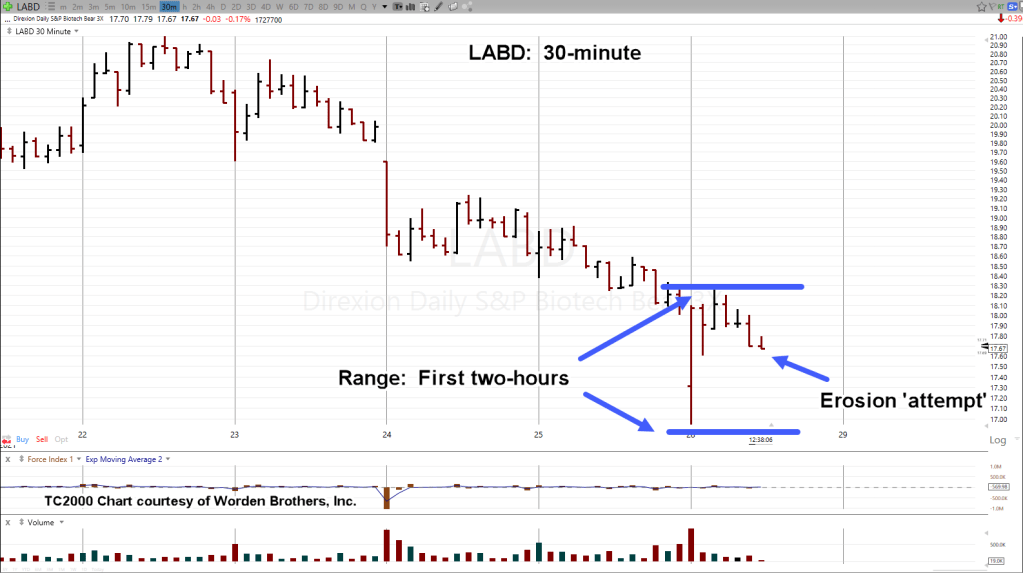
The typical behavior of SPBIO (and inverse LABD), is to establish the day’s trading range within the first two hours of the session.
Consider those two hours as the ‘head fake’ as that range is then eroded throughout the rest of the day.
Today’s session has been no different. A wide range established early but here’s the change; There’s been little, to no erosion.
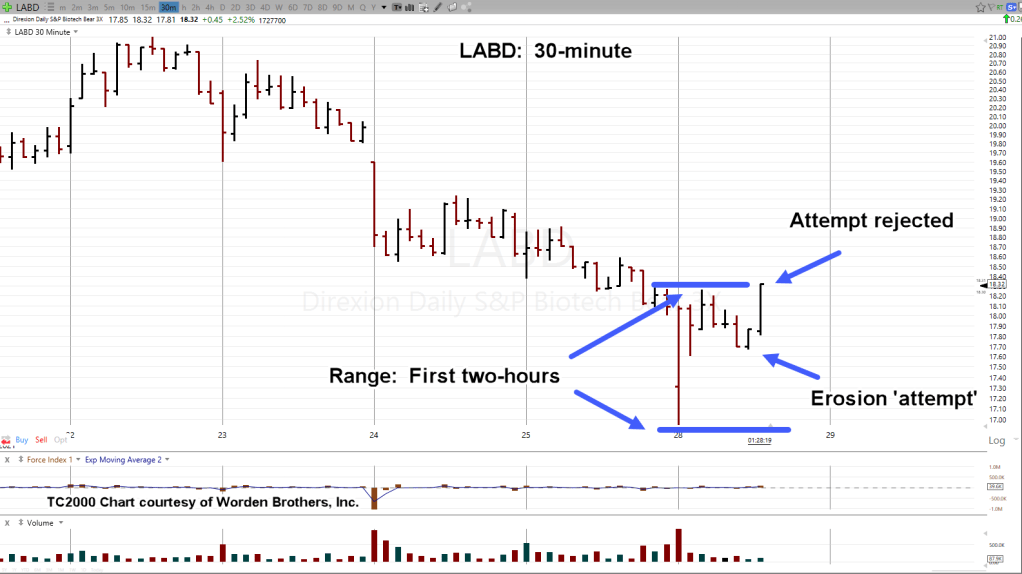
As if on cue, during the third hour of trade, SPBIO attempted to erode the range. Inverse LABD, shown below.
However, that attempt appears to have been rejected:
As of this post, price action can’t get itself (appreciably) back into the early morning’s range. The character of the index has changed.
Stay Tuned
Note: Posts on this site are for education purposes only. They provide one firm’s insight on the markets. Not investment advice. See additional disclaimer here.