Trading The Price … Not The Narrative

The narrative and the price don’t agree; at least at this point.
Over and again, we hear it’s ‘dollar destruction’ and ‘hyperinflation’.
Here is a link to one of the latest pontifications on what ‘inflation’ is doing or is going to do.
After watching that, one is so much better informed. Well, at least we know what the bit-players are saying … each reading from their own (pre-approved) script.
Let’s get back to reality and the price action at hand.
We’ll start with this quote from the last update which references shorting the gold miners using JDST (not advice, not a recommendation).
“However, something that can be done is to use that upward bias to position short at the lowest risk possible.”
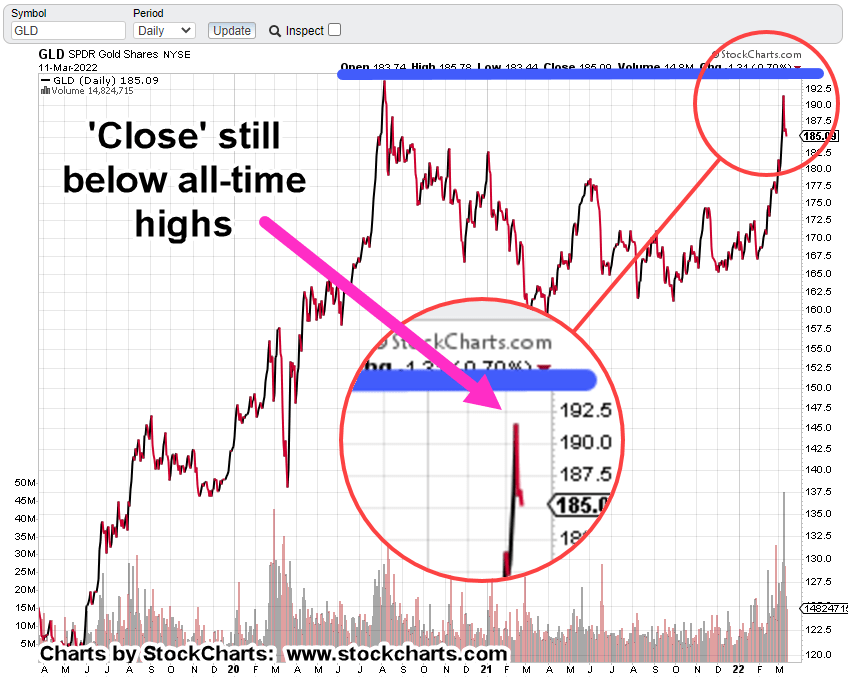
That’s exactly what was done during this (past) session; let’s start first with the big picture.
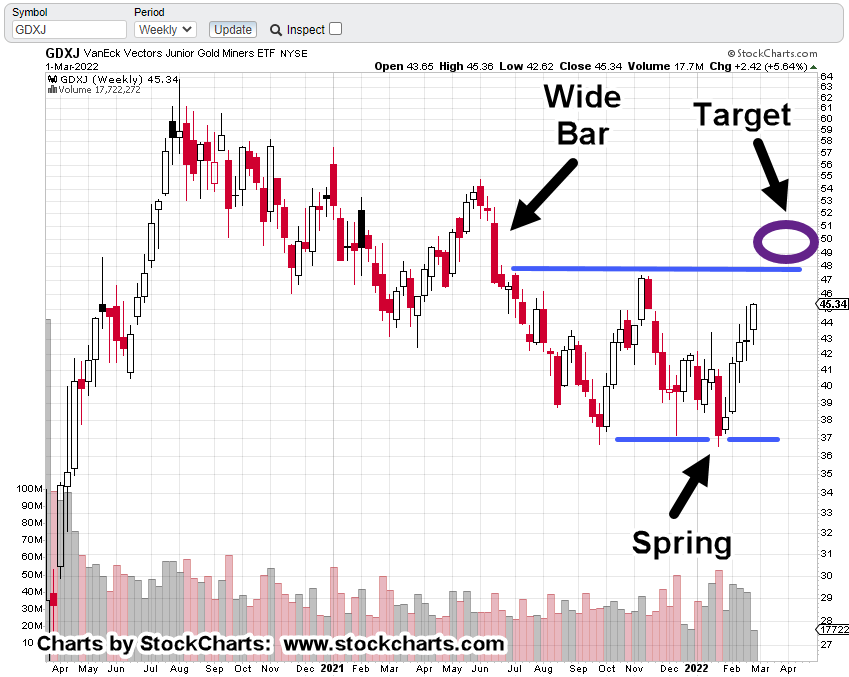
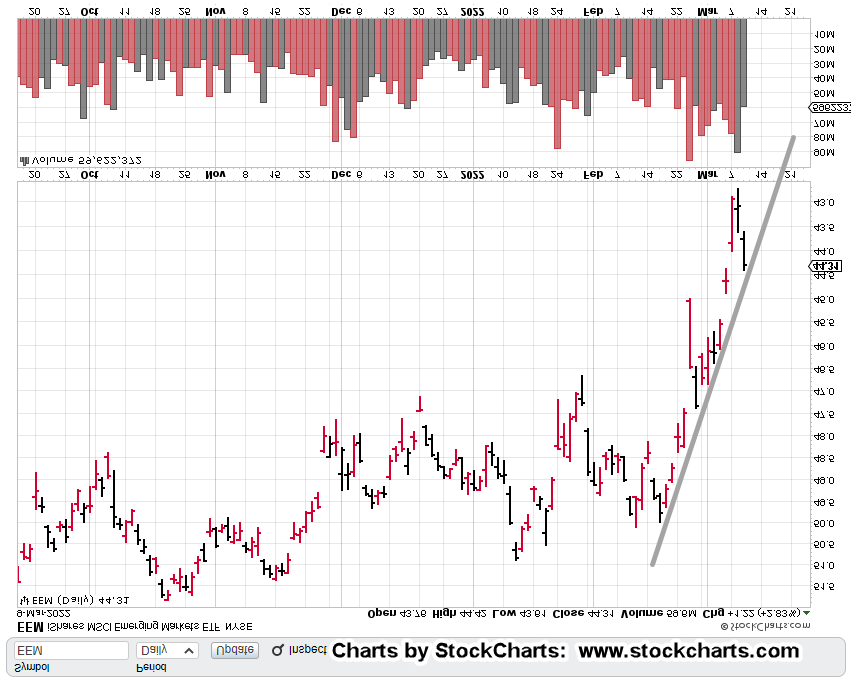
Junior Miners GDXJ, Weekly

As a reminder, and for those who may be new, we’re looking for a particular price pattern that has been shown to repeat over time:
Wyckoff: Spring-to-Up-Thrust
Note in the CAT, example in the link above, price-action up-thrusted and then came right back down to support without any kind of an upward test.
Sometimes, it happens that way.
What’s not known of course, is if GDXJ will respond the same way.
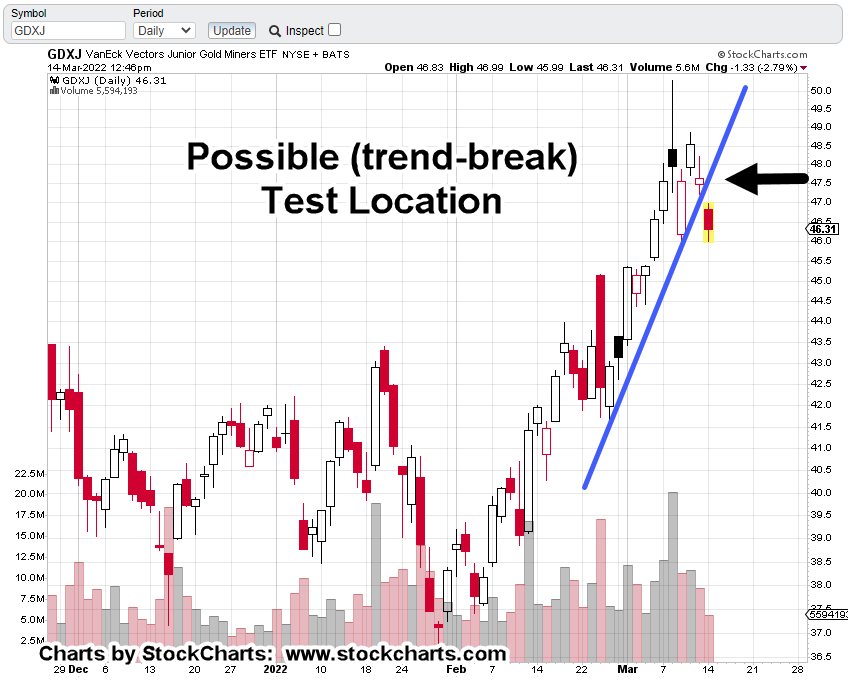
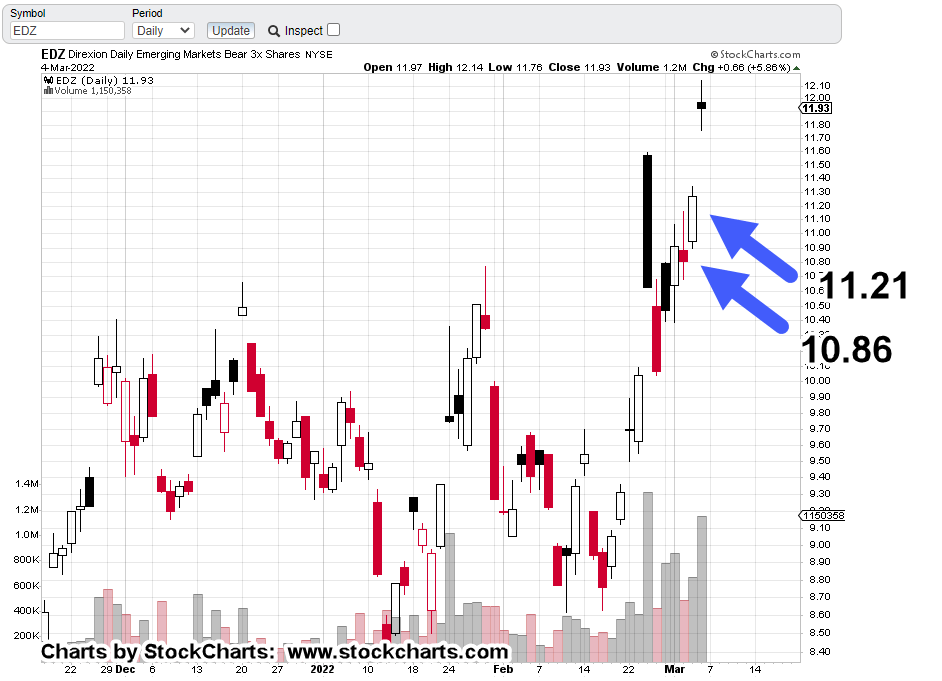
Junior Miners GDXJ, Daily

The chart above is a close-up of the action.
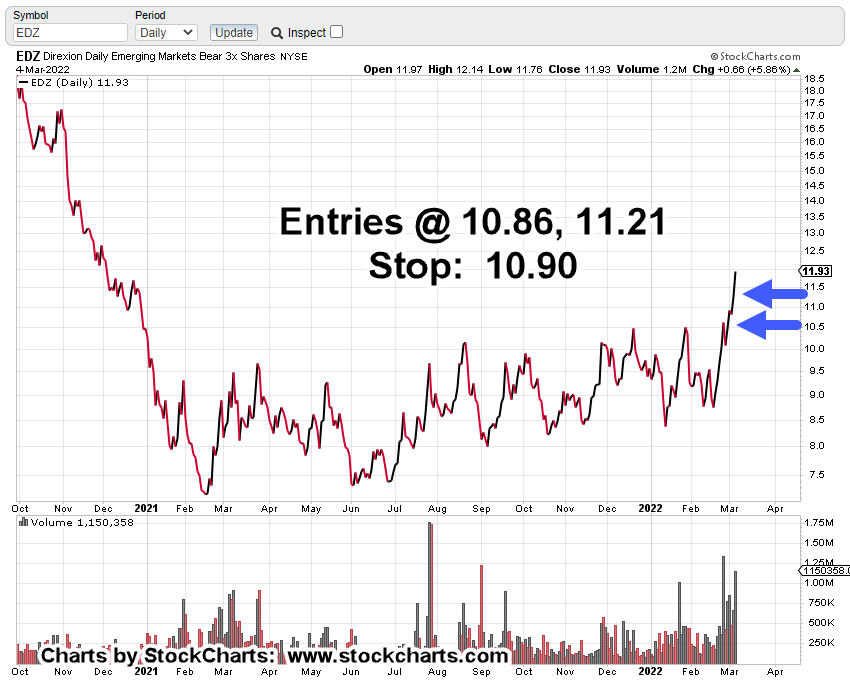
The next chart is leveraged inverse fund JDST. It shows the initial entry of what is labeled trade, JDST-22-02 (not advice, not a recommendation).

Trade entry was just as JDST, price had reached its daily low extreme and was backing off higher (GDXJ, lower); right around 1:14 p.m., EST.
Note the tightness of the stop; just 0.24-points.
Summary
Tomorrow’s action could hit the stop, blow (gap) through the stop or continue upward.
It’s unknown.
What we’ll get for sure, is another data point on what’s really going on with the miners.
Stay Tuned
Charts by StockCharts
Note: Posts on this site are for education purposes only. They provide one firm’s insight on the markets. Not investment advice. See additional disclaimer here.
The Danger Point®, trade mark: No. 6,505,279