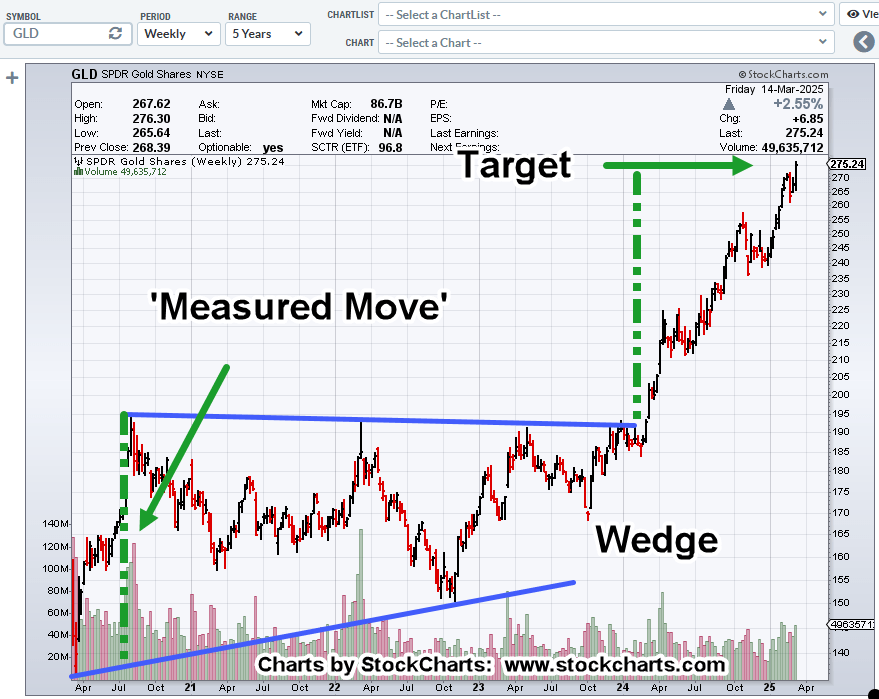
The weekly chart of gold (GLD) shows it has met a wedge breakout target.
The bottom end of the wedge is taken from the march 2020, panic lows, upward to the Sep – Nov 2022, lows.
What’s not shown, taking that trendline farther back in time, also intersects a congestion area from June – August 2019, thus providing additional validity.
Meeting a target does not mean reversal.
However, it does mean, speculators that were positioned long are likely taking profits or cashing out entirely; all the while, the media is ‘raising targets’ on its gold forecasts (not advice, not a recommendation).
Note: Posts on this site are for education purposes only. They provide one firm’s insight on the markets. Not investment advice. See additional disclaimer here.
Note: Posts on this site are for education purposes only. They provide one firm’s insight on the markets. Not investment advice. See additional disclaimer here.
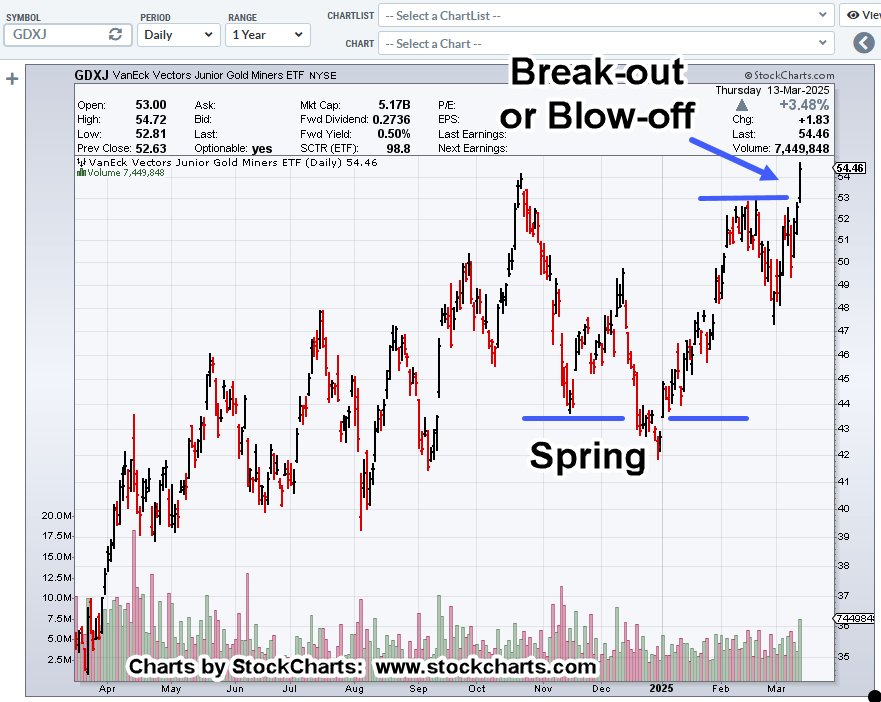
This update on the miners GDXJ, said we’re close to a bearish divergence if the ETF makes a new high.
This update also said to watch for a new daily high, finishing with this:
“Before anyone gets overly bullish, let’s also keep in mind, the high print at the left of the chart in October of last year, is still below the print discussed in this post. over four years ago (not advice, not a recommendation).”
With today’s price action we could be ticks away from that anticipated new daily high (above the 2/20, 52.91).
Junior Miners, GDXJ, Daily
Note the typical (average) 50%, retrace between blue lines, that was then followed by a deeper 61.8% retrace, from blue to magenta lines.
The last deep retrace to 61.8%, tells us supply is building even though price continues higher.
Best case scenario: Next session opens gap-higher, clearing out stops (buy and sell), creating price action instability (not advice, not a recommendation),
Note: Posts on this site are for education purposes only. They provide one firm’s insight on the markets. Not investment advice. See additional disclaimer here.
Today’s action in biotech, best describes why it’s the only active short trade; detailed here (not advice, not a recommendation).
This update gave a hint at the expectation; the ‘spring’ set-up would fail.
It was a little bit early … but here we are.
Today (as of 11:29 a.m., EST), XBI posted a new daily low, threatening to post a new weekly low.
Biotech XBI, Daily
The potential channel includes a blue dashed centerline.
A failed move whether up or down, gets the attention of The Street.
Anything can happen, XBI could recover to the upside.
However, there are three successive trendline hits on the right channel line; probabilities for downside, are higher than for up (not advice, not a recommendation).
Note: Posts on this site are for education purposes only. They provide one firm’s insight on the markets. Not investment advice. See additional disclaimer here.
Out in the mainstream, they tell us the smart money (maybe, even retail) is selling, or selling short, here, here, here, here and here
There’s also recession talk, here; couple that with utter confusion, here.
Then, if we do have a ‘recession’ (or depression) it’s time to blame somebody, right?
As Dr. Elder said years ago (paraphrasing):
‘When there is a change the market, there’s a lot of turbulence before action settles into a definable trend.’
Taking everything in aggregate above, that could be where we are now.
In Style
Some of the links above, are still attempting to make a bullish argument.
For them, it’s not quite time to have a bearish stance. It’s not yet fashionable.
For this site however, every trade (453 of them) for last year, 2024 (ex. UNG), was to the short side (not advice, not a recommendation).
By the time, the bear has fully clawed the market (if or when), it’s most likely too late for any low-risk positioning.
One market that may be acting as a defensive move, are the miners, GDX, GDXJ.
Junior Miners GDXJ, Daily
GDXJ, is either slipping away to the downside or it’s preparing for another attempt at higher prices.
At this point (1:12 p.m., EST), the support/axis line has not been decisively penetrated to the downside, suggesting probabilities are for higher prices (not advice, not a recommendation).
Before anyone gets overly bullish, let’s also keep in mind, the high print at the left of the chart in October of last year, is still below the print discussed in this post. over four years ago (not advice, not a recommendation).
Note: Posts on this site are for education purposes only. They provide one firm’s insight on the markets. Not investment advice. See additional disclaimer here.
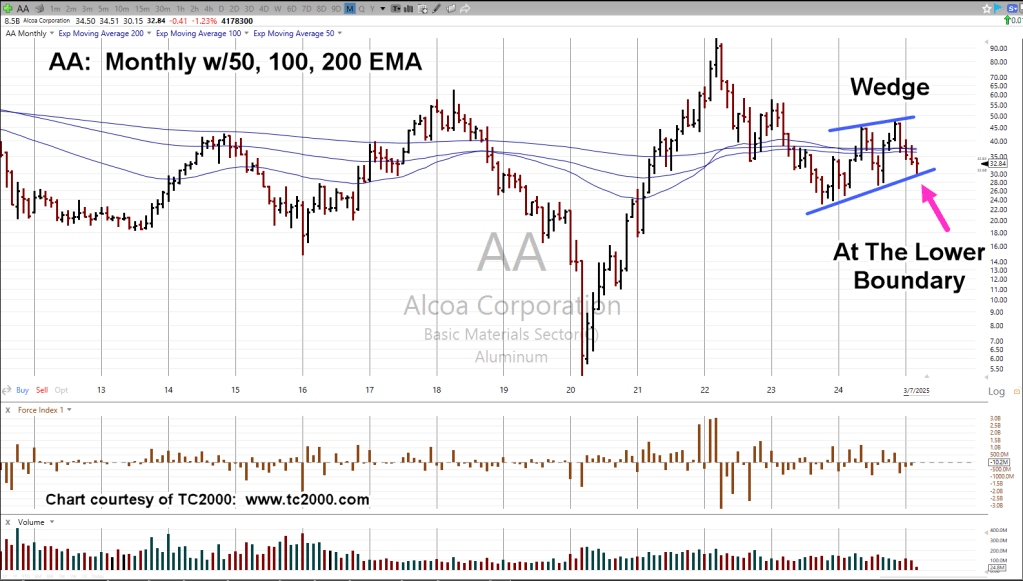
Yesterday, biotech had moving average compression; today, it’s Alcoa.
In this case, we’ll present the monthly chart, showing the long-term picture.
As we’ll see, moving average compression is rare, especially when using the longer time-frames.
In the case of Alcoa (AA), you have to go all the way back to 1978, to find a similar event.
The Big Bubble
Referring to Prechter’s analysis link here, he states that we’re [potentially], in the largest asset bubble since the South Sea, over 300-years ago.
Let’s keep that in mind. Events are happening on such a massive scale; the typical observer may not be aware of the significance and/or the rarity.
Alcoa AA, Monthly
The zoom areas are side-by-side to show the similarity.
Expanding the chart and including the wedge notation, also shows price action at the lower boundary.
It should be noted, AA, is part of the ‘Basic Materials’ sector, with tracking ETF as IYM.
Included in the IYM components, is NEM, and RGLD; this sector is correlated with the miners, GDX, GDXJ.
Positioning
It’s the trader’s discretion as what to do at this point.
This site may or may not execute a direct short of Alcoa, just as it might do with Carvana (CVNA), and maybe others (not advice, not a recommendation).
Note: Posts on this site are for education purposes only. They provide one firm’s insight on the markets. Not investment advice. See additional disclaimer here.
The basic idea around Moving Average ‘Compression’:
The market’s oscillated itself over a period of time, to possible point of inflection.
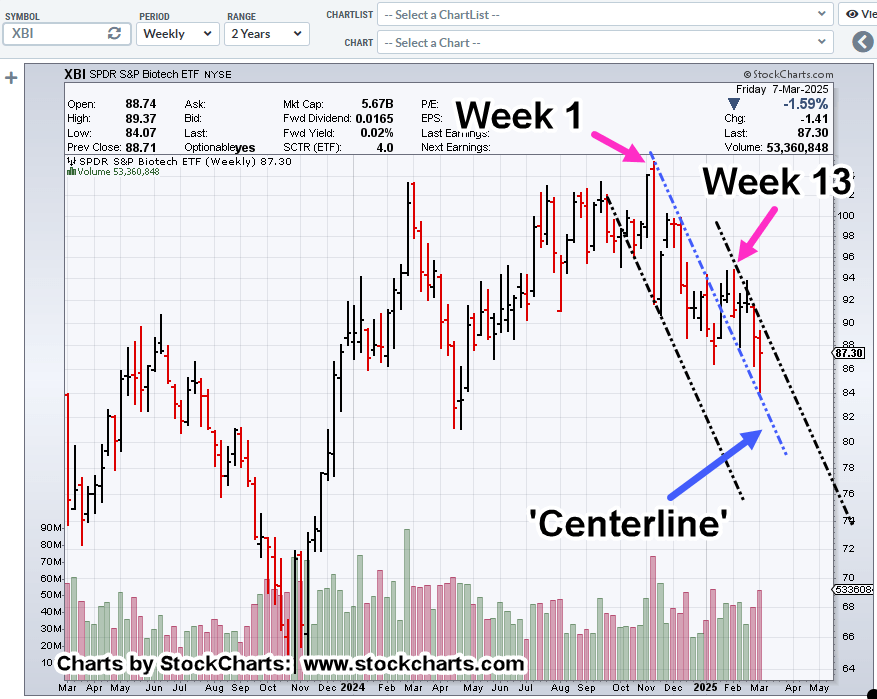
In the example below, with the weekly chart of biotech XBI, this type of compression is rare.
The last time MAs were this compressed (using 50, 100, 200 EMA) was over fifteen years ago, in late 2009.
Biotech XBI, Weekly
Moving in closer, we have an obvious ‘centerline’, and then potential outer channel lines.
Fibonacci time correlations for pivot points, as noted
There’s also resistance around the 88 – 89 range, to be covered in a later update.
Positioning
As stated in the last update, the short position in biotech XBI (via LABD) is the only open position (not advice, not a recommendation).
The major indices were lower over the past week and ‘normal’ action would be some kind of upside to test.
However, as that last post highlighted, there’s (at this point) no ‘Trump Put’; there are no indications the market will be supported as was done with the ‘Fed Put’ after the ’08 – ’09, meltdown (not advice, not a recommendation).
Note: Posts on this site are for education purposes only. They provide one firm’s insight on the markets. Not investment advice. See additional disclaimer here.
The last time we had a sustained multi-year meltdown (’07 – ’08), there was a ‘ban’ on short selling.
Since Trump is ‘strictly business’, will he try (or instruct the SEC) to save the market?
Based on this link, maybe not (not advice, not a recommendation).
If that’s true and there are no ‘saves’ this time around, then we’re in uncharted territory; at least since the ’87 crash.
Gold Miners ‘Bid’?
The rest of the market’s breaking down, but the miners are holding steady (sort-of). They look like there’re headed for at least one more push higher.
Junior Miners GDXJ, Daily
We’re including the MACD, to show if there’s a new high above the 53.00 – level, it sets-up a (potential) bearish MACD divergence.
This coming Tuesday, is Fibonacci Day 8, from the February 28th lows.
Positioning
The short trade JDST-25-04, was stopped out early in the session. No other shorts are planned for this sector … yet (not advice, not a recommendation).
Short trade in biotech XBI, remains active as LABD-25-02, with stop at LABD 7.44 (not advice, not a recommendation).
Note: Posts on this site are for education purposes only. They provide one firm’s insight on the markets. Not investment advice. See additional disclaimer here.
As of this post (12:35 p.m., EST), the miners GDXJ, have pushed above resistance area noted in yesterday’s update
Then, they stalled.
With a backdrop of gold in the news incessantly, is there a short trade at this juncture?
Whether or not this is the place to make the bet remains to be seen. However, what we can see, is a push above resistance (Wyckoff Up-Thrust) and a narrow range bar.
That means short-side risk has been reduced (not advice, not a recommendation).
Positioning
Short initiated via JDST, as JDST-25-03, with stop at the session low, currently JDST 19.93 (not advice, not a recommendation).
Note: Posts on this site are for education purposes only. They provide one firm’s insight on the markets. Not investment advice. See additional disclaimer here.
Note: Posts on this site are for education purposes only. They provide one firm’s insight on the markets. Not investment advice. See additional disclaimer here.