Note: Posts on this site are for education purposes only. They provide one firm’s insight on the markets. Not investment advice. See additional disclaimer here.
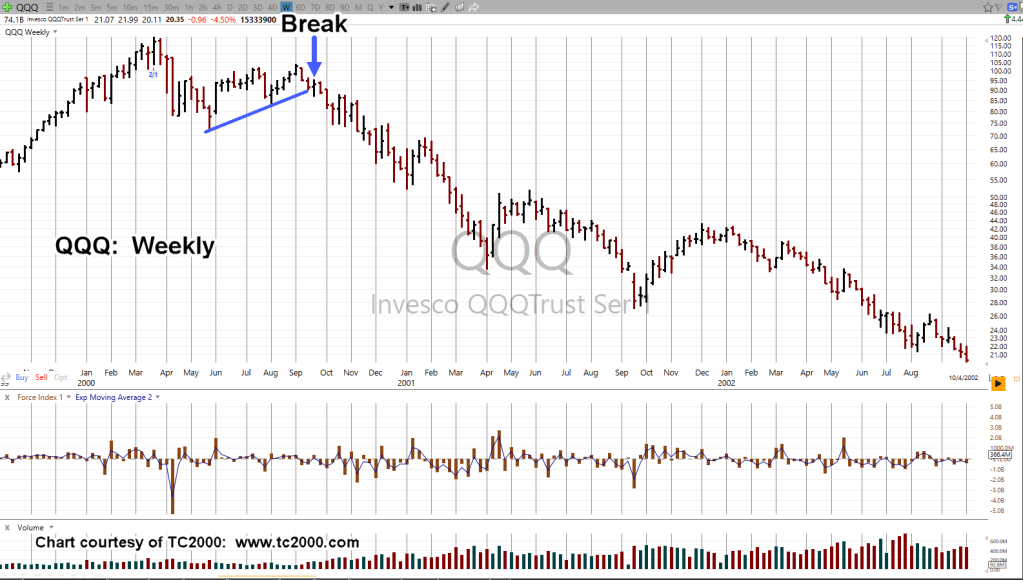
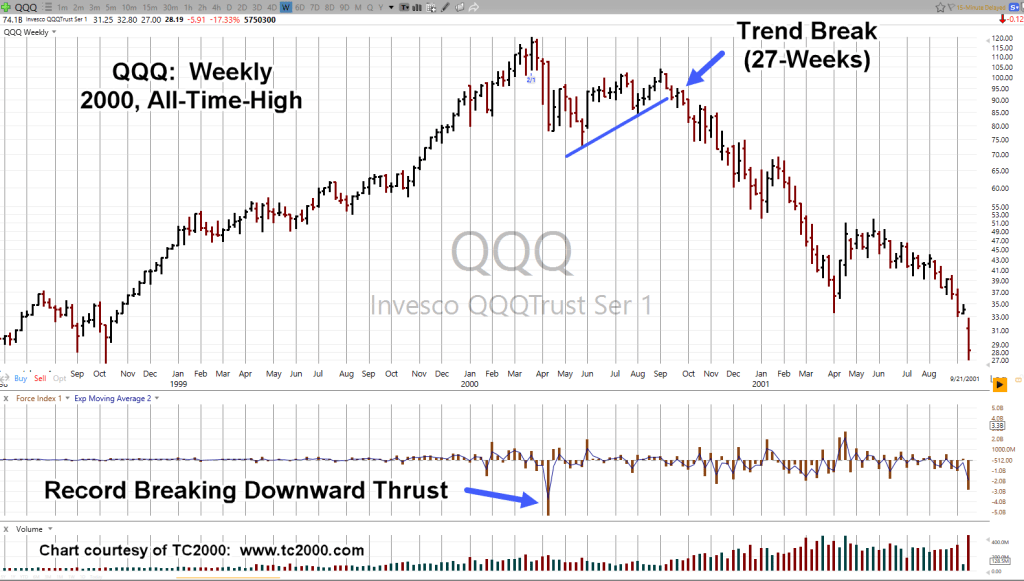
During the internet bubble of the 2000s, after the trend break in the QQQs, price action immediately began its long (multi-year) descent.
Naturally, it would follow when comparing that bubble, with the A.I. bubble, as was done here, one would have thought once the trend is broken, down we go.
Not so, today.
Instead, we have depending on how it’s measured, at least ten-weeks (so far), testing of that break.
Is it all about to change? Are we at ‘tests’ end?
Semiconductors SOXX, Daily Close
The most recent update showing the ‘trend break’ as discussed above, is here.
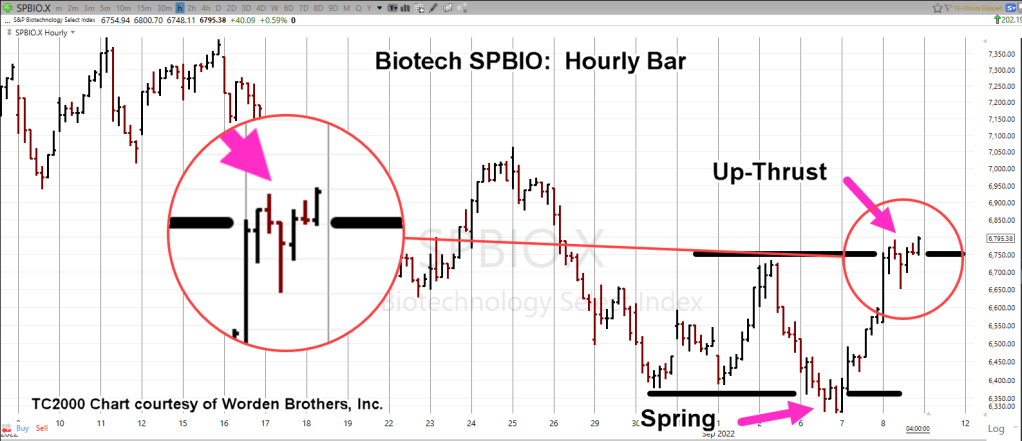
The chart below, presents a possible ‘last gasp’ for the SOXX (not advice, not a recommendation).
From a Wyckoff analysis standpoint, the market ‘by its own action’, has told us the axis line above, is important.
If the chart is correct and we’ve had a false breakout (Wyckoff Up-Thrust), the expectation is for downside follow-through (not advice, not a recommendation).
Note: Posts on this site are for education purposes only. They provide one firm’s insight on the markets. Not investment advice. See additional disclaimer here.
Note: Posts on this site are for education purposes only. They provide one firm’s insight on the markets. Not investment advice. See additional disclaimer here.
After the ‘test’, is that when the plug is pulled?
It’s the market’s job to frustrate (nearly) every single participant, bull or bear, into submission, into giving up and exiting just before the real move gets underway.
How many times have you heard (or experienced) the following:
“The market stopped me out, then took off for a huge gain … without me”.
Experience (i.e. many losses) is the ability to know when the trade (premise) is broken or just going through a test. 🙂
Looking at the SOXX, it’s a compelling (test) picture (not advice, not a recommendation).
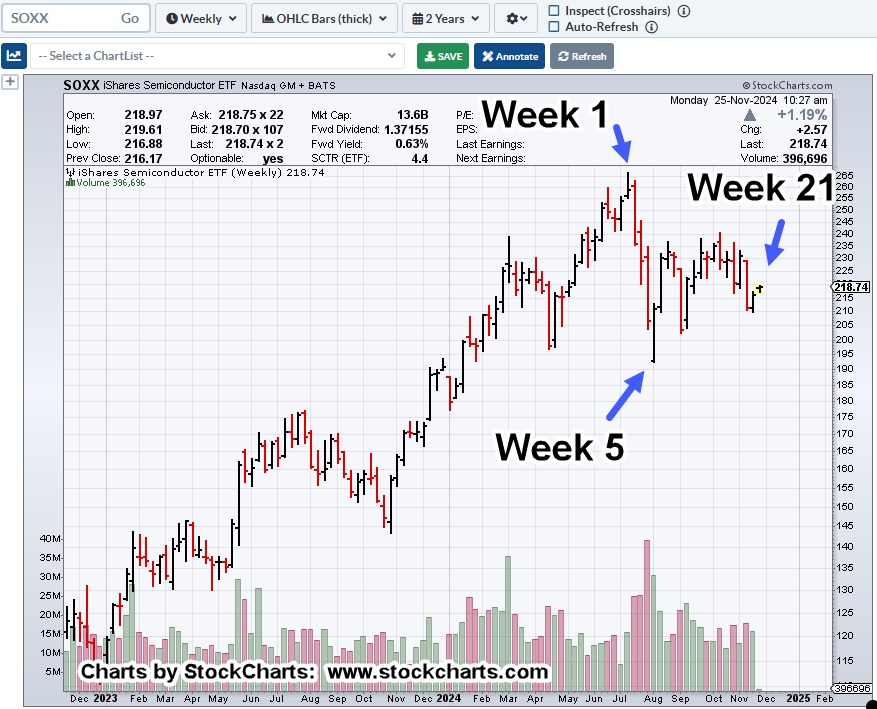
Semiconductors SOXX, Weekly
Prior updates (here and here) have shown the similarities of the A.I. bubble to the dot-com bubble of the 2000s.
One of the events watched for, was the ‘trend break’.
As of today, the market is currently testing that break.
The fact we have a new weekly (retrace) high as well, presents a Fibonacci time correlation.
This week is Fibonacci 21-weeks from the all-time-high in the SOXX.
A downside reversal from this point may indeed tell us, ‘The plug has been pulled’ (not advice, not a recommendation).
Note: Posts on this site are for education purposes only. They provide one firm’s insight on the markets. Not investment advice. See additional disclaimer here.
We’re getting very close to the SOXX, trend break discussed in this update.
If that’s the case and there’s a breakdown, the SOXX, joins the list of past manias and market bubbles (not advice, not a recommendation).
Other markets are hovering near all-time highs, giving the (false) impression, all is well.
Updated In Real-Time
Those monitoring this site have watched in real-time, how this market was selected for (short) positioning and when it was selected.
The only thing not discussed, was the management decision to maintain the position through the ‘election’ blip which at this time, has been fully retraced and more.
It’s a failed (up) move.
Nothing gets the Street’s attention more than a failed breakout or breakdown. The opposing side is trapped (not advice, not a recommendation).
Anything Can Happen
As David Weis used to say, ‘anything can happen’.
There has been no trend break, yet.
As of this post (10:50 a.m., EST), the SOXX, is hovering at support, threatening to break lower.
Note: Posts on this site are for education purposes only. They provide one firm’s insight on the markets. Not investment advice. See additional disclaimer here.
Note: Posts on this site are for education purposes only. They provide one firm’s insight on the markets. Not investment advice. See additional disclaimer here.
Note: Posts on this site are for education purposes only. They provide one firm’s insight on the markets. Not investment advice. See additional disclaimer here.
Having been through the crash of ’87, ’98, ’01, ’08, and now, the feeling is similar.
Each time the vehicle (stock) is different but also the same, at the same time.
In case anyone wants to review, here’s the definition of ‘bag holder‘.
Is Now, The Time?
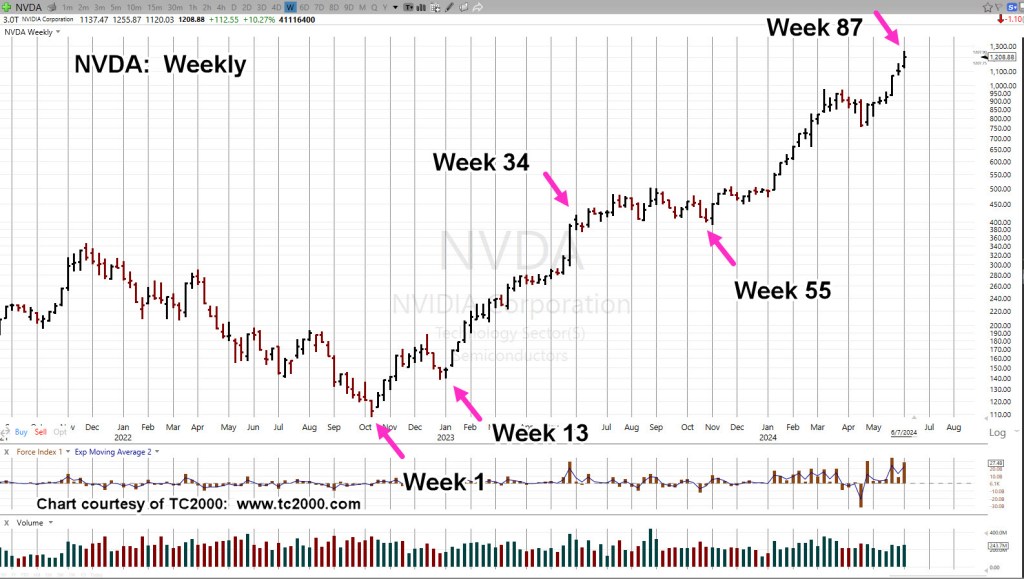
Previous analysis and potential top identification for NVDA, has been premature.
With that in mind, presented below are two charts.
One has the Fibonacci count from the October ’22 lows; the other, shows a trading channel overlay.
The inference is, we’re close to some kind of ‘event’ whether it be sideways congestion or reversal (not advice, not a recommendation).
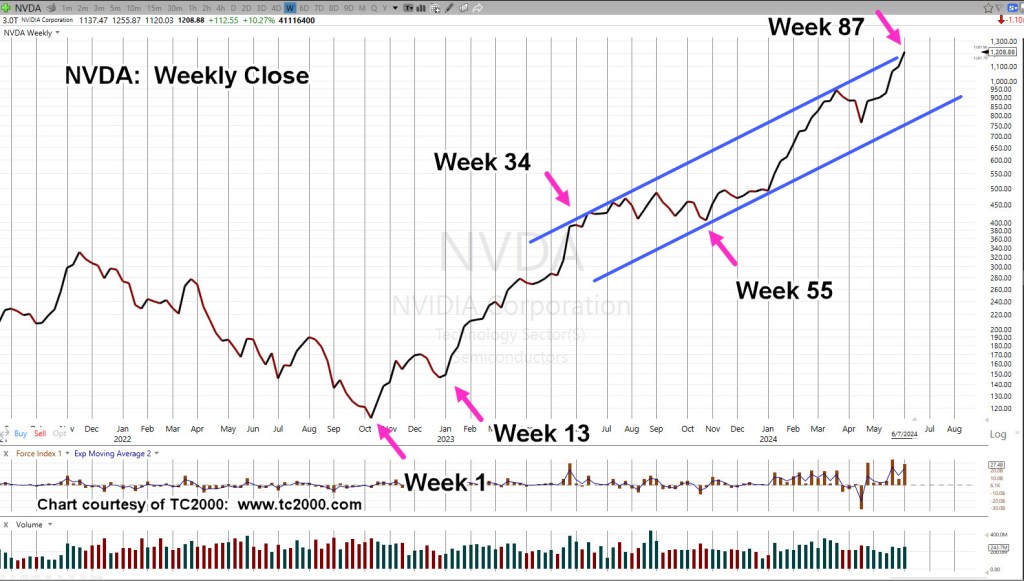
Nvidia NVDA, Weekly
It appears, since the October ’22 lows, NVDA is being influenced by a Fibonacci sequence.
The ”close’ chart has the same Fibonacci count as well as the current trading channel.
Next week is ‘Week 88’, stock-split (10 to 1), as well as the Fed meeting.
Week 88, is within the margin of error for a precise Fibonacci count, Week 89.
With NVDA, at the top of its trading range, one needs to be on the lookout for some type of Fed/Stock-Split ‘overshoot’ or other indicator of potential upside limit (not advice, not a recommendation).
Note: Posts on this site are for education purposes only. They provide one firm’s insight on the markets. Not investment advice. See additional disclaimer here.
Note: Posts on this site are for education purposes only. They provide one firm’s insight on the markets. Not investment advice. See additional disclaimer here.