Another One

Yesterday, biotech had moving average compression; today, it’s Alcoa.
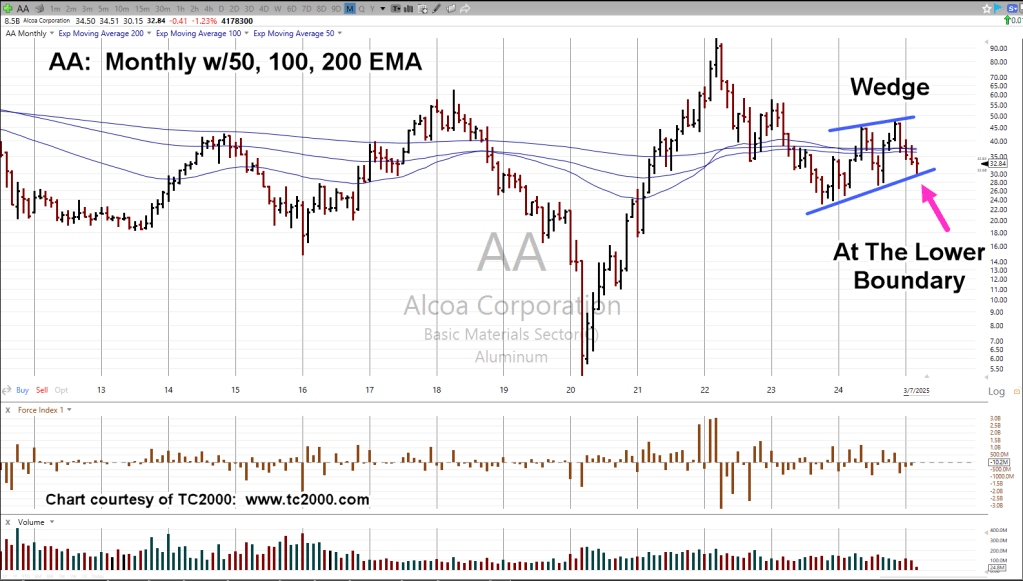
In this case, we’ll present the monthly chart, showing the long-term picture.
As we’ll see, moving average compression is rare, especially when using the longer time-frames.
In the case of Alcoa (AA), you have to go all the way back to 1978, to find a similar event.
The Big Bubble
Referring to Prechter’s analysis link here, he states that we’re [potentially], in the largest asset bubble since the South Sea, over 300-years ago.
Let’s keep that in mind. Events are happening on such a massive scale; the typical observer may not be aware of the significance and/or the rarity.
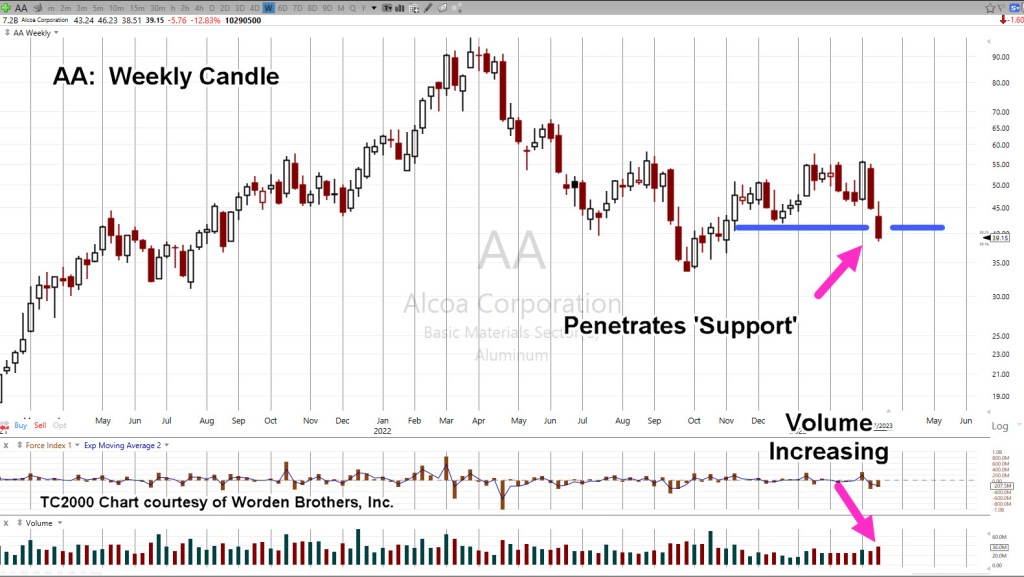
Alcoa AA, Monthly
The zoom areas are side-by-side to show the similarity.

Expanding the chart and including the wedge notation, also shows price action at the lower boundary.
It should be noted, AA, is part of the ‘Basic Materials’ sector, with tracking ETF as IYM.
Included in the IYM components, is NEM, and RGLD; this sector is correlated with the miners, GDX, GDXJ.
Positioning
It’s the trader’s discretion as what to do at this point.
This site may or may not execute a direct short of Alcoa, just as it might do with Carvana (CVNA), and maybe others (not advice, not a recommendation).
Stay Tuned
Charts by StockCharts
Note: Posts on this site are for education purposes only. They provide one firm’s insight on the markets. Not investment advice. See additional disclaimer here.
The Danger Point®, trade mark: No. 6,505,279