Shades of 1987

Wasn’t it August of 1987 when the markets were stretched to extremes?

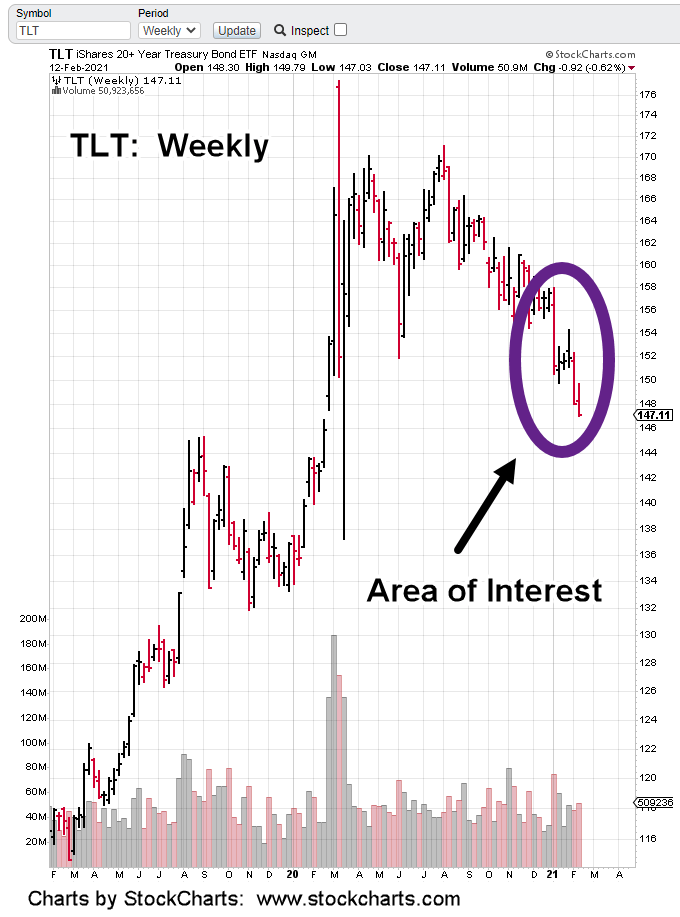
Then bonds headed lower … with rates going higher?

We know what happened after that.

Back then, the market peaked, retraced and then tried to make a new high which failed.

It was the failed move that set things into motion.

Then it was fast and volatile in the days leading up to Monday, October 19th. Markets do not repeat exactly but they do alternate.

So maybe it’s not August now, but February, March or April?

Getting back to October 1987. The late Dr. Martin Zweig discussed the possibility of a Monday crash during Louis Rukeyser’s Wall Street Week: Time Stamp 6:50 – 9:00.

While his assessment was important, perhaps more important was the rosy market forecast by the sell-side (retail) analyst (time stamp 8:37, link above).

That response to Zweig didn’t age well did it?

Three days later at the open, the market vaporized

Is truth more important than fairy tales? This site is about presenting objective analysis along with potential outcomes.

It’s likely we’re an order of magnitude greater than ’87. There’s no argument markets are stretched to obscene levels.

Now, we have interest rates rising sharply.

Will the result be the same? In the markets, anything can happen. However, if enough time has passed to forget (or be ignorant) about the past, it’s possible that it’s time to repeat.

Stay Tuned

Note:  Posts on this site are for education purposes only.  They provide one firm’s insight on the markets.  Not investment advice.  See additional disclaimer here.

Throw-Over, Or Not?

IYR’s in a terminating wedge … will it throw-over, or reverse from here?

American Tower (AMT), the largest cap in the ETF, bounced off a 23.6% projection during last Friday’s session.

That keeps a short term bullish possibility alive. Longer term, AMT still remains in a downward trading channel.

Bonds and the dollar continue at extremes. On the dollar side, it looks like a significant bottom is in the works.

Weekly UUP, MACD has posted a bullish divergence along with an MACD lines cross (to the upside) signal.

Bonds (TLT) remains at its near term lows; near support levels formed back in September, 2019.

IYR is right at the upper wedge boundary and volume (upside pressure) has dropped significantly.

It could still levitate higher … however, it seems that getting a significant ‘throw-over’ is going to require more energy than is currently available.

We’ll see what price action has in store for Tuesday’s session.

Stay Tuned

Charts by StockCharts

Note:  Posts on this site are for education purposes only.  They provide one firm’s insight on the markets.  Not investment advice.  See additional disclaimer here.

Bonds: A Closer Look

The last report on bonds said to expect fireworks soon.

Price action has the final say. It’s saying not yet but close.

The weekly chart of TLT shows the area we’re going to look at a bit closer.

The chart has been expanded below:

In the past six weeks, there have been three decisive down weeks.

The black arrows on those weeks show each successive down week has less net travel.

Last week was the shortest net travel of the three. In addition, that week had higher volume than the week prior.

Less range, more volume.

The late David Weis in his Wykoff analysis video (link here) discussed a similar situation using Apache Oil (APA).

The short version of the story is: Less range, more volume … ‘somebody’s buying’.

Although not really a bond fan, the opportunity is there. Risk has been or is being removed (never entirely) and one way to participate in a reversal and bull move is using leveraged funds (not advice, not a recommendation).

This past Friday, I positioned the firm in TMF, a 3X leveraged bond fund.

Volume (liquidity) is acceptable at around 600,000 – 800,000 shares daily (allowing pre-market entries/exits).

It’s important to note, while TLT was making new daily lows, the high yield HYG, ticked just 0.01-point above its post recovery high. Since August of last year, TLT and HYG have been inversely correlated.

On way to read this, we’re at extremes.

We’re just one ‘incident’ away from sending things violently in the opposite direction; complete with down-gaps, trading halts, brokerage lock-ups … the whole nine yards.

Stay Tuned

Charts by StockCharts

Note:  Posts on this site are for education purposes only.  They provide one firm’s insight on the markets.  Not investment advice.  See additional disclaimer here.

Bond Fireworks, Dead Ahead

With the highest level of short positions in bond history, it’s reversing.

Short sellers have been hypnotized after six months of non-stop downward action … sometimes the reversal begins quietly.

The clues are there. Bullish MACD in both histogram and the lines. The price action trap-gap.

The purple oval has been expanded to the left showing the ‘trap-gap’. This type of action is common during a surprise reversal.

The problem is, it’s all connected. Bonds rising indicate the economy is weak. Actually, the economy is dead (by design).

Just take a look at one of Jeremia Babe’s walk-around updates.

Businesses and malls are ‘decimated’ in his words. Here’s the latest from him … just out.

The TLT and HYG (junk bond) both reached their extremes on the same day but in opposite directions.

TLT reached its low and HYG reached its high.

Now, both those markets have reversed. The latest CPI numbers were a surprise. It highlighted that hyperinflation is not there.

That article also pointed out, rent inflation (i.e. commercial real estate) is decreasing.

One last thing. The broker used by the firm has posted a message each day upon logging onto the trade platform. That message is to the effect:

‘As a result of increased market activity, we’re experiencing especially high call volume and hold times’

This message is being posted when the market is going up!

Are any of the major brokers going to effectively handle the herd of retail calling in a panic, trying get out of a downside trading halt?

Stay Tuned

Charts by StockCharts

Note:  Posts on this site are for education purposes only.  They provide one firm’s insight on the markets.  Not investment advice.  See additional disclaimer here.

Bonds: Measured Move, Met

From the wedge breakout to the downside, Friday’s action in TLT has met the measured move.

Price action finished at the low of the day (+0.01) and is posting a bullish MACD divergence.

On the other end of the spectrum, the S&P 500 finished at all time highs.

Intuitively, we can see how this is setting up.

Each market is at an extreme. That includes real estate, IYR at its own 76.4%, retrace … although severely lagging the S&P.

Unfortunately at such junctures, we can expect some type of ‘incident’ to set things off in the opposite direction.

It may not happen but if it does, the markets define the news; not the other way around.

Stay Tuned

Charts by StockCharts

Note:  Posts on this site are for education purposes only.  They provide one firm’s insight on the markets.  Not investment advice.  See additional disclaimer here.

Bear Flag … Bear Market

Bear flags post in a bear market

Bull flags post in a bull market

Right?

One would think.

It’s different though, if you’re a rabid ‘not-right-in-the-head’ gold bull.

The professional does not care which direction the market is heading. The only important thing is, and to paraphrase Livermore:

‘There’s only one side of the market to be on … and that’s the right side.’

GDX has posted and tested a bear flag.

At this juncture, it’s heading lower … possibly to test between 15 – 17, as was just mentioned yesterday, by Van Metre (time stamp 10:00).

Conversely, in the general equity markets, there’s reversal action with the S&P, Dow, Russell, all lower.

On top of that, bonds are in their own reversal (up again in the pre-market) as well as the dollar.

In the Van Metre link above, in addition to comments on gold, he also sates ‘the market is not prepared for a bond (and dollar) reversal.

When markets are sure of one thing and the other happens, it’s very ugly.

Charts by StockCharts

Note:  Posts on this site are for education purposes only.  They provide one firm’s insight on the markets.  Not investment advice.  See additional disclaimer here.

Removing The Risk: Oil & Gas

The dollar and bonds have reversed.

Yesterday, oil futures posted a downward reversal bar. This morning’s (pre-market) session is lower again by about 1.00%.

Longer term perspective (above), Oil & Gas Sector, XOP is at resistance.

Shorter term, the daily (below) posted a measured move off the wedge formation.

There’s not ever ‘no risk’ in the markets … but there is ‘low risk’.

That’s where we are now with XOP. Risk is low the up-trend will continue unabated.

To get past long-term resistance, (if it’s going to do so), XOP may have to come back and retrace for fuel.

With unemployment claims just out at 965,000 does anyone really think the economy’s going to bounce back?

Back in the day during a real (not contrived) recession, it was bad when unemployment claims hit around 385,000. Those were the days.

One of the Inverse funds for XOP that’s fairly liquid (not advice, not a recommendation) is DUG.

Stay Tuned

Charts by StockCharts

Note:  Posts on this site are for education purposes only.  They provide one firm’s insight on the markets.  Not investment advice.  See additional disclaimer here.

Good Short, Bad Short

Seems like Tesla (TSLA) is always in the news.

Now, we have ‘the big short’, as reported by The Money GPS, doubling down on a possible even bigger short.

Is TSLA a good short opportunity or just a high visibility gamble; or maybe at this point in our history, just another psy-op?

How many minions are flagellating themselves over TSLA, anyway?

From a trading standpoint, TLSA could reverse from here. It could also gap higher into a wedge throw-over. With the weekly MACD showing no signs of erosion, probabilities are about equal.

Bad Short

Now, let’s look at another chart:

Real estate, IYR is showing classic signs it’s about ready to roll over.

Its been struggling for months at the 85-86 area and just yesterday, posted a new weekly low.

Yesterday as well, bonds reversed to the upside. Pre-market activity points to a higher open … solidifying the reversal.

On top of that, the dollar shows a higher open having (downward) tested its up-trend at the last session.

The list can go on but we see the difference.

One is a gamble (or even a psy-op manipulation of followers) and the other is a trade with high probabilities.

Good Short

The table below has current positioning (not advice, not a recommendation):

Special Update: 9:52 a.m. EST. Price action in DRV pushed to stop level and has recovered quickly.

Position is being maintained (for now) with analysis to follow.

Update: 2:21 p.m. EST. IYR looks to be headed to a 38% retrace at approx 84.25, level. All DRV positions exited. Will look to re-enter shorts at higher level, price action depending.

Charts by StockCharts

Note:  Posts on this site are for education purposes only.  They provide one firm’s insight on the markets.  Not investment advice.  See additional disclaimer here.

Ruh, Roh: Bond Reversal

Now, it gets interesting.

Bonds sold short the most in history.

Then, today’s action is reversal with moderate volume.

On the dollar side, at first glance it looks like a terrible day.

Action was down 0.53%.

The reality is, UUP came down to test an up-trend line formed as part of its own reversal last Thursday.

Both dollar and bonds are in an upside reversal; the dollar looks slightly ahead by a few days.

Real estate (IYR) has rallied (sort-of) which may only be temporary; likely on the (false) belief lower bond yields are good for higher yielding sectors.

Not true when we still have (as Van Metre puts it), the ‘insolvency event’ yet to come; everyone going bankrupt all at the same time.

Anything can happen and the above analysis could fall apart tomorrow.

On the probability side, looks like we’ve seen the extremes in the major sectors; now ready for reversal pivots.

Note:  Posts on this site are for education purposes only.  They provide one firm’s insight on the markets.  Not investment advice.  See additional disclaimer here.

Gold Down. Why?

We have the usual suspects rolled out; providing expert analysis on why gold went down.

The answer is quite simple. It tested a trend break, then reversed.

If we look at the (close) chart of GLD, it broke an uptrend during the week of November 20th, last year; went lower and then back to test.

That test was rejected dramatically with Gold (GLD), heading significantly lower; getting whacked down over 5%, in just two days.

This is not bull market behavior.

Steven Van Metre’s assessment (at this juncture) that we’re in a deflation event is being shown correct. The lagging factor in the scenario is the overall market … still near all-time highs.

It’s true bonds broke lower (rates up) this week but that’s another event answered by technicals; the wedge formation, discussed here.

Both bonds and the dollar have set the stage for a swift reversal.

Just how that’ll affect an extended, obscenely overvalued, stretched, call options wild market with everybody all-in, is not known.

Getting back to Van Metre; he’s reported, during this past week, small traders/speculators added to short (bond) futures positions.

If there’s a signal bonds are stretched, ready to reverse, it’s the little-guy just now getting in (going short) …. right at the bottom; as usual.

Charts by StockCharts

Note:  Posts on this site are for education purposes only.  They provide one firm’s insight on the markets.  Not investment advice.  See additional disclaimer here.