Note: Posts on this site are for education purposes only. They provide one firm’s insight on the markets. Not investment advice. See additional disclaimer here.
Now, we have ‘the big short’, as reported by The Money GPS, doubling down on a possible even bigger short.
Is TSLA a good short opportunity or just a high visibility gamble; or maybe at this point in our history, just another psy-op?
How many minions are flagellating themselves over TSLA, anyway?
From a trading standpoint, TLSA could reverse from here. It could also gap higher into a wedge throw-over. With the weekly MACD showing no signs of erosion, probabilities are about equal.
Bad Short
Now, let’s look at another chart:
Real estate, IYR is showing classic signs it’s about ready to roll over.
Its been struggling for months at the 85-86 area and just yesterday, posted a new weekly low.
Yesterday as well, bonds reversed to the upside. Pre-market activity points to a higher open … solidifying the reversal.
On top of that, the dollar shows a higher open having (downward) tested its up-trend at the last session.
The list can go on but we see the difference.
One is a gamble (or even a psy-op manipulation of followers) and the other is a trade with high probabilities.
Good Short
The table below has current positioning (not advice, not a recommendation):
Special Update: 9:52 a.m. EST. Price action in DRV pushed to stop level and has recovered quickly.
Position is being maintained (for now) with analysis to follow.
Update: 2:21 p.m. EST. IYR looks to be headed to a 38% retrace at approx 84.25, level. All DRV positions exited. Will look to re-enter shorts at higher level, price action depending.
Note: Posts on this site are for education purposes only. They provide one firm’s insight on the markets. Not investment advice. See additional disclaimer here.
Then, today’s action is reversal with moderate volume.
On the dollar side, at first glance it looks like a terrible day.
Action was down 0.53%.
The reality is, UUP came down to test an up-trend line formed as part of its own reversal last Thursday.
Both dollar and bonds are in an upside reversal; the dollar looks slightly ahead by a few days.
Real estate (IYR) has rallied (sort-of) which may only be temporary; likely on the (false) belief lower bond yields are good for higher yielding sectors.
Not true when we still have (as Van Metre puts it), the ‘insolvency event’ yet to come; everyone going bankrupt all at the same time.
Anything can happen and the above analysis could fall apart tomorrow.
On the probability side, looks like we’ve seen the extremes in the major sectors; now ready for reversal pivots.
Note: Posts on this site are for education purposes only. They provide one firm’s insight on the markets. Not investment advice. See additional disclaimer here.
We have the usual suspects rolled out; providing expert analysis on why gold went down.
The answer is quite simple. It tested a trend break, then reversed.
If we look at the (close) chart of GLD, it broke an uptrend during the week of November 20th, last year; went lower and then back to test.
That test was rejected dramatically with Gold (GLD), heading significantly lower; getting whacked down over 5%, in just two days.
This is not bull market behavior.
Steven Van Metre’s assessment (at this juncture) that we’re in a deflation event is being shown correct. The lagging factor in the scenario is the overall market … still near all-time highs.
It’s true bonds broke lower (rates up) this week but that’s another event answered by technicals; the wedge formation, discussed here.
Both bonds and the dollar have set the stage for a swift reversal.
Just how that’ll affect an extended, obscenely overvalued, stretched, call options wild market with everybody all-in, is not known.
Getting back to Van Metre; he’s reported, during this past week, small traders/speculators added to short (bond) futures positions.
If there’s a signal bonds are stretched, ready to reverse, it’s the little-guy just now getting in (going short) …. right at the bottom; as usual.
Note: Posts on this site are for education purposes only. They provide one firm’s insight on the markets. Not investment advice. See additional disclaimer here.
Note: Posts on this site are for education purposes only. They provide one firm’s insight on the markets. Not investment advice. See additional disclaimer here.
Note: Posts on this site are for education purposes only. They provide one firm’s insight on the markets. Not investment advice. See additional disclaimer here.
Ever since the inland hurricane, the ‘Derecho’ of August 10th, it’s never been the same for corn.
Now, it’s going vertical.
The entire U.S. agricultural food supply infrastructure is being systematically dismantled. Control the food, control the population. Simple.
It seems the ‘preppers’ tend to focus on stockpiling silver and gold.
If your’re getting ready for what’s coming, from a historical perspective, that’s not the place to start.
Going way back …. thousands of years, during the famine in Egypt of Joseph’s time, we have this:
“And Joseph gathered corn as the sand of the sea, very much, until he left numbering; for it was without number”
“And the famine was over all the face of the Earth: and Joseph opened all the storehouses and sold unto the Egyptians: and the famine waxed sore in the land of Egypt.”
“And all countries came unto Joseph for to buy corn; because that the famine was so sore in all lands.”
Gen 41: Vs. 49, 56, 57, KJV
They paid for the corn first, with gold and silver. Then they paid with their livestock. Then they paid by selling themselves into life-long slavery. We can equate that last part (slavery) as getting the vax.
As corn is going vertical, the bond market is signaling its move as well.
Just now, today, TLT is rotating higher.
Yesterday, Steven Van Metre showed a chart (time stamp 10:00) of the speculators beginning to back off their historic short position.
They’ve figured out they’re trapped. Now, they’re trying to sneak out the door without being completely impaled on a sharp bond spike.
The S&P, Dow, NASDAQ, Russell 2000, all appear to be holding near their highs.
Note: Posts on this site are for education purposes only. They provide one firm’s insight on the markets. Not investment advice. See additional disclaimer here.
“The “Christmas Bomb” cut communication lines … which by the way is the very first objective during any battle; cut the enemy’s communications.
Matter of fact; that could be the ‘reason’. A test to see how badly communications were disrupted; how quickly they recovered.“
At time stamp 2:00 in this link, Salty Cracker shows the AT&T outage map; nearly half of the U.S. has been affected.
Next week, the markets could rally on such news. Anything can happen.
However, lack of communication means lack of commerce … for an unknown amount of time.
Downside action would seem more probable.
There’s still one more day before the open on Monday … seems like a long way away.
It’s possible by that time, participants will want the safety of bonds.
Bonds that are already sold-short, the most in history.
Stay Tuned
Note: Posts on this site are for education purposes only. They provide one firm’s insight on the markets. Not investment advice. See additional disclaimer here.
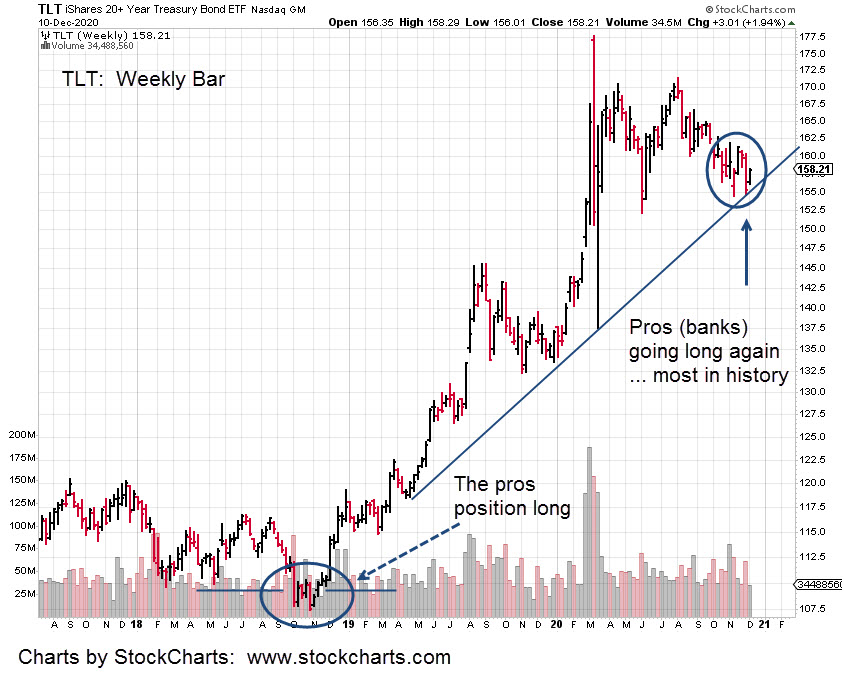
One recent example; the bond move from late 2018, to early 2020.
During the low from October 2018 to November that year, were reports of professionals opening huge long positions.
At the time and as the weeks went by, it appeared that nothing was happening.
The delay would have caused the typical i-phone addicted ‘tweeter’ to lose interest many times over.
When it finally took off, bonds staged a huge directional move that lasted over a year.
Such moves are rare and require the ability to wait. Wait to get in and wait for the move; minimize transactions.
Each market transaction is an opportunity for error. Minimize the transactions and by definition, the errors are minimized as well.
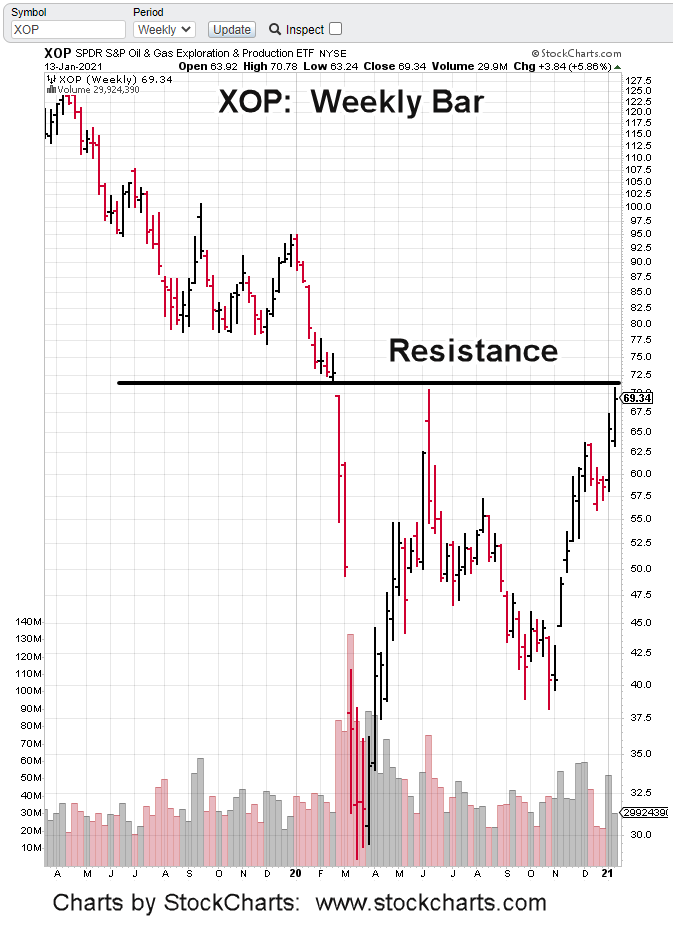
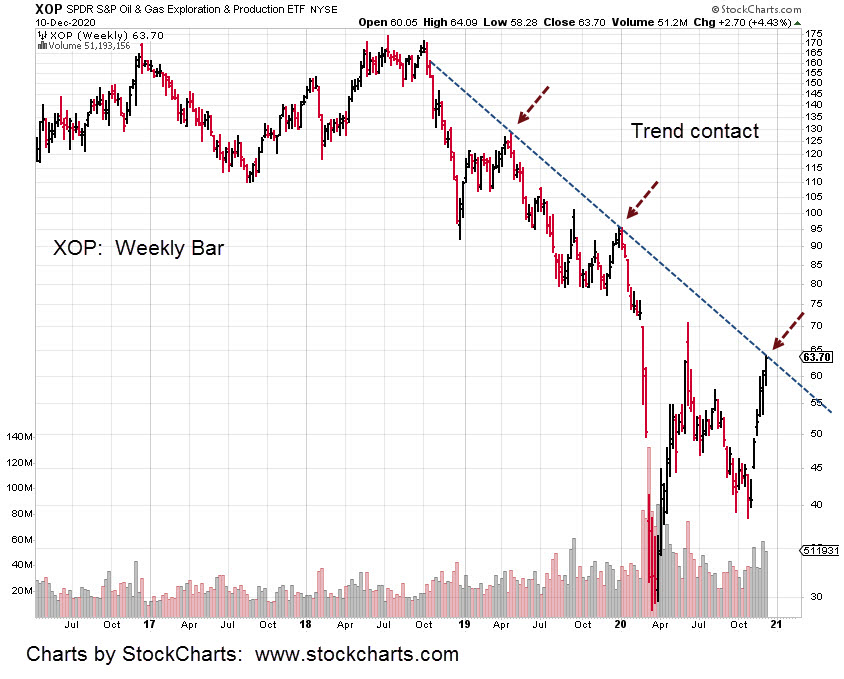
That brings us to oil and more specifically, XOP and DUG.
The nonsense being promulgated by the financial press is that oil is moving higher on ‘hopes’ for an economic recovery.
Maybe injecting the world-wide population with potentially DNA altering technology (not even tested on animals first) for an ailment that does not exist will miraculously launch some kind of pent up consumer demand.
No matter. Oil and its attendants keep moving higher with the dollar moving lower.
Even with anecdotal evidence from an Oklahoma oil field worker (commenting on a Van Metre update) that was later confirmed by the EIA report did not cause oil to move lower … yet.
That is, until today.
The dollar attempted to continue its downtrend yesterday. Oil spiked as did XOP to the upside and DUG to the downside.
This morning is a different story. Dollar proxy, UUP is trading (pre-market) right at its highs of the last session in an apparent reversal.
Oil along with XOP is down, with DUG up.
Looking at XOP, we see it’s hitting a long-established trend line.
With the dollar, bond, and overall market extremes, no recovery in sight and more probable, another (and complete) collapse; this may be the spot (not advice, not a recommendation) to position for medium to long term on the short side.
That’s exactly what the firm has done. Looks like our position was a day too early as we sat through yesterday’ spike lower in DUG.
Volume remained heavy for that DUG session. Weekly volume is looking to be the largest (big-money moving in) since at least 2015.
Note: Posts on this site are for education purposes only. They provide one firm’s insight on the markets. Not investment advice. See additional disclaimer here.
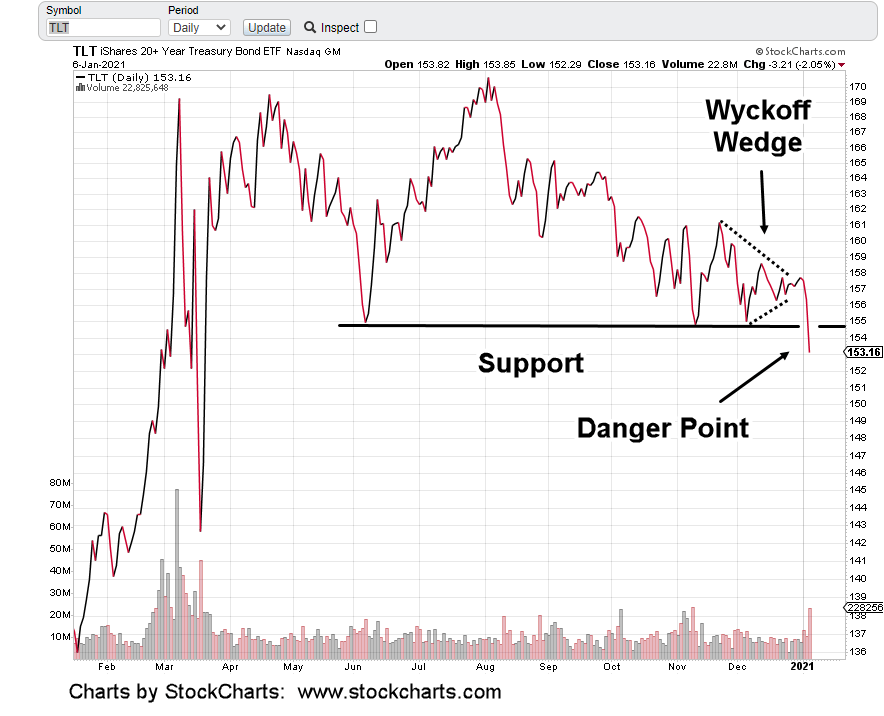
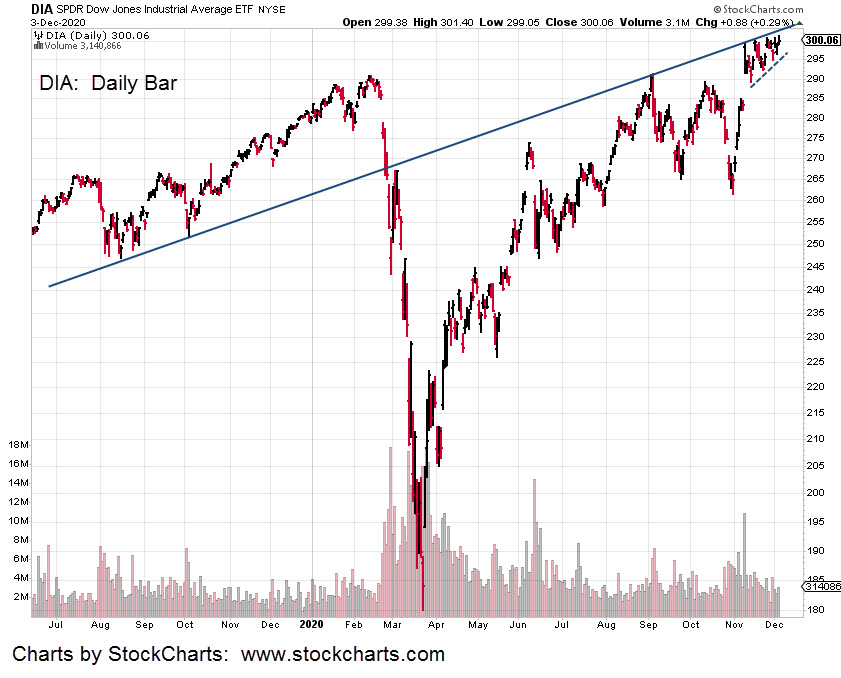
In the pre-market (8:52 a.m. EST) action continues to grind higher. Both the Dow and S&P have posted new highs thus negating the Holiday Turns scenario … but not by much.
Important to note is each market continues to post on the underside of a long-term trend-line. The Dow chart (DIA) is farther down this post.
Also added to the chart is the dashed trend-line underneath the recent price action. A wedge is being formed; typically last stop before reversal.
In other markets, looks like Biotech may continue higher but along with the others, action appears labored.
The short position could be stopped out at the open.
This area of price action is where cost of being wrong is least. We’re at The Danger Point.
Update: 9:04 a.m. EST: Both AMGN and MRNA have now posted lower in pre-market.
Stopped out does not mean there’s no opportunity. The bearish MACD divergence is still there.
If IBB continues higher, the original ‘150’ target is back in play.
The market extremes are still there: Bonds and the Dollar are short the most in history. Stretched all around.
It’s not unreasonable to expect several attempts to position short.
Note: Posts on this site are for education purposes only. They provide one firm’s insight on the markets. Not investment advice. See additional disclaimer here.