9:45 a.m, EST
Price action itself defines the trend
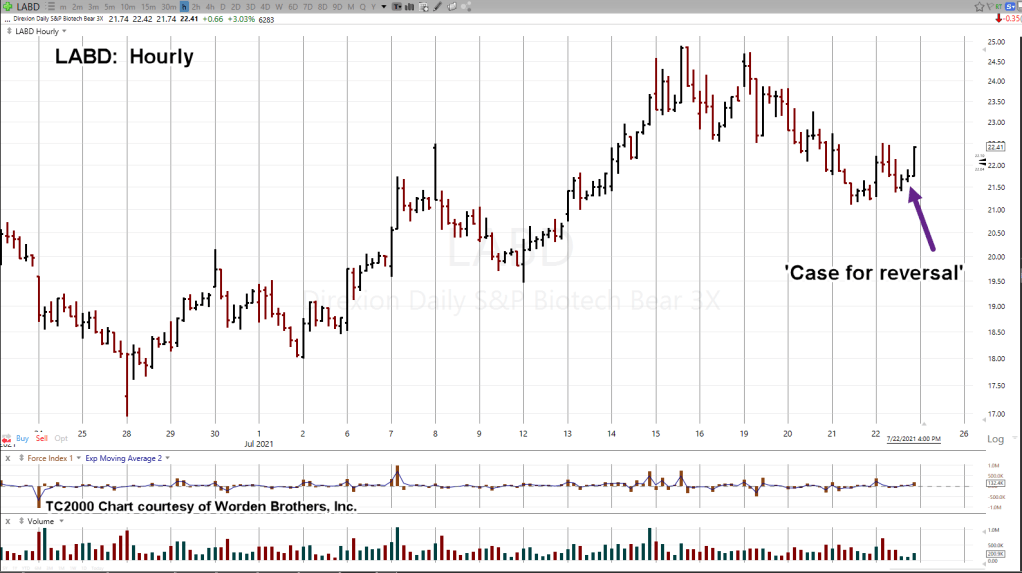
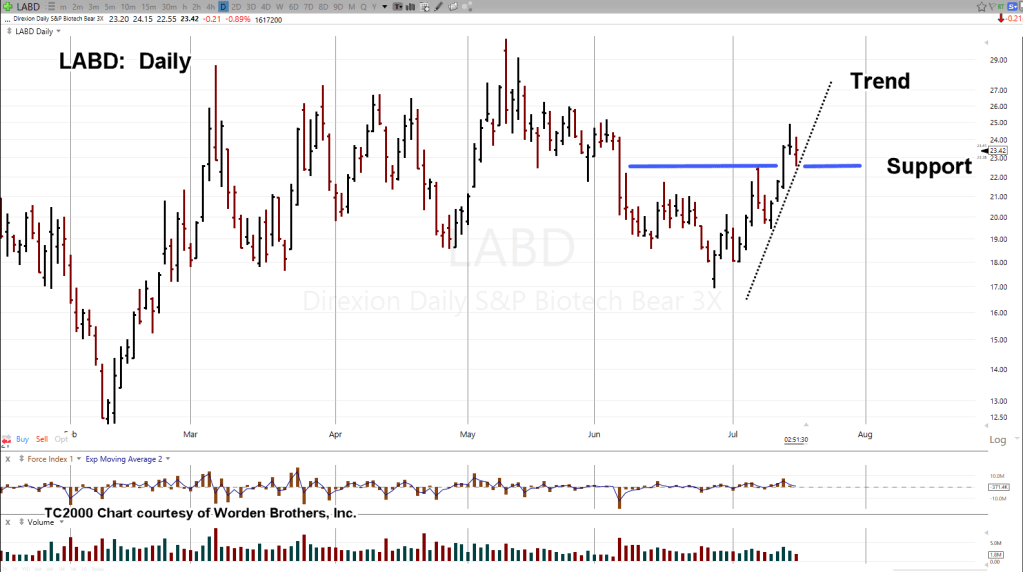
The unmarked hourly chart (above) of inverse fund LABD, shows the location of the last update.
That update called for LABD to reverse higher; based on thrust action of the market itself.
Soon after (magenta arrow), LABD pivoted higher.
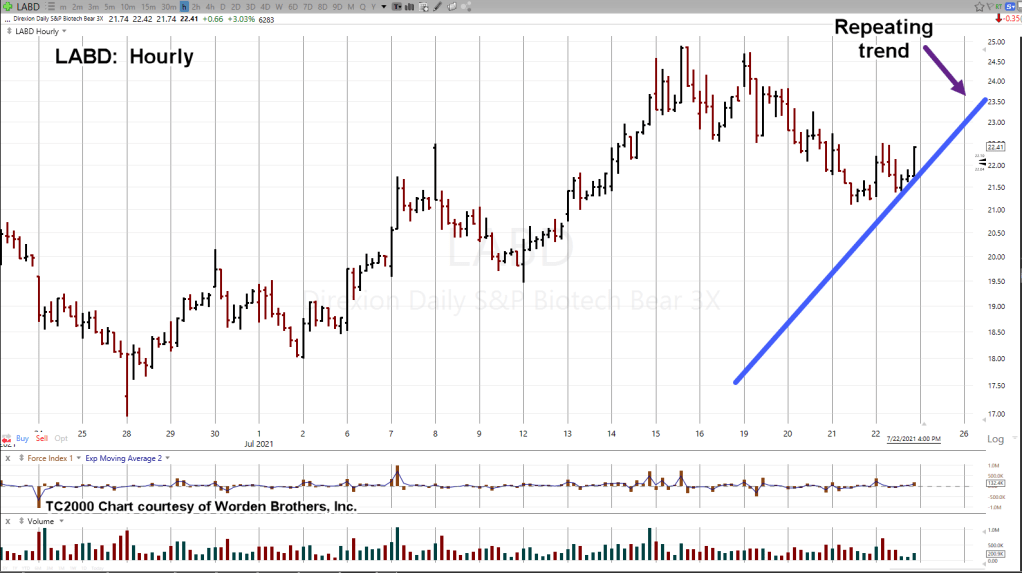
The right side action has a familiar repeating trend:
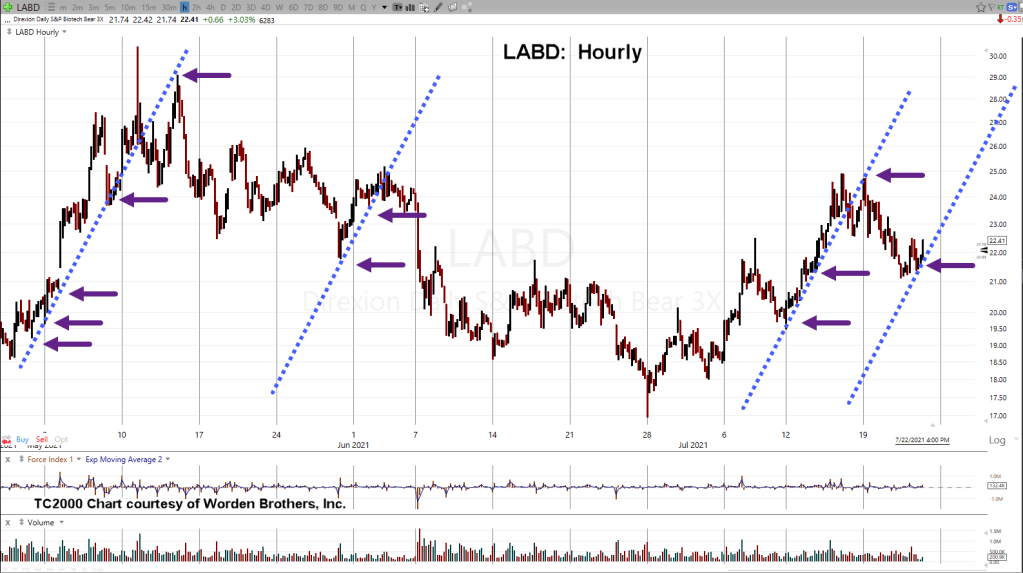
The chart below is a compressed version.
The repeating lines have been added. Arrows show contact points:
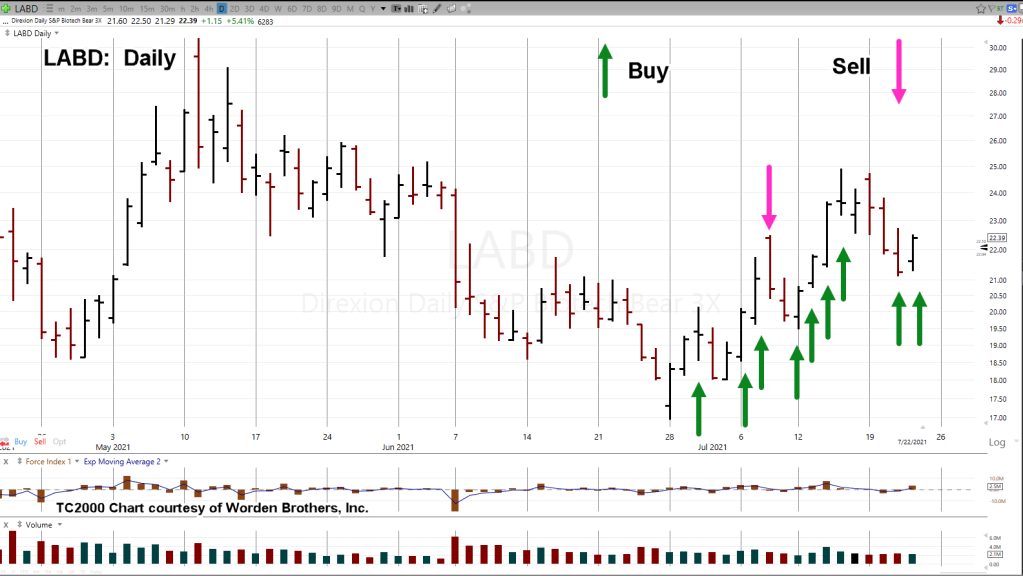
Strictly as a courtesy, daily chart of LABD is below with notations of buy and sell (not advice, not a recommendation) for my firm’s main account.
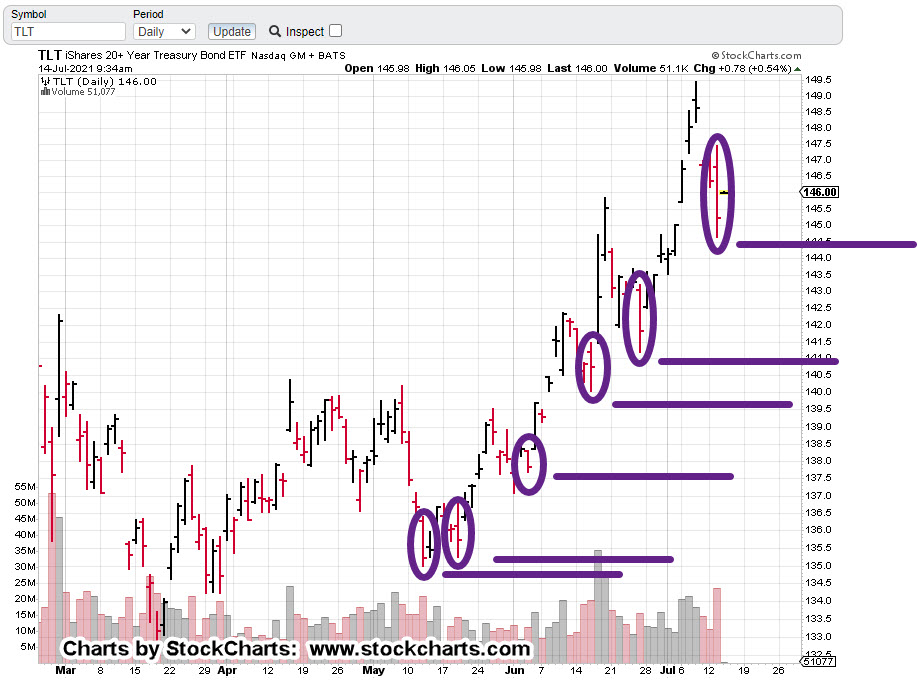
A good many that monitor this site have probably become bored with biotech … just as they did with Steven Van Metre’s analysis of bonds (back at the lows).
Van Metre is providing an excellent service. True, he probably has people moving their accounts to him. He’s running a business after all.
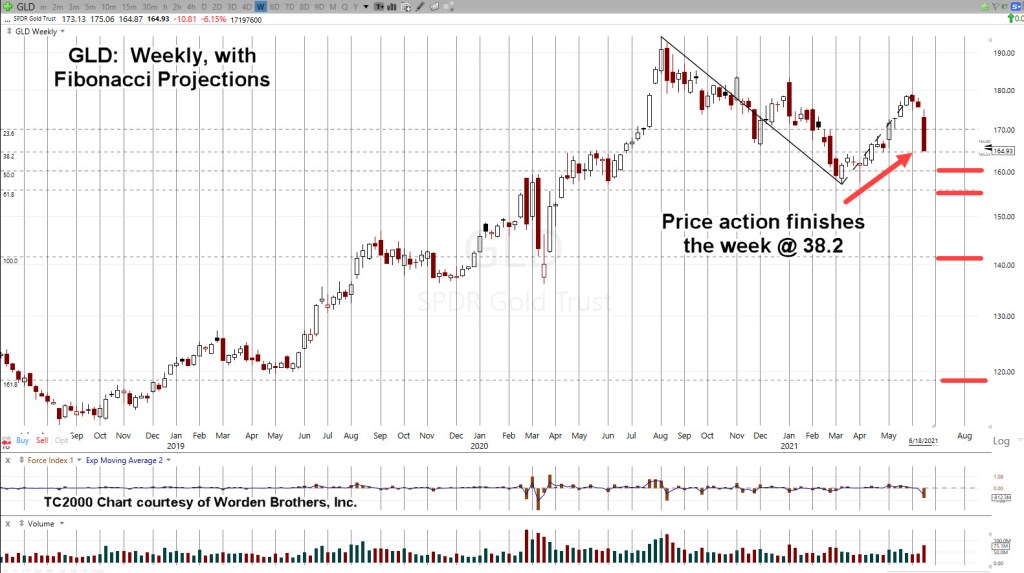
However, that does not negate the fact, he’s one of, if not the only one saying that we’re about to enter a deflationary environment (if not just temporally); complete opposite the conformist (and media led) crowd of hyper-inflationists.
Even Johnny Bravo has said, ‘hyper-inflation will come … but when?’
Summary:
The short positioning in biotech (via LABD) continues: Not advice, not a recommendation.
Rumors are swirling now about power outages and cyber attacks with major corporation website shut-downs.
Does anyone really want be to playing around with long positions when torpedoes (to hit the market) are already in the water?
Stay Tuned