“The “Christmas Bomb” cut communication lines … which by the way is the very first objective during any battle; cut the enemy’s communications.
Matter of fact; that could be the ‘reason’. A test to see how badly communications were disrupted; how quickly they recovered.“
At time stamp 2:00 in this link, Salty Cracker shows the AT&T outage map; nearly half of the U.S. has been affected.
Next week, the markets could rally on such news. Anything can happen.
However, lack of communication means lack of commerce … for an unknown amount of time.
Downside action would seem more probable.
There’s still one more day before the open on Monday … seems like a long way away.
It’s possible by that time, participants will want the safety of bonds.
Bonds that are already sold-short, the most in history.
Stay Tuned
Note: Posts on this site are for education purposes only. They provide one firm’s insight on the markets. Not investment advice. See additional disclaimer here.
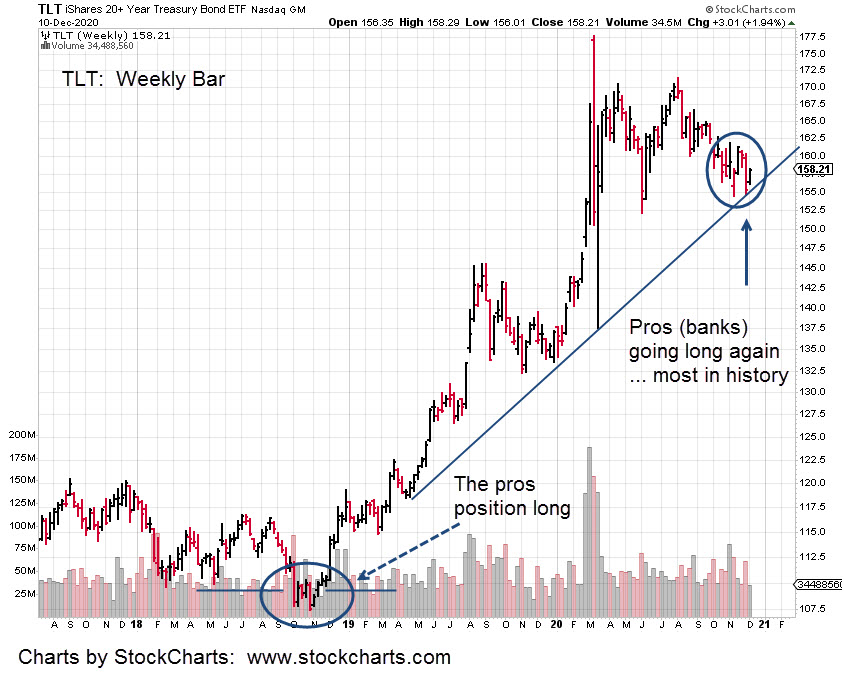
One recent example; the bond move from late 2018, to early 2020.
During the low from October 2018 to November that year, were reports of professionals opening huge long positions.
At the time and as the weeks went by, it appeared that nothing was happening.
The delay would have caused the typical i-phone addicted ‘tweeter’ to lose interest many times over.
When it finally took off, bonds staged a huge directional move that lasted over a year.
Such moves are rare and require the ability to wait. Wait to get in and wait for the move; minimize transactions.
Each market transaction is an opportunity for error. Minimize the transactions and by definition, the errors are minimized as well.
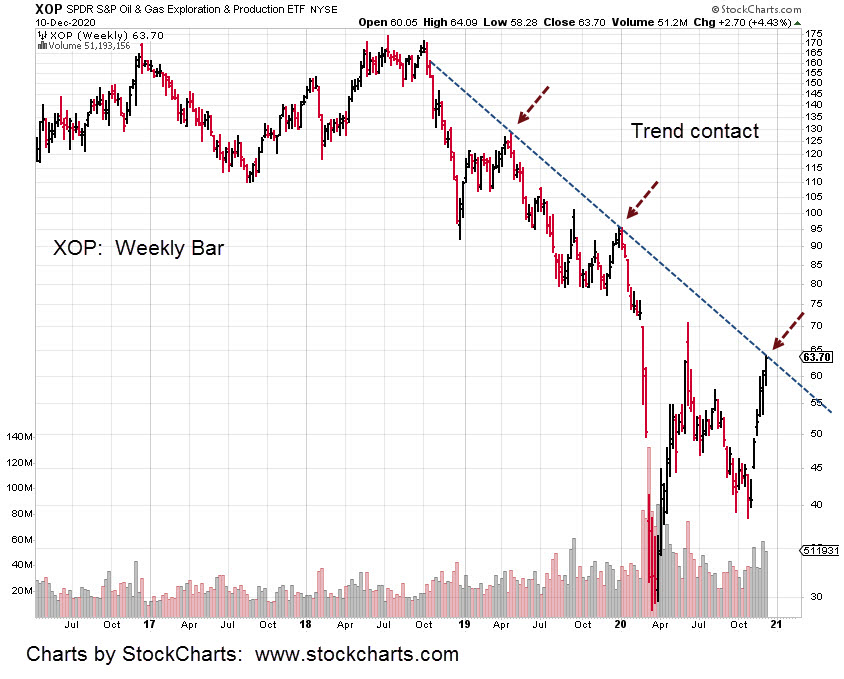
That brings us to oil and more specifically, XOP and DUG.
The nonsense being promulgated by the financial press is that oil is moving higher on ‘hopes’ for an economic recovery.
Maybe injecting the world-wide population with potentially DNA altering technology (not even tested on animals first) for an ailment that does not exist will miraculously launch some kind of pent up consumer demand.
No matter. Oil and its attendants keep moving higher with the dollar moving lower.
Even with anecdotal evidence from an Oklahoma oil field worker (commenting on a Van Metre update) that was later confirmed by the EIA report did not cause oil to move lower … yet.
That is, until today.
The dollar attempted to continue its downtrend yesterday. Oil spiked as did XOP to the upside and DUG to the downside.
This morning is a different story. Dollar proxy, UUP is trading (pre-market) right at its highs of the last session in an apparent reversal.
Oil along with XOP is down, with DUG up.
Looking at XOP, we see it’s hitting a long-established trend line.
With the dollar, bond, and overall market extremes, no recovery in sight and more probable, another (and complete) collapse; this may be the spot (not advice, not a recommendation) to position for medium to long term on the short side.
That’s exactly what the firm has done. Looks like our position was a day too early as we sat through yesterday’ spike lower in DUG.
Volume remained heavy for that DUG session. Weekly volume is looking to be the largest (big-money moving in) since at least 2015.
Note: Posts on this site are for education purposes only. They provide one firm’s insight on the markets. Not investment advice. See additional disclaimer here.
In the pre-market (8:52 a.m. EST) action continues to grind higher. Both the Dow and S&P have posted new highs thus negating the Holiday Turns scenario … but not by much.
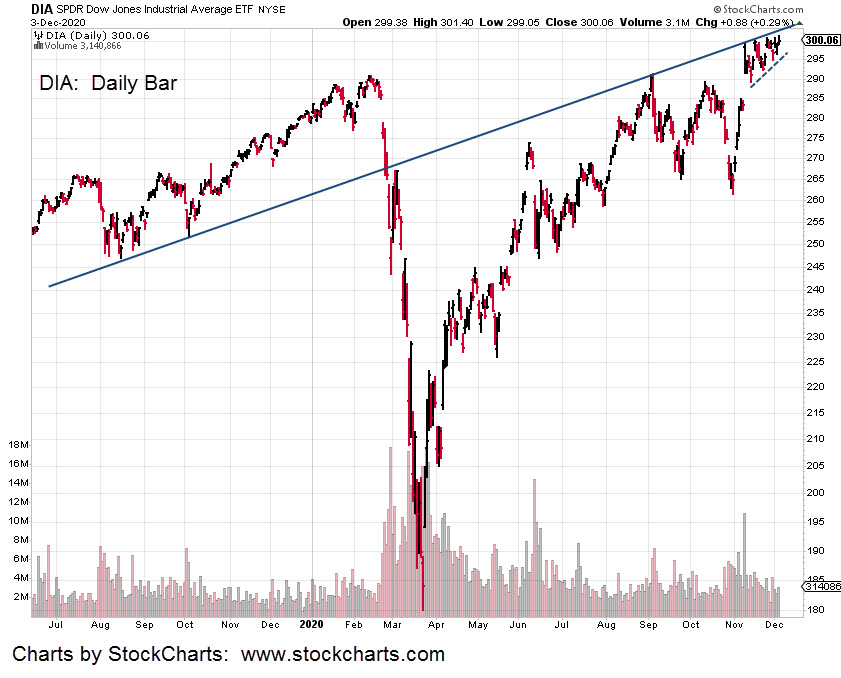
Important to note is each market continues to post on the underside of a long-term trend-line. The Dow chart (DIA) is farther down this post.
Also added to the chart is the dashed trend-line underneath the recent price action. A wedge is being formed; typically last stop before reversal.
In other markets, looks like Biotech may continue higher but along with the others, action appears labored.
The short position could be stopped out at the open.
This area of price action is where cost of being wrong is least. We’re at The Danger Point.
Update: 9:04 a.m. EST: Both AMGN and MRNA have now posted lower in pre-market.
Stopped out does not mean there’s no opportunity. The bearish MACD divergence is still there.
If IBB continues higher, the original ‘150’ target is back in play.
The market extremes are still there: Bonds and the Dollar are short the most in history. Stretched all around.
It’s not unreasonable to expect several attempts to position short.
Note: Posts on this site are for education purposes only. They provide one firm’s insight on the markets. Not investment advice. See additional disclaimer here.
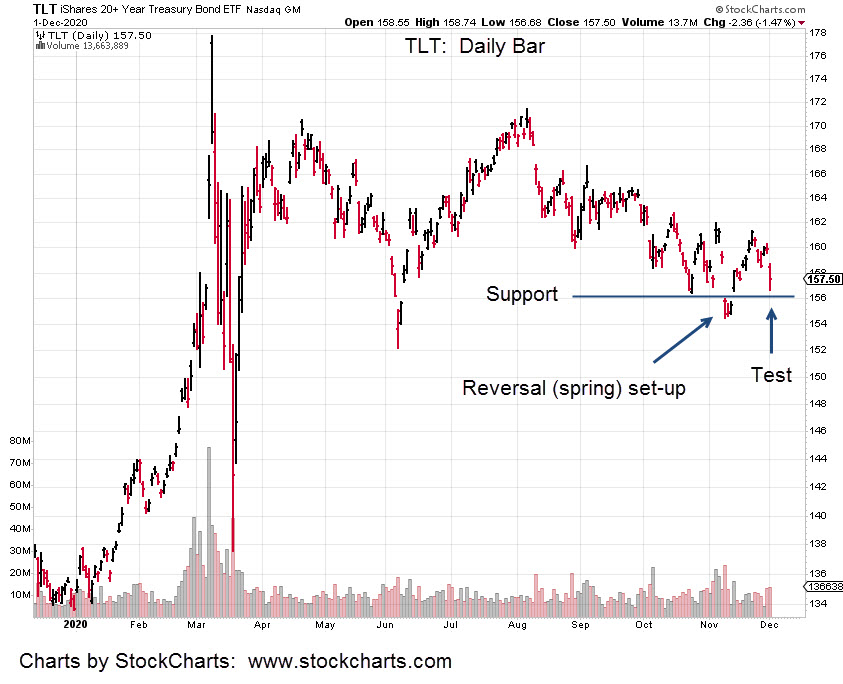
Bonds (TLT) were hit hard during the last session. Are higher rates ahead?
The short answer is no … if the test shown in the TLT chart holds.
What we have is typical market action at a significant reversal.
Putting it in perspective, the push below support (blue line) lasted a full three days before reversing higher.
Then we have twelve days of upward recovery until yesterday. Price action was slammed -1.57%.
It might look like we’re headed back to lower bond prices and higher rates; in effect, what we really have is a test of the reversal.
You can almost feel it. A major event is near.
The equity markets at all time highs … extremes of ‘retail’ participation never seen before.
Couple that with the largest-ever short position in the bond market (about to get squeezed).
The dollar’s at the bottom of its trading range … gold already heading lower.
The sense is a major market reversal is very near. It’s probably already happening but just not obvious enough … yet.
We’re not going long the bond market but rather going short other markets.
Most of the short position in DUST was exited during the last session when price action came back to the intra day highs. The potential squeeze got a reprieve at least for the day.
It’s important to note, yesterday’s GDX move went to a near exact Fibonacci retrace of 23.6%. The down-trend could proceed at any time.
Separately, a short was entered in the biotech sector via BIS (not advice, not a recommendation).
Pre-market activity (as of 9:02 a.m. EST) for IBB indicates a lower open with BIS correspondingly higher.
Note: Posts on this site are for education purposes only. They provide one firm’s insight on the markets. Not investment advice. See additional disclaimer here.
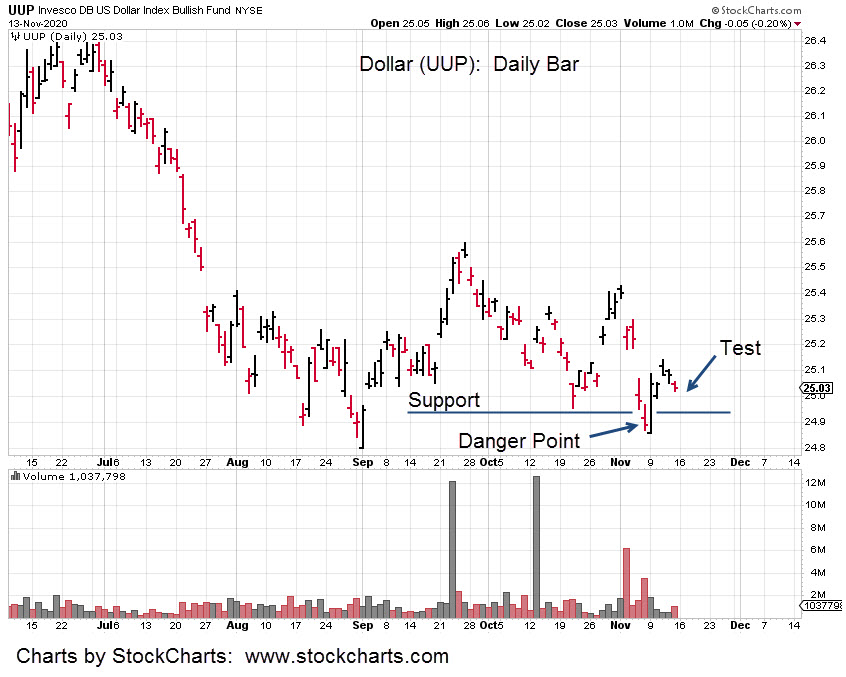
The dollar has reversed and is now testing the lows.
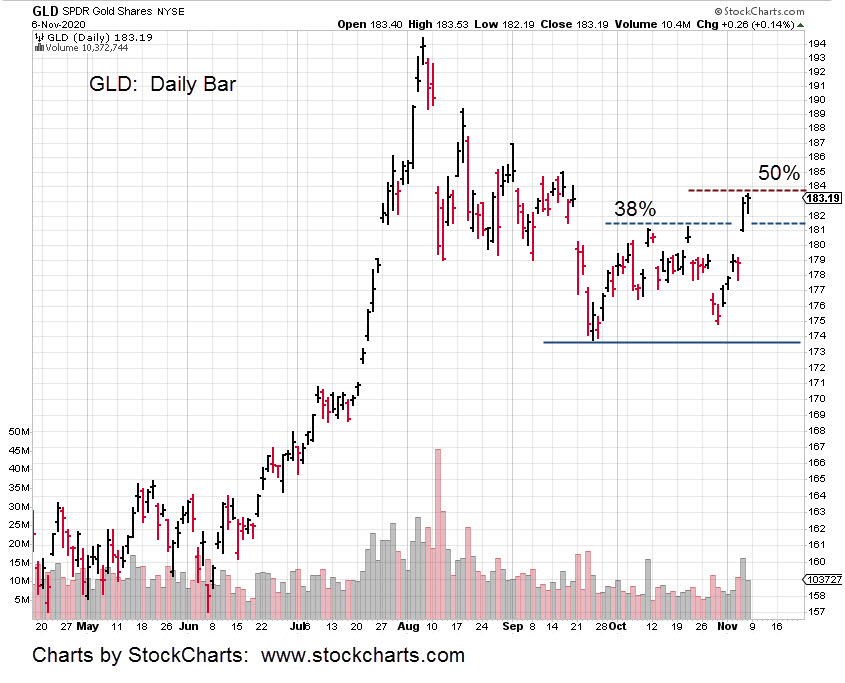
Conversely, when we look at the price action of gold (GLD) its collapse exactly mimics the dollar’s reversal.
Taking into account the futures market activity in gold, it made new daily highs last week during the overnight session, Sunday-to-Monday.
Using that knowledge on GLD, (adding it to price action) it retraced to 38%, of the recent down move this past Friday.
If we’re in a real bona fide reversal of the dollar and gold (posting more confirmation on gold tomorrow), then expectations are for continued gold downside during the coming week.
The dollar, bonds and gold, at this juncture are moving in tandem: Dollar and bonds up, gold (and silver) down.
Note: Posts on this site are for education purposes only. They provide one firm’s insight on the markets. Not investment advice. See additional disclaimer here.
In the past three days, bonds (TLT) penetrated support and stopped dead.
Anytime a market penetrates support or resistance and halts, it’s an indication that something’s up.
Either the market‘s absorbing transactions at that level to continue on, or it’s a reversal about to happen.
With all that’s known on the short position by the speculators as well as another Van Metre report, bank lending standards, probabilities point toward bond reversal.
The dollar is already reversing higher. Gold has been viciously slammed lower and the overall market’s hovering at all time highs.
The Dow edged lower at the last session. This session in the pre-market (9:01 a.m., EST) it’s lower again at -1.94 points or -0.66%.
If the Dow (DIA) gets below the 290- area, it’s below resistance and another move higher may be difficult indeed.
We’re short the sector via DXD (not advice, not a recommendation). A new daily low for DIA will allow our position’s stop to be moved to DXD 13.49.
Note: Posts on this site are for education purposes only. They provide one firm’s insight on the markets. Not investment advice. See additional disclaimer here.
This site works to present truth as background or ‘macro’ as it were and then look for price action set-ups correlating with truth.
It turns out (as some may have suspected) the ‘inflation’ narrative is a myth. It’s just another lie that’s being perpetrated by the powers that be (TPTB).
According to Jeff Snider and Steven Van Metre, at time stamp 21:30, there’s no way TPTB are going to correct the public’s perception that hyperinflation is right around the corner.
It serves their purpose to have the masses in complete delusion … always setting up on the wrong side of the trade.
Using price action itself, problems with the hyperinflation narrative were presented in this update.
Gold is near all time highs. However, Junior Mining Index, GDXJ, and Senior Mining Index, GDX are far below their previous highs. The junior’s are the weakest and so that’s been the focus.
In a bear market, focus on the weak sectors.
No doubt, there are a lot of well respected traders, analysts, YouTuber’s that are on the bullish side of the market. Here are just some examples, here, here, and here.
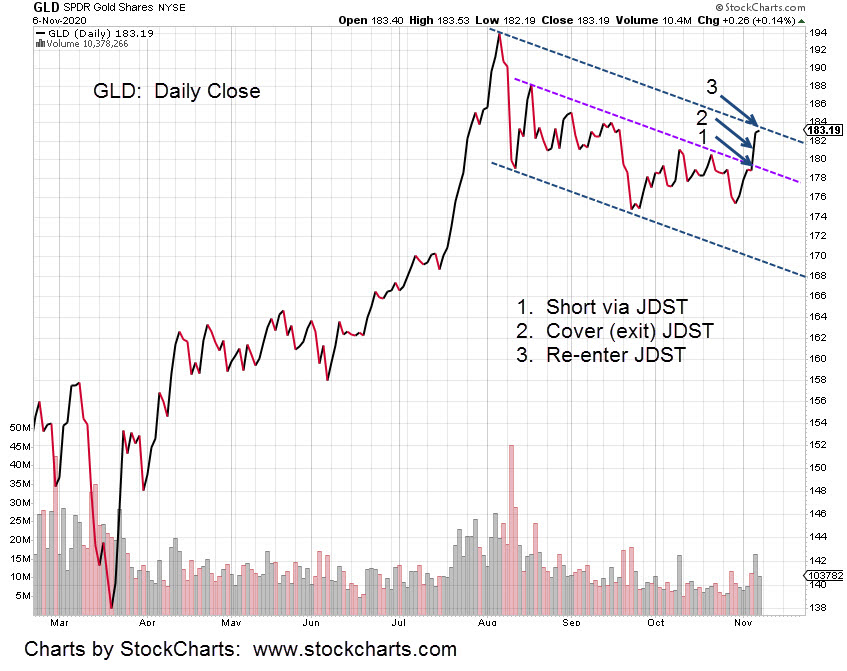
So, at this juncture, this firm is taking the opposite side of the trade with its re-established position in JDST.
Hard stop in the market GTC, is at 8.82 (not advice, not a recommendation).
If stopped out, we’ll reassess and determine if another entry is warranted.
Even if the trade proves to be wrong, it’s a low probability that price action will break out of the GLD trading channel shown (below) in just one attempt.
Typically, price action needs to retrace (lower) to gain enough fuel for a breakout.
If the retrace occurs, it will put the JDST position in profit with the miners down accordingly. Doing so gives the ability to analyze the situation with objectivity.
We’re looking for a swing lower to the bottom of the trading range (at a minimum) for GDXJ. Just a few of the empirical and technical conditions that favor such a move are listed:
Price action (GDXJ) finished at the high of its recent trading range and resistance. It thus created a Wyckoff up-thrust, reversal condition.
The GDXJ move over the past week generated a wide, high volume price bar. Such areas tend to be tested (retraced) by the market.
GDXJ finished at a high on a Friday. Monday’s are typically down or a retrace day.
Gold retraced up to its own 50% level and has contacted the right side of a down-trend line. Lower price action in the coming week is expected.
The dollar has its own reversal set-up in progress.
Dollar, UUP price action penetrated minor support (Wyckoff spring, reversal condition) and is close to a major support level.
Dollar up, gold down.
In summary are two charts of GLD and one of GDXJ, below:
Note: Posts on this site are for education purposes only. They provide one firm’s insight on the markets. Not investment advice. See additional disclaimer here.
As expected from the November 1st, update, gold pre-market shows a gap-higher open. Trading is around 178.80 – 179.00 which is a little above the resistance area shown in the original chart.
After the first hour of trading, the plan is to provide an update to see if there’s still a possibility of a reversal at this juncture (not advice, not a recommendation).
Correspondingly, the mining sectors, GDX, GDXJ are up in pre-market with inverse DUST and JDST, down.
However, the big hitter, NEM is right at a 50% retrace off the lows of October 28th. This is a possible area to stall and potentially resume a downward (or sideways) trend.
Other market actions that may have significant impact on silver/gold, are the four-standard deviation in the bonds to the short side.
As Steven Van Metre indicates, none of us reading this (in our lifetimes) are likely to ever see a set-up like this again. It’s an historic extreme.
Bonds are down in pre-market along with the dollar … using UUP as the proxy.
The dollar has bottomed and is now in position to rally; completely opposite the established consensus.
At least twice now, Van Metre has mentioned Wyckoff in his updates. He appears to be well aware of the significance.
In other markets, a position was opened in nat-gas, UNG at the last session. That position was closed in the pre-market session with a slight ding of -1.2% to the managed account.
Even with record cold hitting large portions of the country, nat-gas can’t seem to get going to the upside. Now, with its current action there may be a probability of lower prices (or stagnant action) going into winter.
We are leaving nat-gas alone for now and focusing on the historic bond set up and the potential effects when it all unravels.
Note: Posts on this site are for education purposes only. They provide one firm’s insight on the markets. Not investment advice. See additional disclaimer here.
Pre market activity (8:31 a.m. EST) has TLT trading up +0.74, at 161.29, which is above the target level set in the last update.
We’ve already laid the groundwork for the ‘speculator’s’ short position in bonds as the largest in history.
It’s the ‘commercials’ that know their markets and in this case (according to Steven Van Metre), the commercials are the banks.
Isn’t it interesting. The banks always get their money, right?
Well, that may be about to happen now, as well.
Just a quick digression from today’s update and concerning the Van Metre link above. At time stamp 14:29, he shows a Wyckoff accumulation schematic. Nice.
From a trading standpoint, there are leveraged bond funds such as TMF (not advice, not a recommendation).
However, this firm has never traded that vehicle and is choosing to be short the junior gold miners (JDST) as well as long natural gas (UNG) for its current positioning.
Natural gas (UNG) for a seasonal trade … with some potential supply disruptions thrown in; the Junior Gold Miner short position (JDST) to work the ‘deflation’ side of what’s going on.
Reports here and here, provide documentation on the thinking behind those positions. Searching for UNG and JDST will give the full gamut of research.
Back to the markets. If we’re doing our job right and there’s a huge down-draft, we’ll already be in position to profit as a matter of course.
Note: Posts on this site are for education purposes only. They provide one firm’s insight on the markets. Not investment advice. See additional disclaimer here.
As reported by Steven Van Metre, here, the long bond speculators have an historic, all-time massive short position.
He shows their net position is four standard deviations away from norm. The chart he references can also be found at Zero Hedge, here.
So, just how significant is that?
The bell curve chart shows the typical 3-standard deviations cover 99.97% of all data observations.
We may as well say that four standard deviations cover all data: 100%.
The speculators are so convinced bond price are going lower (interest rates up), the have amassed a huge position.
Now, it gets interesting.
The chart below of TLT (long bond), has bonds currently declining in a measured move that projects to the 152.5-level. Feeding into the speculator’s positions (giving them a gain thus far).
We also have a Fibonacci time sequence in effect for TLT.
It that’s met in the coming week (and we get a new low), it will be a Fibonacci 34 weeks from the high set during the week of March 13th.
If TLT penetrates the low set on Week 13, and depending on how far below support that penetration goes, it will set up a Wyckoff spring condition … setting up the TLT to move higher.
Moving higher is against the speculator’s positions. They are short and the index would be moving up.
It could potentially be the largest short-squeeze of all time.
If that happens, think about what will happen to the markets, the dollar and the precious metals markets.
Note: Posts on this site are for education purposes only. They provide one firm’s insight on the markets. Not investment advice. See additional disclaimer here.