Bonds (TLT) were hit hard during the last session. Are higher rates ahead?
The short answer is no … if the test shown in the TLT chart holds.
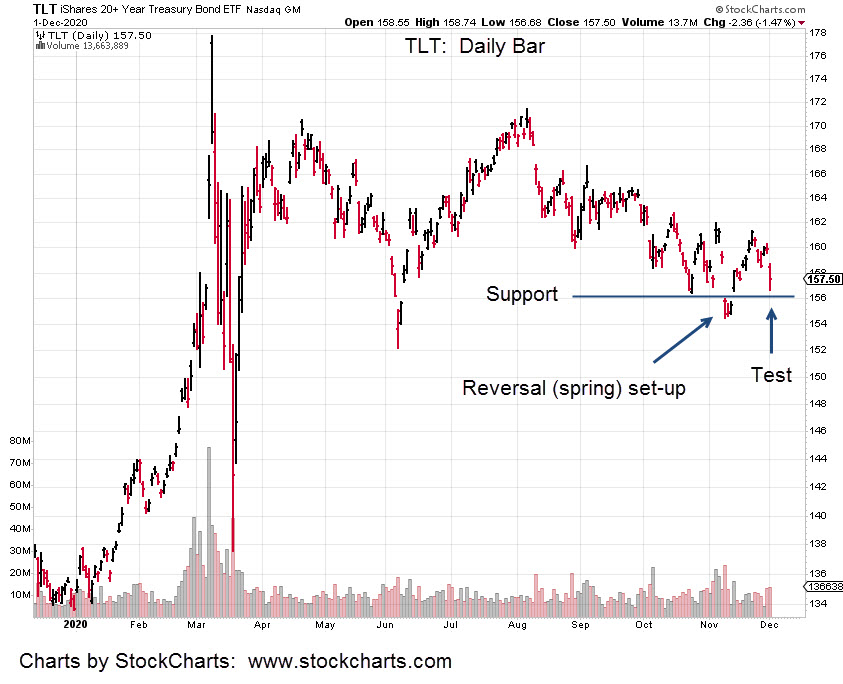
What we have is typical market action at a significant reversal.
Putting it in perspective, the push below support (blue line) lasted a full three days before reversing higher.
Then we have twelve days of upward recovery until yesterday. Price action was slammed -1.57%.
It might look like we’re headed back to lower bond prices and higher rates; in effect, what we really have is a test of the reversal.
You can almost feel it. A major event is near.
The equity markets at all time highs … extremes of ‘retail’ participation never seen before.
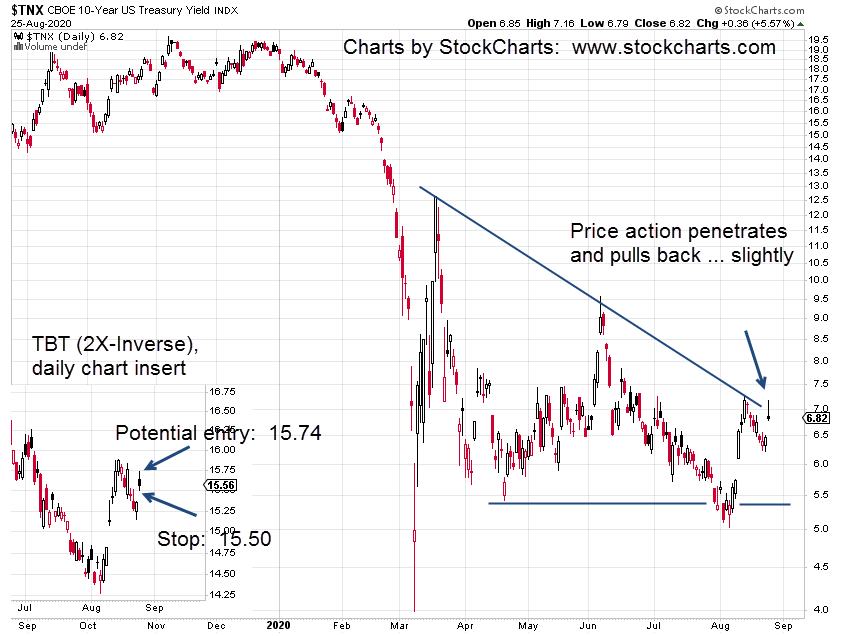
Couple that with the largest-ever short position in the bond market (about to get squeezed).
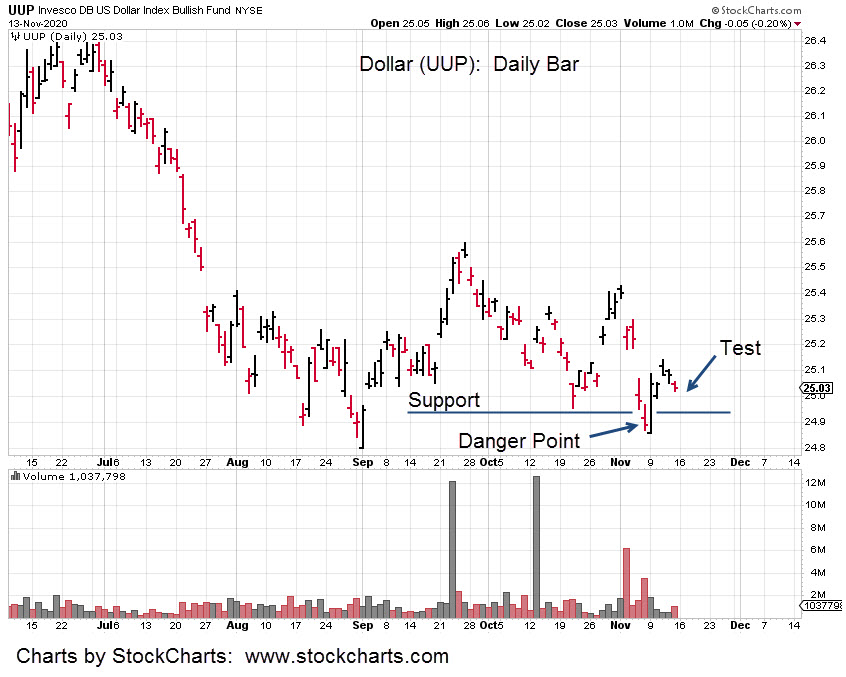
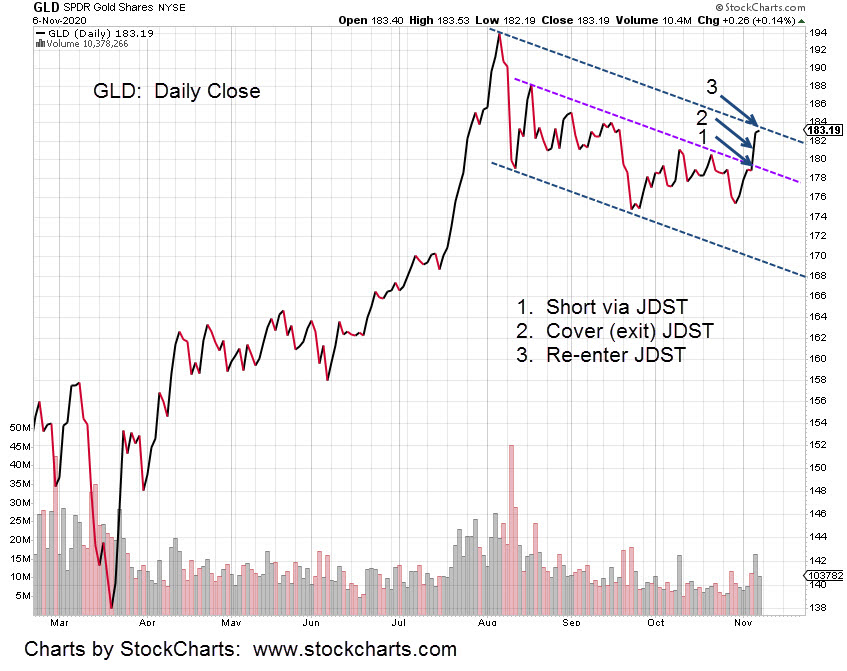
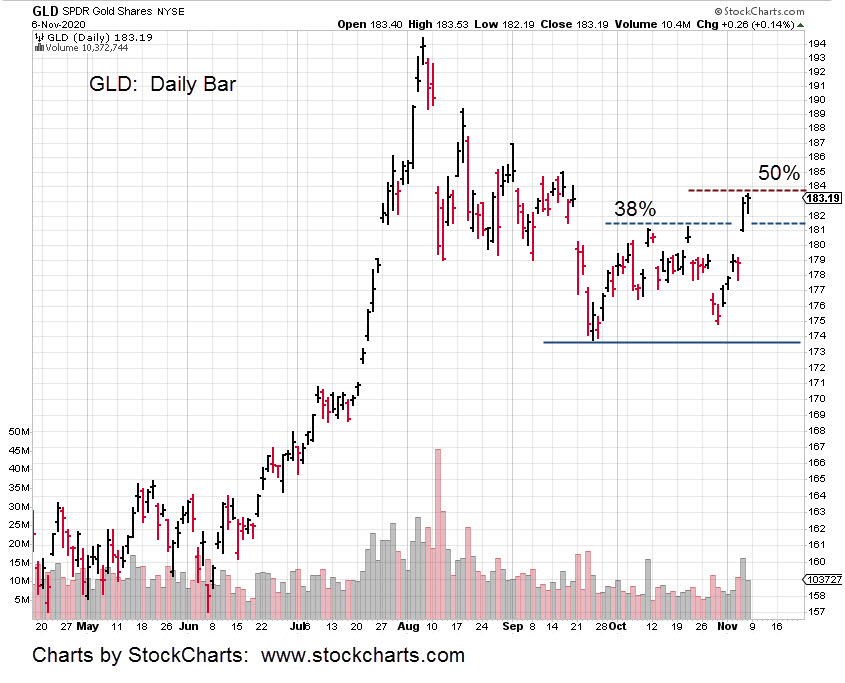
The dollar’s at the bottom of its trading range … gold already heading lower.
The sense is a major market reversal is very near. It’s probably already happening but just not obvious enough … yet.
We’re not going long the bond market but rather going short other markets.
Most of the short position in DUST was exited during the last session when price action came back to the intra day highs. The potential squeeze got a reprieve at least for the day.
It’s important to note, yesterday’s GDX move went to a near exact Fibonacci retrace of 23.6%. The down-trend could proceed at any time.
Separately, a short was entered in the biotech sector via BIS (not advice, not a recommendation).
Pre-market activity (as of 9:02 a.m. EST) for IBB indicates a lower open with BIS correspondingly higher.
Charts by StockCharts


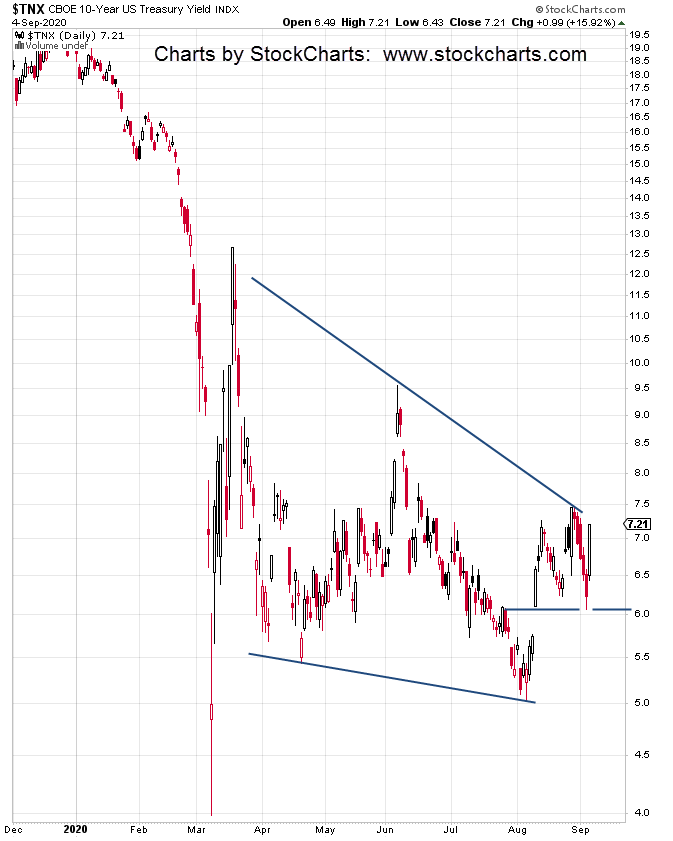


 The bond market is key.