Note: Posts on this site are for education purposes only. They provide one firm’s insight on the markets. Not investment advice. See additional disclaimer here.
When the ‘forecasts’ don’t work out, the complaining comes out.
As Dr. Elder said (paraphrasing), ‘Mistakes in the market are to be expected. Repeating mistakes is a sign of neurosis’.
Typical responses from a YouTube site, forever expecting the ‘hyperinflation’ launch, the usual suspects:
Silver is beyond pathetic
Uggggh premature [launch] AGAIN!
… negative sentiment … a little overdone
Actually, if we’re in a full-blown economic depression, negative sentiment has not even started (not advice, not a recommendation).
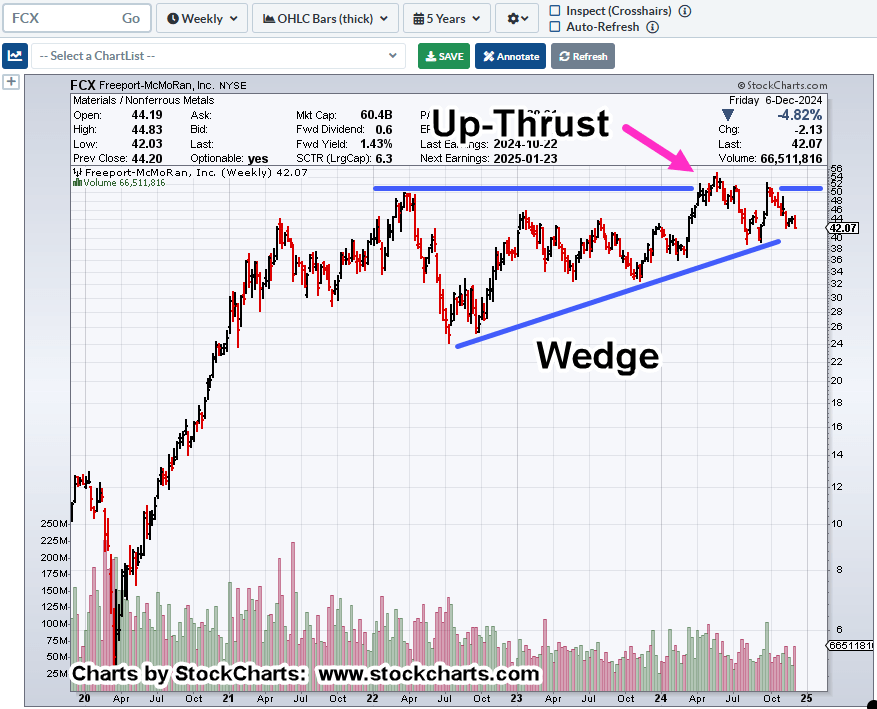
Silver, along with copper (and lumber) are good indicators for the health of the economy. So far, lumber has crashed outright; down ~70% from its 2021, peak.
For copper bellwether, Freeport McMoRan (FCX),it has not looked back since this report.
Let’s move on to silver. What’s the market telling us about the next likely direction?
Silver SLV, Weekly Close
As Yogi Berra said … ‘It’s Deja Vu all over again’ 🙂
The last time there was a similar upside volume crescendo, it marked the pivot point for a 30%, decline.
That decline took two-years to (fully) recover. Hardly ‘hyperinflation’.
Now, we’re at The Danger Point®, anything can happen.
If it’s another downside pivot, just the looks suggest a deeper decline than last time.
If, however, this time really is different, one would expect the upside to get started … and soon.
Note: Posts on this site are for education purposes only. They provide one firm’s insight on the markets. Not investment advice. See additional disclaimer here.
Note: Posts on this site are for education purposes only. They provide one firm’s insight on the markets. Not investment advice. See additional disclaimer here.
Like a stubborn mule, silver’s just not going along with the ‘hyperinflation’ narrative.
How many years of mainstream ‘breakout’ forecasts, has it been?
‘Silver upside breakout just around the corner’. ‘Silver to launch higher because of inflation’. ‘Silver physical shortage to expose futures manipulation’ … and on.
It’s not happening. Why?
Silver, more so than gold, is an industrial metal. In that sense, more like copper than gold.
That said, silver’s price action alone, tells us (along with copper) we’re in an imploding economy.
Before we get to the charts, let’s review what was said at the last update on silver (emphasis added):
“Since gold (GLD) is in position for an upward test of its wedge breakdown (chart not shown), it’s reasonable to expect another bounce off support for silver.
Using the ‘rule of alternation’, we already had a brief move off the first support level before reversing.
The next contact at lower support, will likely bounce for longer or not at all.“
Well, ‘bounce for longer’, is exactly what we got.
The prior bounce from low to high lasted 11-trading days (5/13/22 – 5/27/22). The current bounce lasted nearly twice as long; 20-trading days.
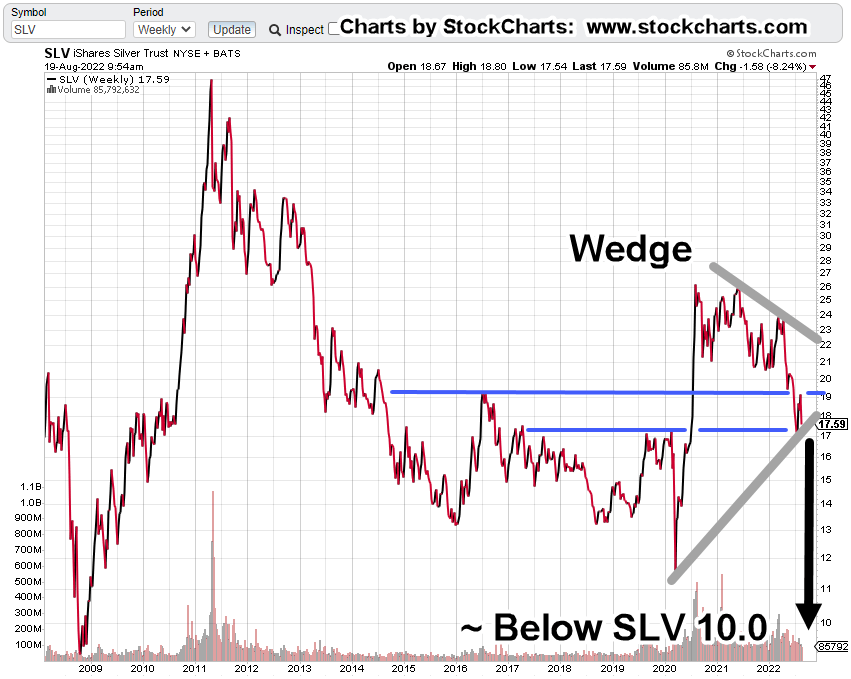
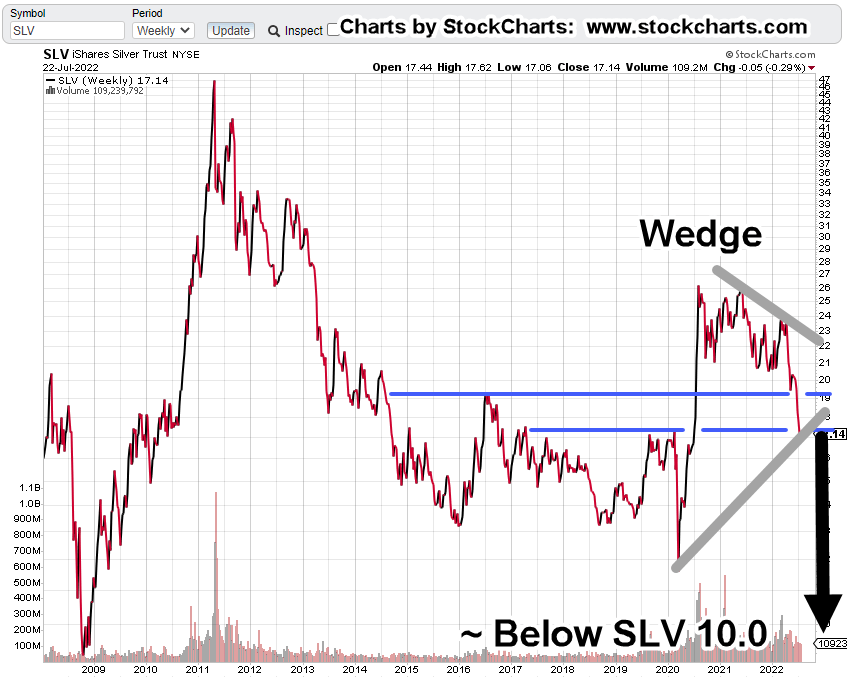
Silver (SLV), Weekly Close
Since the last update, price action bounced off support, confirmed the wedge, tested upside resistance and now, back down to the wedge boundary.
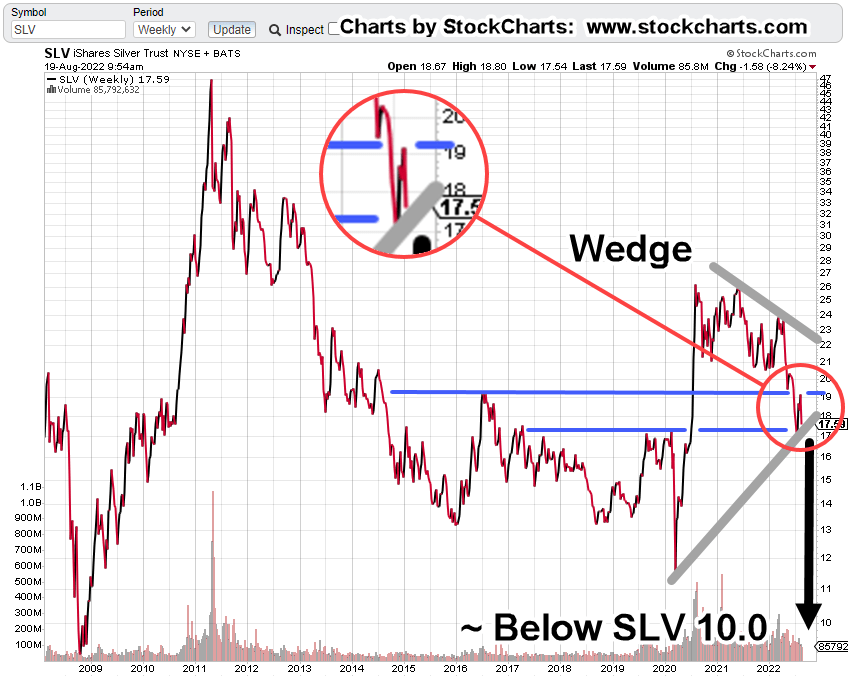
The zoom chart below shows the detail of the resistance test and reversal.
If SLV posts a decisive break below the wedge boundary, standard traditional charting technique provides a downside target in the vicinity of SLV 10.0, or slightly below.
Summary
As always, anything can happen. If silver decides to start posting bullish action, the analysis will be changed.
At this point, with growing fundamentals of economic collapse, i.e., Great Depression 2.0, silver’s price action is fighting the bulls (and winning), thus, confirming the economic decline (not advice not a recommendation).
Note: Posts on this site are for education purposes only. They provide one firm’s insight on the markets. Not investment advice. See additional disclaimer here.
Evidently, according to this out on ZeroHedge, stocks will be a good buy when the Fed pivots; apparently getting back to 2%, inflation.
So many lies, half-truths and pre-suppositions, all in one sentence. Let us count the ways.
Actually, let’s not.
At this point in time, one does not want to draw any undue attention.
A better idea is to see what the market’s saying about itself. This is the crux of Wycoff analysis.
Wyckoff stated a century ago (1902, to be exact), stock prices moved based on an energy of their own; at times, completely disconnected from fundamentals.
Looking at those markets and from my own tracking spreadsheet, 106, indices or equities are currently monitored.
That list will change over time but it’s typically around 100 or more ticker-symbols.
Of that number, the following are those currently in a downward sloping trading channel.
Note: Posts on this site are for education purposes only. They provide one firm’s insight on the markets. Not investment advice. See additional disclaimer here.
Media analysts and YouTubers alike, are scratching their collective coneheads.
They’re asking; why is silver down a whopping – 39%, from its print high of February 1st, this year?
If we factor in the high of SLV 48.35 (from April of 2011), silver’s been pummeled – 65%.
With the ‘rampant’ inflation and never-ending money printing, silver (along with gold) should, there’s that word ‘should’, be skyrocketing higher.
It’s an apparent mystery; steeped with smoke-filled back rooms and intrigue.
The ‘Inflation’ Narrative
Let’s help unravel silver’s decline by taking a look at some of the facts.
First up, is ‘inflation’.
The inflation narrative is false. There; glad we got that out of the way. 🙂
How do we know?
We know it’s false because the price action itself, tells us it’s false.
It’s obvious at this point, what we have is supply destruction and not inflation.
The Economic ‘Connection’
Next up, is the economy.
Silver along with copper are industrial metals. They follow the economy … more so with copper. Copper futures are down – 32.5%, from their March 7th, highs.
Coper’s industrial uses are linked here. Nearly half of copper production is for building and construction.
Since the largest real estate bubble in world history has just popped, copper demand is essentially going to collapse.
If at this early stage of Great Depression 2.0, the average person can’t pay the phone bill, where are they going to get any money to drive precious metals demand higher?
Moving on to ‘truth’, we have price action.
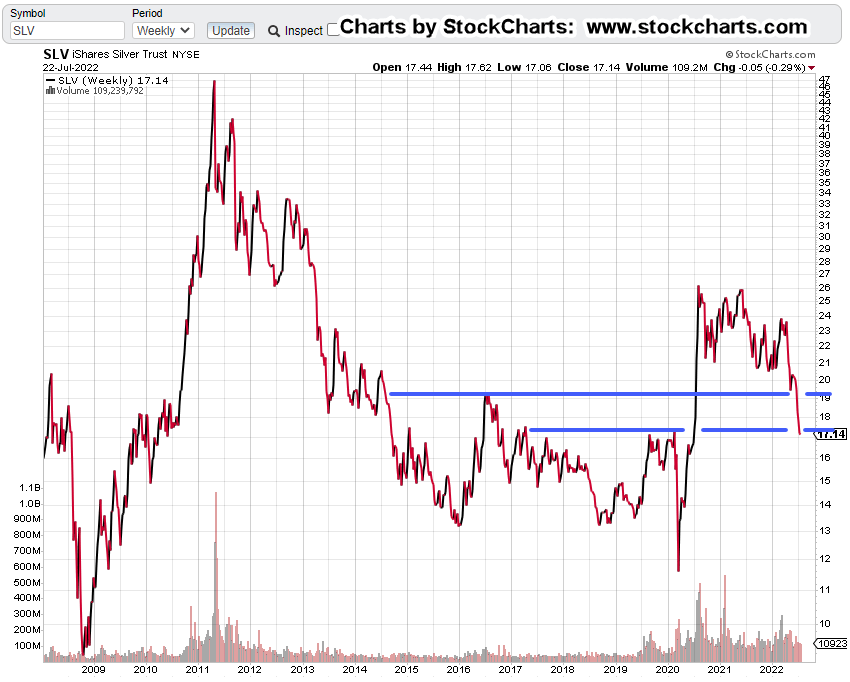
Silver SLV, Weekly Close
The chart below has SLV, penetrating one support level (upper blue line) and just now, at the next support.
Since gold (GLD) is in position for an upward test of its wedge breakdown (chart not shown), it’s reasonable to expect another bounce off support for silver.
Using the ‘rule of alternation’, we already had a brief move off the first support level before reversing.
The next contact at lower support, will likely bounce for longer or not at all.
If silver can’t go higher … look out below.
Silver SLV, To Single Digits?
The economic depression is just getting started and industrial metals demand is already collapsing.
Although a data point of one, the following is significant.
Supporting the ‘depression’ assessment is this link; specifically, time stamp 3:20, with a recent graph of housing listings in California … going vertical.
SLV, is in position to test higher; thus, confirming the wedge pattern (grey lines) shown below.
Added to that pattern is a measured move target should SLV, break down to lower levels after an upward test.
There it is: ‘Mystery’ solved.
Silver is heading lower because price action said it would.
Now, the fundamentals are kicking in to add a potential mass acceleration to the decline.
Note: Posts on this site are for education purposes only. They provide one firm’s insight on the markets. Not investment advice. See additional disclaimer here.