Real Estate: Downside Targets

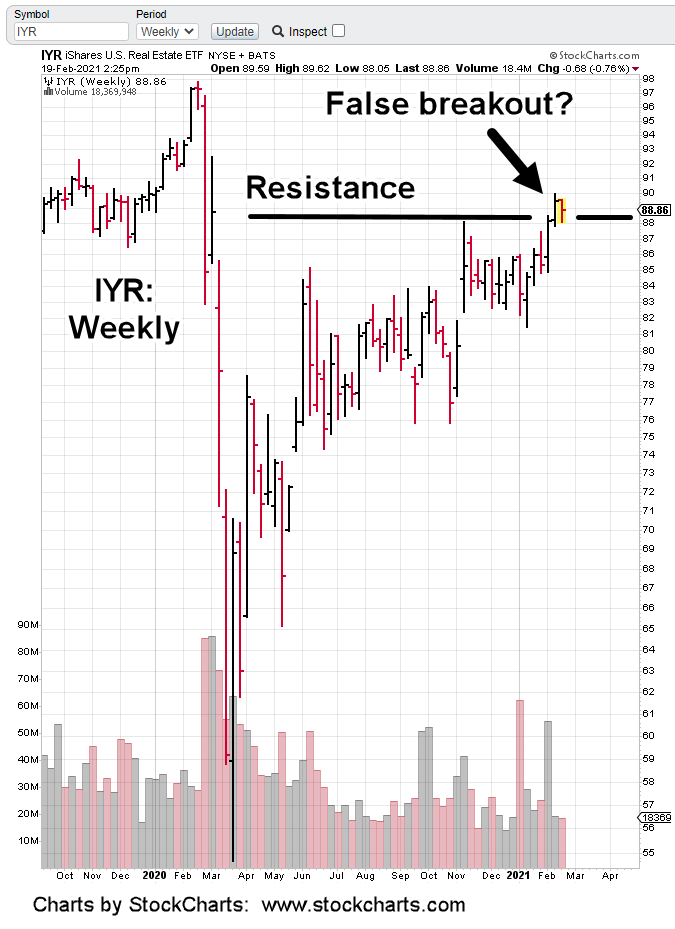
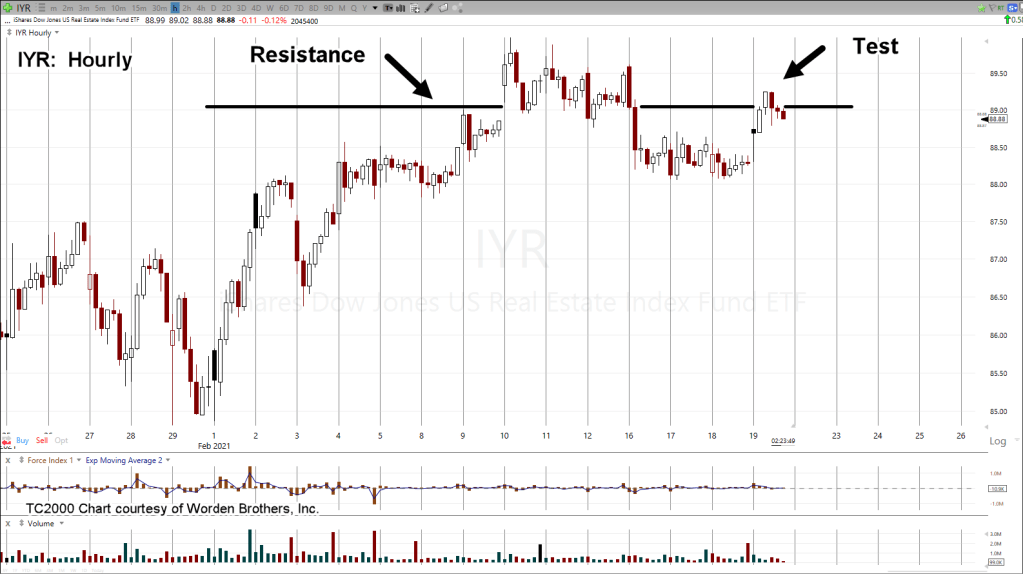
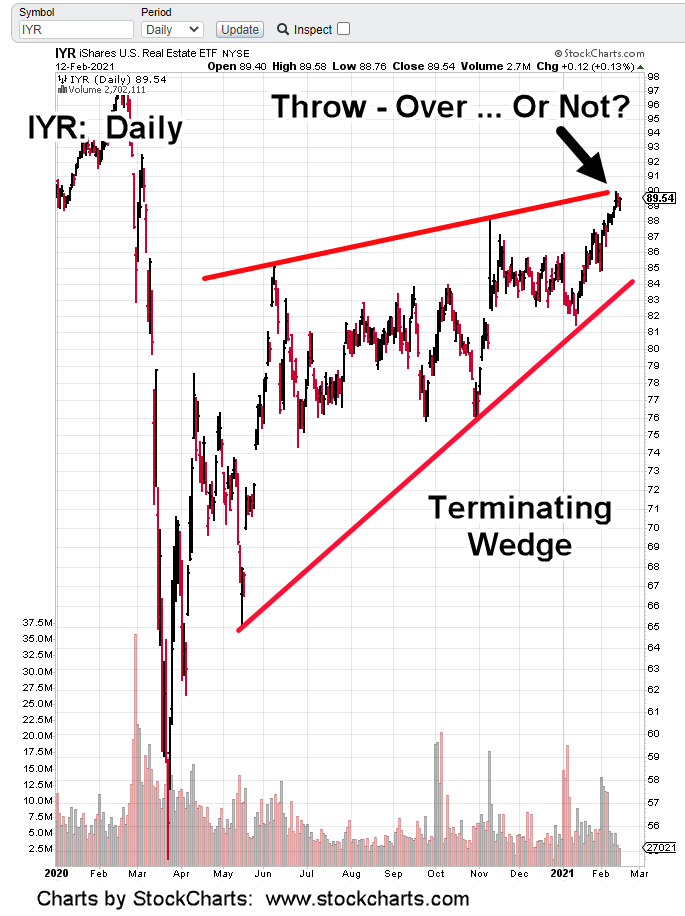
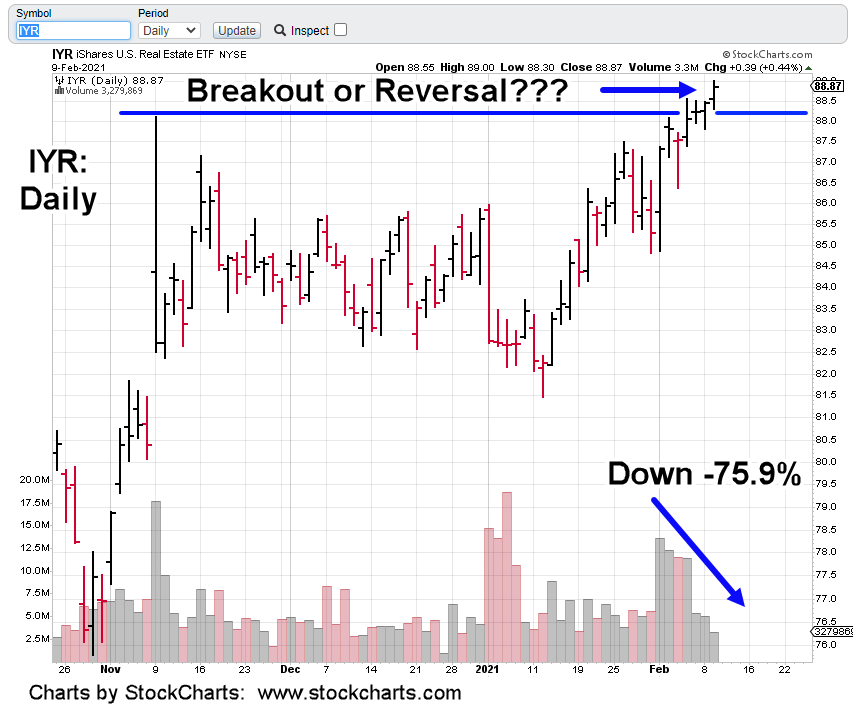
IYR has reversed with a decisive ‘outside-down’ week.

This sector has likely seen its highs for the year and probably its all-time (recovery) highs.

The latest news from Steven Van Metre does not paint a good picture for the economy or the markets (bonds excepted).

Jerimiah Babe (J.B.) has also posted an update on Los Angeles. It’s a human and economic tragedy. Unfortunately, this is where the Cadillac has gone off the cliff.

We’ve continually held to the stance, there’s no recovery.

The “recovery”, is a mainstream narrative intended to keep the herd focused in the wrong direction and on the wrong things.

Judging by the hysteria with small cap short squeezes, physical silver and bitcoin (kind of hard to access when the power goes out), the promulgator to the proletariat, the mainstream media, has done an excellent job.

In fact, that is their job.

Interest rates might only need to stay elevated for a short while (a few weeks) to completely choke off any semblance of economic activity.

After that, collapse is likely to feed on itself. Even if rates eventually go back lower, it’ll be too late. The juggernaut has been set in motion.

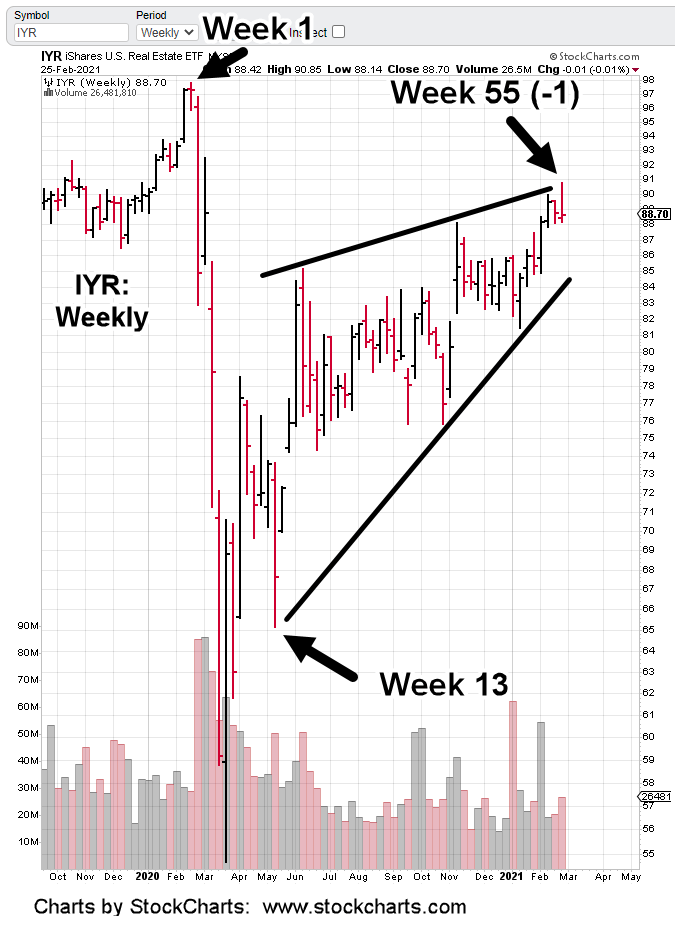
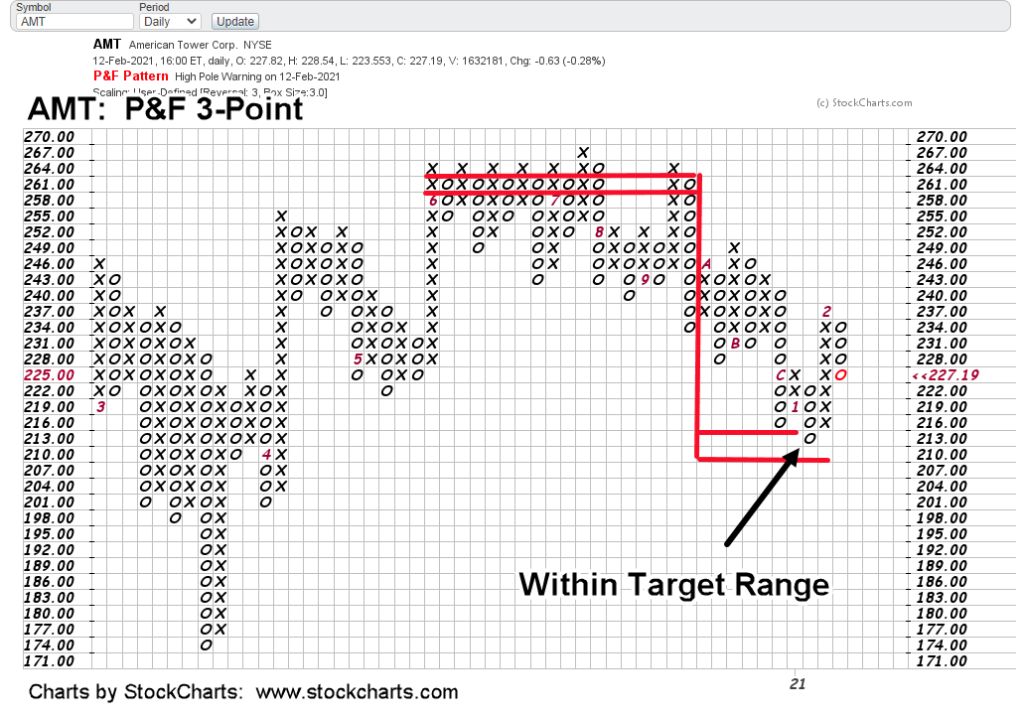
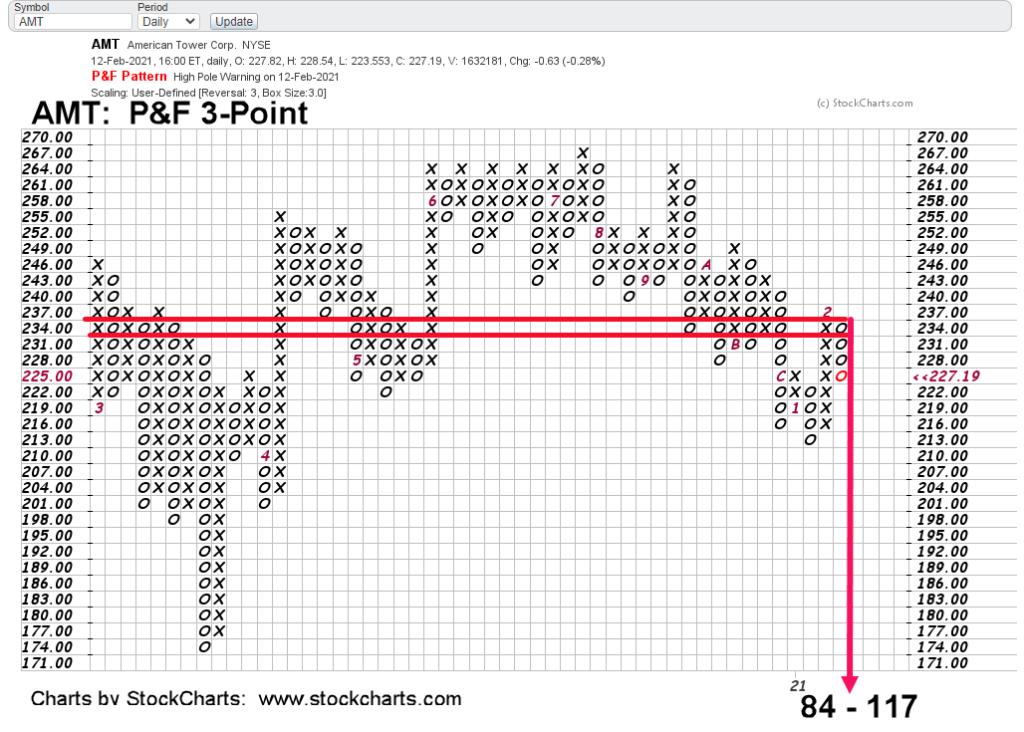
This week had IYR posting outside-down. That in turn, added a print to the P&F chart which helped to complete a downside forecast.

Reaching the target levels puts IYR below all recent support. That support would then become resistance for any upside counter-trend action.

Ultimately, we’re looking for IYR to go below 2009, lows.

If that happens, it could take months or years. P&F charts are independent of time. They only show potential.

As provided in earlier updates, my firm is positioned heavily short IYR via DRV (not advice, not a recommendation).

From here and depending on market action, the plan is to increase that short until volatility prevents further, low risk entries.

As always, anything can happen and next week could be a miracle reversal. If so, we’ll assess price action at that time.

Stay Tuned

Charts by StockCharts

Note:  Posts on this site are for education purposes only.  They provide one firm’s insight on the markets.  Not investment advice.  See additional disclaimer here.

Real Estate … Implosion?

Watching J.B.’s (Jerimiah Babe’s) Los Angeles walkabouts, proves commercial real estate’s already imploded.

The instant the linked video starts, we see the root of the problem.

Neo-feudalism.

Of course, it’s all part of the plan but that’s a topic for another time.

What’s shown in J.B.’s video(s) is that one after another, commercial properties are boarded up and fenced off.

One might think it’s only progressive utopia California that’s having a rough time; taking a look at comments to his videos shows otherwise.

Just one example taken from the video link:

“Even if the U.S. lifted all lockdown restrictions 100% TODAY, I still think for many companies, its too late.”

The economy is not coming back … not in our lifetimes anyway.

No matter what happens, re-building will take many decades. Even so, the destruction has to be completed first.

We’re nowhere near downside end (economy, markets or otherwise).

On Thursday you would’ve thought from the news, we just collapsed by 50% or more. In fact, the S&P (SPY) was only down -2.41%.

Think about what happens we get the hit … that does not come back.

As early as May 12th of last year, this site began to note the similarities of the markets to August of 1987. In retrospect, that post (and the ones that followed) seemed a little premature.

It’s a different story now.

Markets even more extended; bond rates higher.

Throughout the years, going back to the early 1900’s, the professionals always preferred down markets. Profits (and fortunes) can be made much faster and with more reliability.

Fear is much easier to gage (on the charts) than greed.

With that in mind, we can look at real estate with a clear head and assess the opportunities.

It turns out, not only has IYR got itself into a terminating wedge, it’s doing so at Fibonacci time frames.

During the past six-weeks, my firm (link here) has been positioning in and out, and back in, several times using short fund DRV (not advice not a recommendation).

Just yesterday, before IYR broke decisively lower, that DRV position was increased to its maximum level thus far.

Obviously, a new high in IYR is not anticipated. The reason for selecting real estate as a strategic short (unlike the LABD swing trade) is for the downside potential.

Inverse leveraged funds work best during a sustained, directional move. It remains to be seen if DRV was a good selection; not only for a trade vehicle, but for the anticipated collapse in real estate.

Stay Tuned

Charts by StockCharts

Note:  Posts on this site are for education purposes only.  They provide one firm’s insight on the markets.  Not investment advice.  See additional disclaimer here.

Real Estate Top

It’s about an hour before the close and real estate, IYR is struggling to reman above resistance.

Two charts are provided in this update. Weekly and hourly.

The big picture is the weekly.

Resistance at 88 – 90, level is clear.

The second chart is the hourly.

Price action on the hourly can be seen posting above resistance for about three trading days. Then, it reversed lower this past Tuesday, the 16th.

The largest cap in this ETF, AMT remains in its own down trend.

Today, it attempted to move higher but that higher level (around 229.50) could not hold.

At this juncture, AMT (chart not sown) is trading lower near 228-level.

AMT has been discussed previously. Most recent update at this link.

Summary:

Real estate, IYR is testing the attempted breakout higher during today’s session. So far, that test is not able to hold; indicating weakness.

In addition, last week’s up-volume contracted by -65% over the prior (breakout) week.

There is apparently no (or very little) support at these levels.

Market Positioning (not advice, not a recommendation)

I have maintained my firm’s position short this sector via DRV, the 3X inverse of IYR.

If IYR can’t get significantly above resistance during this session, the long awaited IYR top and reversal may be at hand.

Charts below:

Hourly chart of IYR

Charts by StockCharts

Note:  Posts on this site are for education purposes only.  They provide one firm’s insight on the markets.  Not investment advice.  See additional disclaimer here.

Miners, GDX Accelerates Lower

With GDX posting a new weekly low (below 33.23) early this session, it’s helping to confirm a pivot and acceleration to the downside.

Bullish or bearish, it’s a crowded trade that we’re avoiding (not advice, not a recommendation).

It took over a week of oscillating price action before GDX decided to post below the February 4th, low.

Even so, when an established low is penetrated, it puts the market in “Wyckoff Spring Position’.

That means there’ll (potentially) be some type of rally or rally attempt. If that happens, it’s just more oscillations that result in erosion of leveraged inverse funds.

Other areas of the market are performing better on the downside. Real estate IYR, looks like it may post a narrow range day (as of mid-session).

It’s typical action when at support. If there’s no break lower today, then IYR could make an attempt higher at the next session.

Based on previous analysis, that attempt (if it occurs) is expected to be short lived.

Charts by StockCharts

Note:  Posts on this site are for education purposes only.  They provide one firm’s insight on the markets.  Not investment advice.  See additional disclaimer here.

AMT: Downside Leader

Early in the session, looks like AMT is leading the way lower.

In addition, a new pivot may have been established along with a new (lower) trend line. Subsequent price action will determine if we’ve seen acceleration to the downside.

Separately, IYR has just posted a new daily low … helping the case for reversal (and not ‘throw-over’) at this juncture.

The firm maintains its short position via DRV (not advice, not a recommendation).

Separately, bonds (TLT) broke lower at the open which was unexpected.

The long position in TMF (3X TLT) was exited just after the open. Not advice, not a recommendation.

Even though expectations are for TMF to recover, we’re not going to wait around and hope.

One gets the sense events are happening quickly at this session. Was the Texas blackout the ‘event’ to trigger a market reversal?

It’s possible. Real esate, IYR now trading lower at -1.38%, just 90-minutes after the open.

Stay Tuned

Charts by StockCharts

Note:  Posts on this site are for education purposes only.  They provide one firm’s insight on the markets.  Not investment advice.  See additional disclaimer here.

Throw-Over, Or Not?

IYR’s in a terminating wedge … will it throw-over, or reverse from here?

American Tower (AMT), the largest cap in the ETF, bounced off a 23.6% projection during last Friday’s session.

That keeps a short term bullish possibility alive. Longer term, AMT still remains in a downward trading channel.

Bonds and the dollar continue at extremes. On the dollar side, it looks like a significant bottom is in the works.

Weekly UUP, MACD has posted a bullish divergence along with an MACD lines cross (to the upside) signal.

Bonds (TLT) remains at its near term lows; near support levels formed back in September, 2019.

IYR is right at the upper wedge boundary and volume (upside pressure) has dropped significantly.

It could still levitate higher … however, it seems that getting a significant ‘throw-over’ is going to require more energy than is currently available.

We’ll see what price action has in store for Tuesday’s session.

Stay Tuned

Charts by StockCharts

Note:  Posts on this site are for education purposes only.  They provide one firm’s insight on the markets.  Not investment advice.  See additional disclaimer here.

American Tower, Revisited

Last week, the analysis of American Tower Corp., signed off with this:

“The expectation for the coming week; AMT continues its reversal and takes the IYR sector with it.”

The chart above was provided to support that analysis.

The chart below shows the result:

So, AMT met expectations by reversing on cue. Did it take the rest of the market (IYR) with it? Before that’s addressed, let’s look more at AMT.

The 3-Point P&F chart is shown below with projected targets.

For over a hundred years, this is how P&F charts are used to identify potential.

Price action indeed, met the target and then reversed.

What’s more, we can see AMT bounced off the top of the projection (~216) area first, then came back to the target.

AMT then went on a counter-trend move to ~238, before again, reversing lower last week … which brings us to now.

Stated several times in these updates, if and when IYR reverses, because of its own price action, it will create even lower targets.

A good illustration is to use AMT:

Now that its moved lower, met targets, rebounded only to reverse again, we have a new projection.

When and if IYR reverses, it will create similar downside targets.

The daily chart (below) has AMT price action overlaid with Fibonacci projections to lower levels.

It might be a little hard to see but Friday’s action bounced off (exactly) at the 23.6%, projection.

What this means is, AMT price action is “respecting” the Fibonacci level.

That gives high probability the level is valid. If we really are in a continued AMT reversal, now we have high probability downside targets.

Tying this all together and using the weekly chart of AMT (with the Fib targets) we get this:

Note how the 1:1 projection (shown as 100.0) is near exact at the March 2020, low of 174.32.

Price action itself defines what levels are important.

The ultimate P&F projection of 84 – 117, is far below what’s shown on the weekly chart.

However, AMT: 77 – 78, does correspond to Fibonacci projection at 261.8%, … very near the ’84’ P&F low.

There’s a lot more to AMT and IYR but the post has gone on long enough.

There’s also no guarantee AMT and IYR will meet any projected levels. That is the way of the markets.

However, what’s being done is to (continue to) present a significant case for long-term sustained downside reversal; carrying the real estate sector to levels (ultimately) below that of 2009.

Charts by StockCharts

Note:  Posts on this site are for education purposes only.  They provide one firm’s insight on the markets.  Not investment advice.  See additional disclaimer here.

Not Sustainable

The Russell 2000 (IWM) puts it into perspective.

Trending higher at nearly 1,000% annualized, it’s obvious a break is coming.

Exactly how or when of course, is not known.

However, it has been proposed by this site (for years), when the final bubble-break comes, it’s likely to be an over-the-weekend event that results in a severe gap down open.

A gap down of say, 20% – 50%.

Can’t happen? After the events of 2020, we should all know that anything can happen.

Theoretically, a gap down of -25% from current levels, puts IWM right at long-time support around ~170.

Under such conditions when a severe disconnect is possible, one approach is to prepare on the short side (not advice, not a recommendation).

Using Wyckoff analysis techniques (for bear markets), that means to look for sectors not participating in the mania. When the downdraft hits, those markets will (potentially) move lower farther and faster.

That brings us to real estate, IYR

Using the same time-scale and trend line notations, we get the chart below:

From a purely visual perspective, the struggle to move higher is obvious. The past two sessions have made no net progress.

Looking more closely at recent action, IYR is following a Fibonacci time sequence.

From the low on January 12th, to the most recent high on Wednesday the 10th, is a Fibonacci 21 days.

The added bonus is the inflection point on Day 13.

Bid/Ask spreads on inverse fund DRV, in the pre-market are not that reliable; at this juncture, 8:10 a.m., EST) they indicate a higher open.

Stay Tuned

Charts by StockCharts

Note:  Posts on this site are for education purposes only.  They provide one firm’s insight on the markets.  Not investment advice.  See additional disclaimer here.

Into Thin Air …

Yesterday’s action in IYR, looks like a breakout higher.

That is, until you look at volume.

Price action levitates higher while everyone leaves the party.

From the start of the last thrust higher on February 1st, volume has declined over 75%.

There are two possibilities:

  1. Buyers and Sellers are backing away; letting prices drift.
  2. There’s no bullish commitment at these levels; reversal imminent.

Two quotes that accurately sum up the overall market situation; from Johnny Bravo and Steven Van Metre respectively:

‘One thing or the other, something’s going to break’

‘This is pretty dangerous stuff going on here’.

Before we wrap up, we’ll add just one more thing.

Junk yields have sunk to record lows.

Why buy TLT at ‘relatively’ safe 1.55%, when you can have junk yield at 3.95%, that’s going to blow-up (launching TLT into the stratosphere) at any time.

Stay Tuned

Charts by StockCharts

Note:  Posts on this site are for education purposes only.  They provide one firm’s insight on the markets.  Not investment advice.  See additional disclaimer here.

Real Estate: At the Pivot?

Just a few minutes into the session: IYR has posted a new daily low. Friday’s low, 89.75 was penetrated quickly.

We’re in nuanced territory.

IYR is hovering as if undecided.

Price action could recover and go on to new highs. However, looking at the weekly chart above, IYR filled the gap during last week’s action.

American Tower, AMT (researched over the weekend) has also posted a new daily low; potentially confirming its long-term reversal.

We’re at The Danger Pont: This is where risk is least.

Maintaining short IYR via DRV (not advice, not a recommendation).

Charts by StockCharts

Note:  Posts on this site are for education purposes only.  They provide one firm’s insight on the markets.  Not investment advice.  See additional disclaimer here.