‘Last Man Standing’

Founded by William Boyce Thompson in 1916, Newmont (NEM) was around over a century ago during Livermore and Wyckoff’s day.
Thompson is center in the photo with President, Warren G. Harding at left.
Wyckoff and Thompson were interconnected.
In Wyckoff’s autobiography, he writes about working for Thompson’s firm (Thompson, Towle & Co.) in 1910.
During that time, he describes no fewer than two stock ‘manipulation’ schemes; one by renowned James R. Keene and the other by Thompson himself during a deal-gone-bad with the Guggenheims.
Also in 1910, Wyckoff published his seminal work: Studies In Tape Reading. If there’s any one book to read concerning how markets work, ‘Studies ..’ is that book.
Wyckoff had first-hand exposure into market operations by the wealthy and super wealthy. More importantly, he saw how those transactions showed themselves on the tape.
Last check, a first edition ‘Studies’ went for around $3,500. A quick search as of this post, turns up nothing currently available.
For those who complain ‘it’s rigged’, to that we can say, ‘it’s always been rigged’.
Determine what those ‘rigging’, are trying to accomplish and you may have a trade.
Now, to the market at hand: Newmont Mining.
It’s the key; the largest cap equity in the Senior Mining Index (GDX).
Newmont, NEM
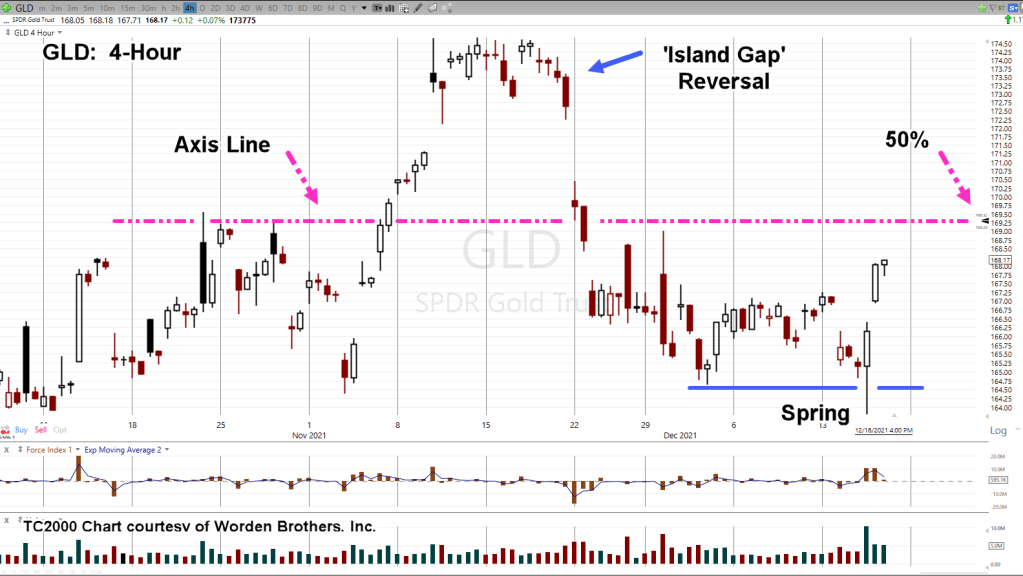
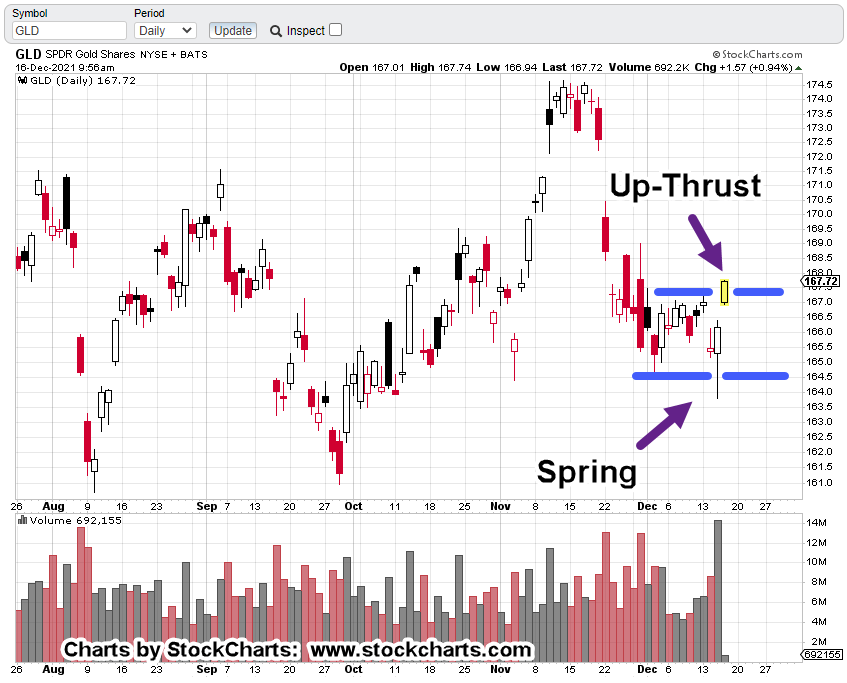
The daily chart:
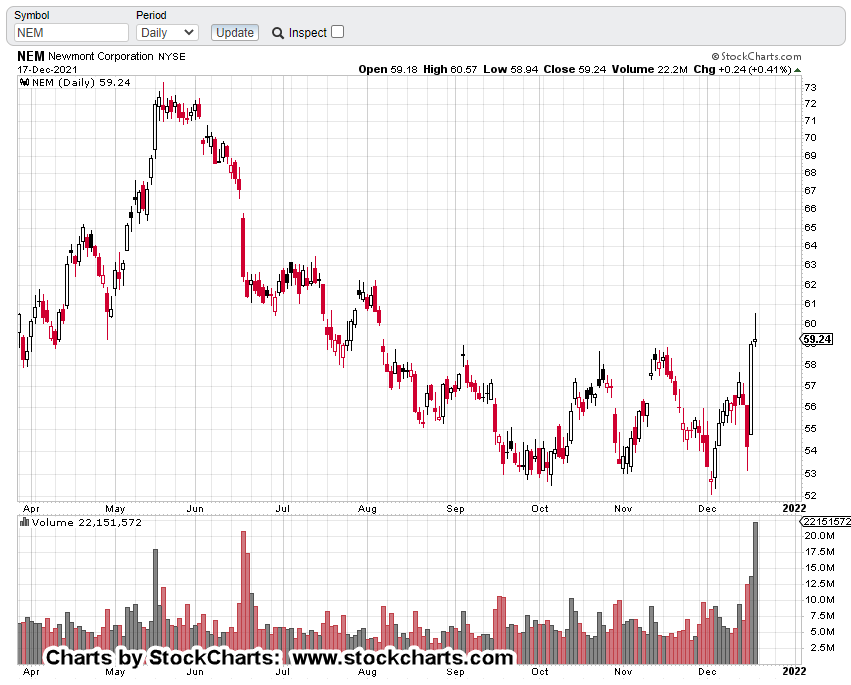
For those who have been with this site for a while, you may instantly see the set-up: Spring to Up-Thrust.
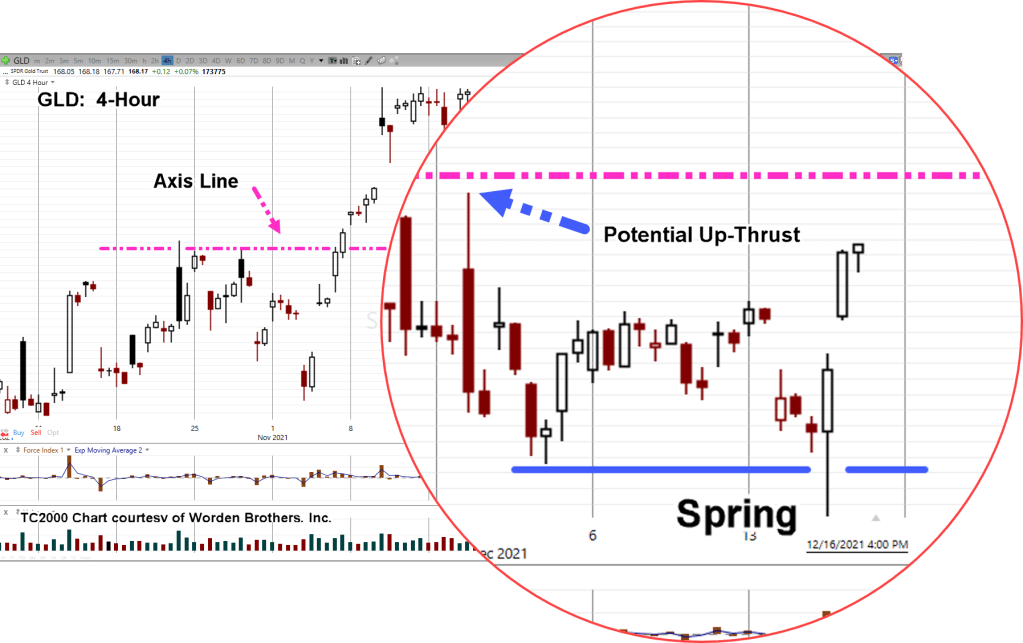
The marked-up chart makes it clear.

Moving in a little closer for additional clues:
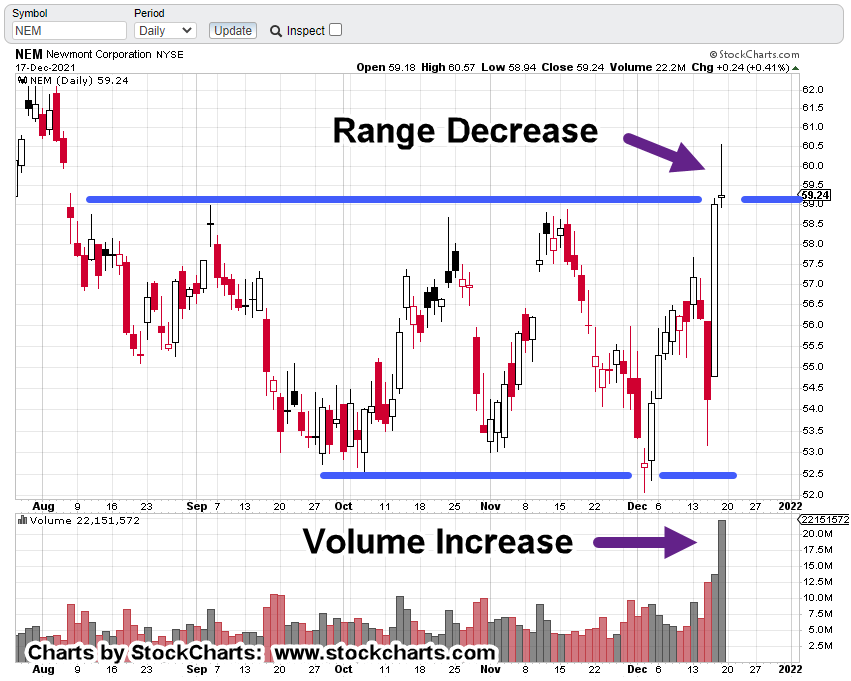
We can see from the volume itself, there were a huge number of transactions this past Friday.
NEM penetrated long established resistance.
In so doing, it set off a massive number of orders: Buy orders, sell orders, sell-short.
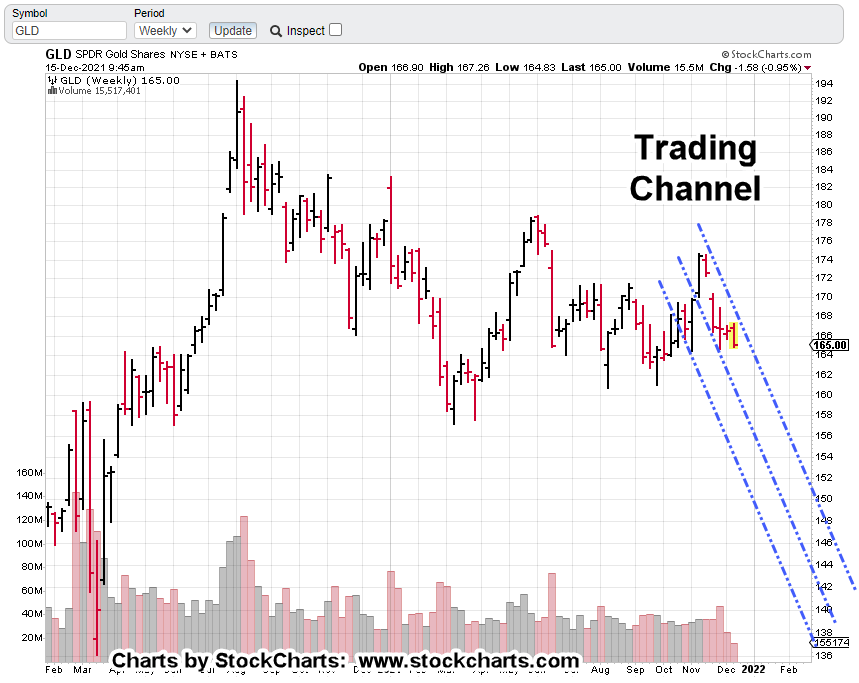
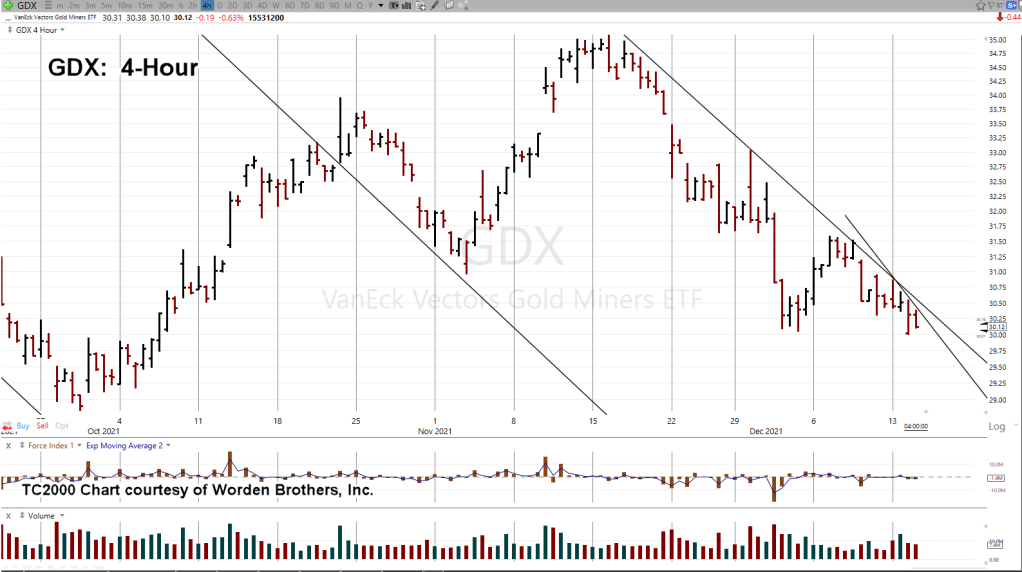
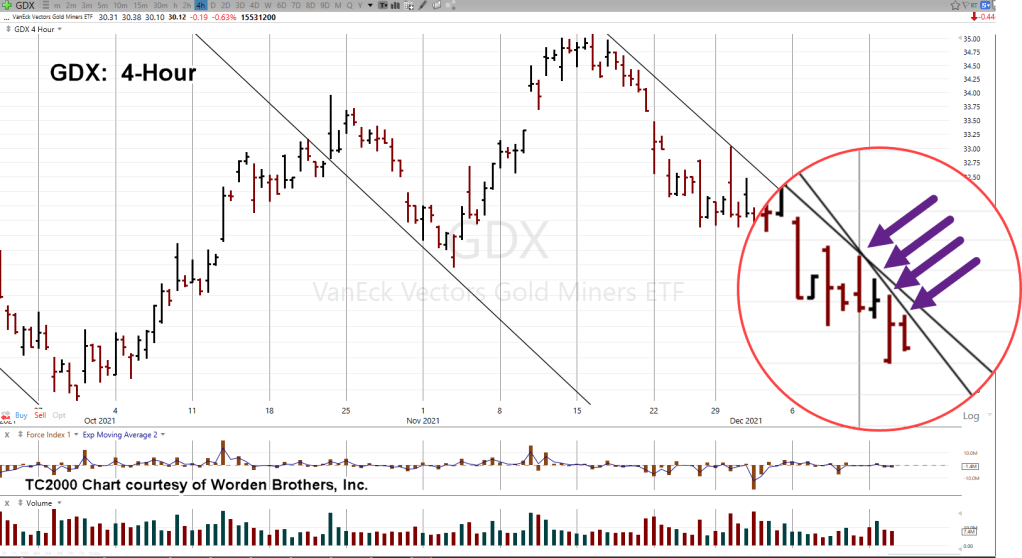
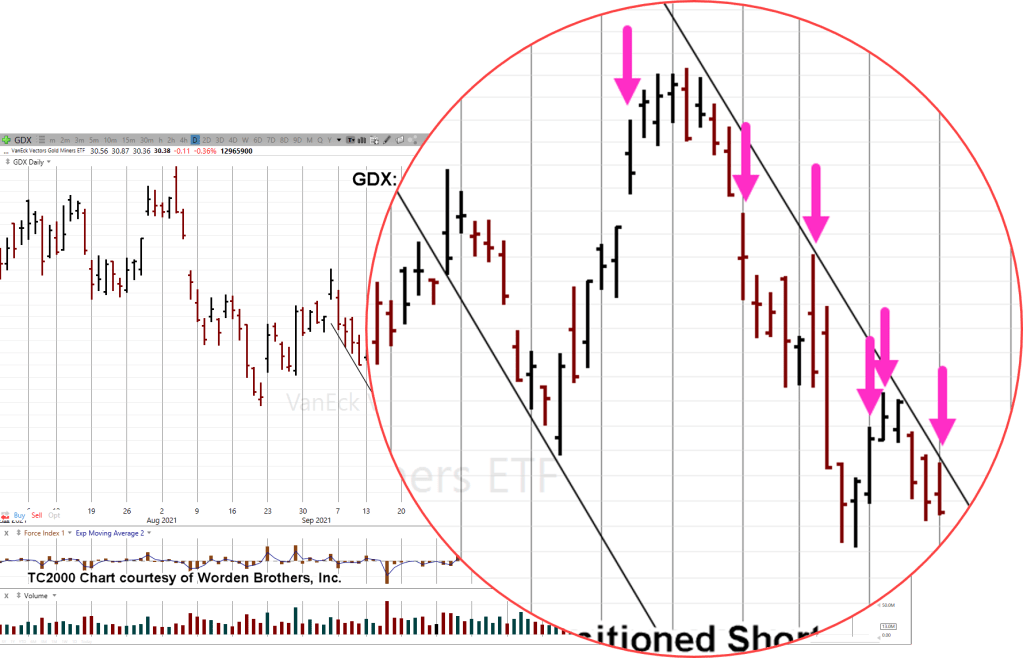
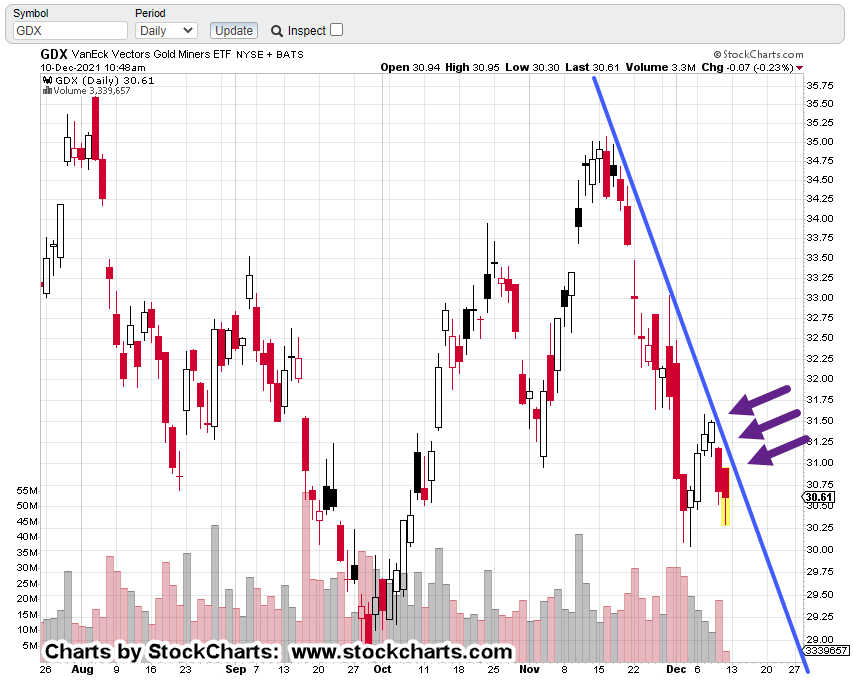
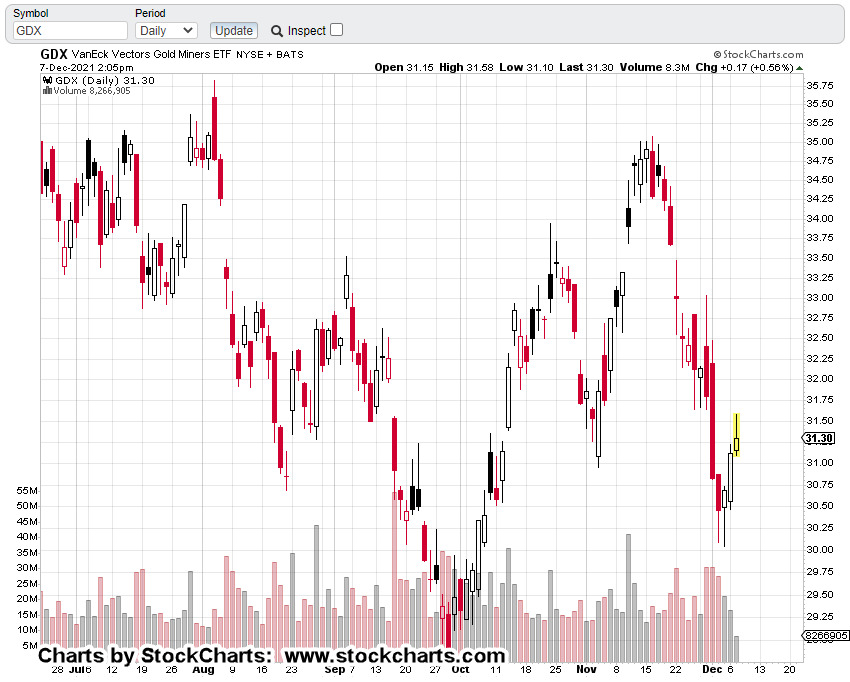
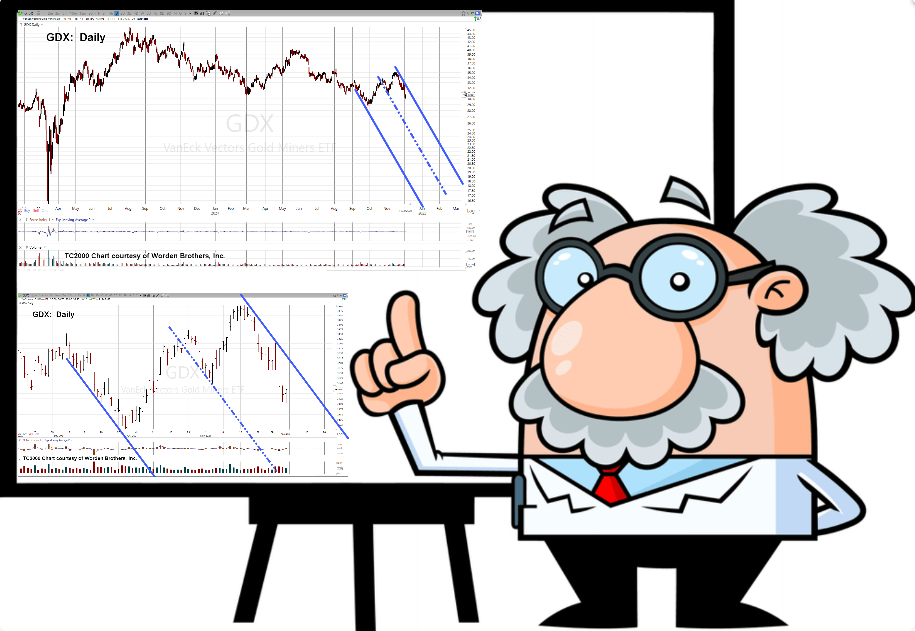
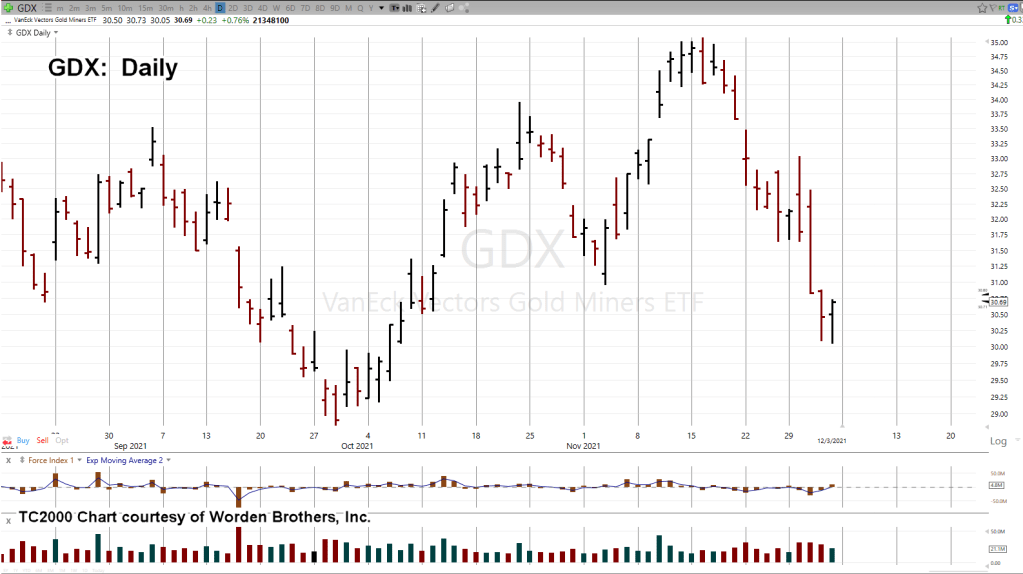
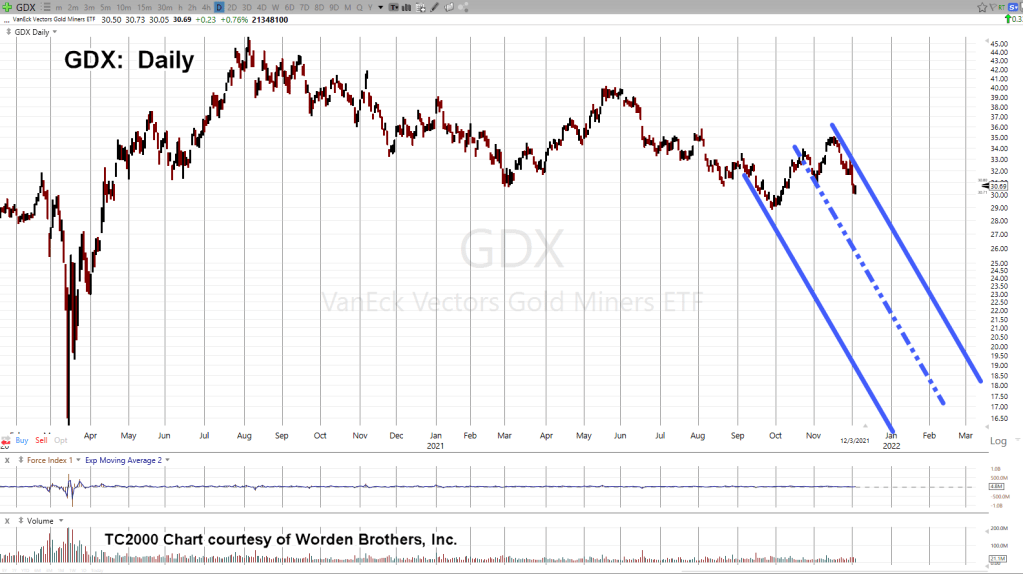
Senior Mining Index: GDX
The other part of the story and the one that weights it to the bears:
While NEM, is at multi-month highs, senior miners GDX, is nowhere near its highs.
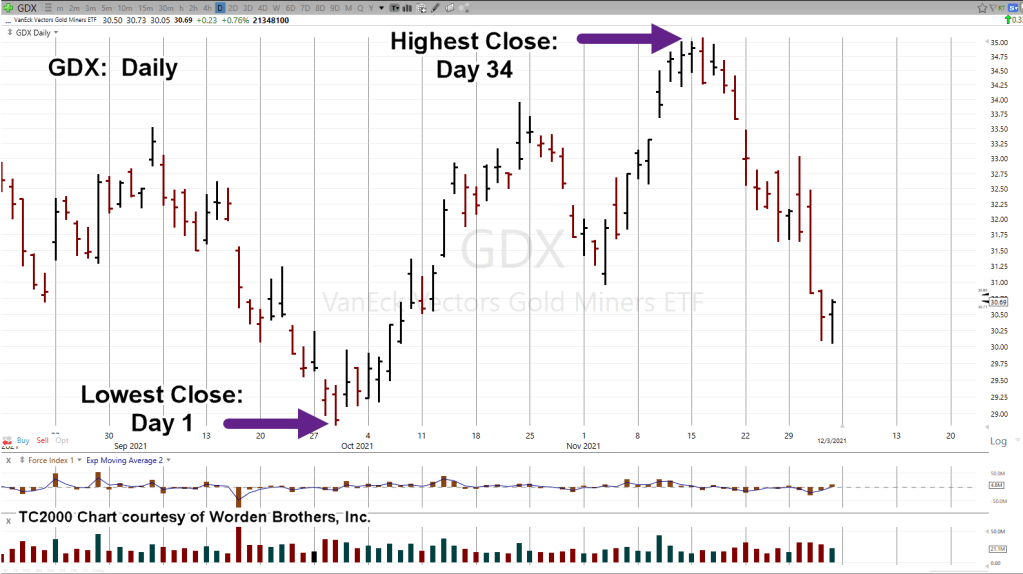
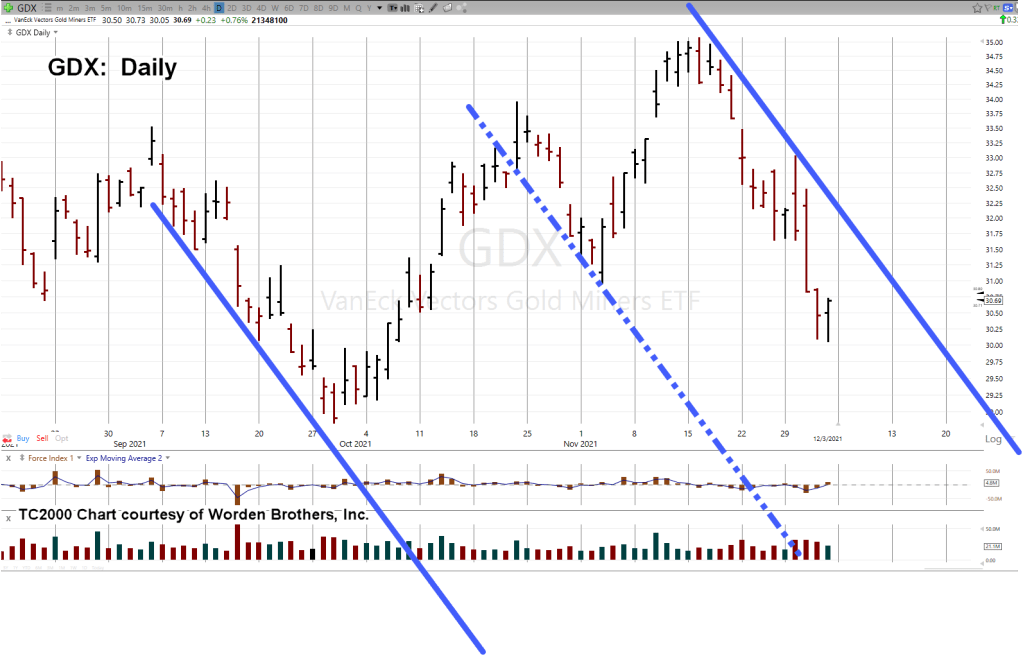
Daily chart, GDX:
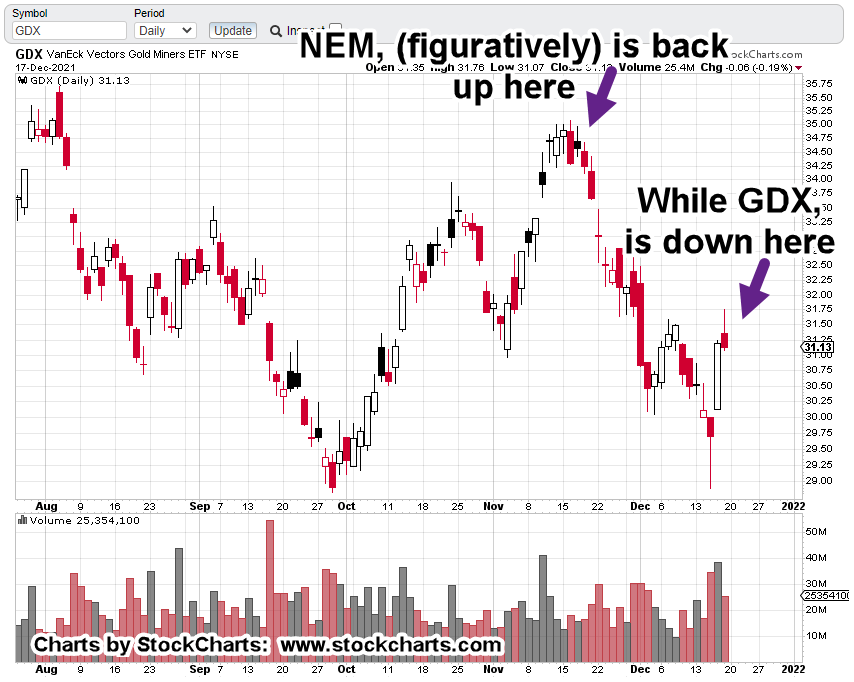
What does that mean?
It means the market is ‘thinning-out’
The professionals and maybe some investors alike, are abandoning the non-performing lesser cap equities; pouring funds into the last man standing NEM, in hopes that it will keep moving higher.
It’s desperation and signals market weakness.
As always, anything can happen and bulls may somehow take control.
However, from the charts themselves, hyper-stretched major indices coupled with insiders bailing out the most in history, uneducated ‘retail’ willingly stepping up to hold the bag, it does not look good for any bulls … gold or otherwise.
Summary:
We could find ourselves in a situation similar to the oil market in mid-2014 where it spontaneously deflated for eighteen months … nary a blip higher all the way down.
With that, we’re maintaining short via DUST (not advice, not a recommendation).
Stay Tuned
Charts by StockCharts
Note: Posts on this site are for education purposes only. They provide one firm’s insight on the markets. Not investment advice. See additional disclaimer here.
The Danger Point®, trade mark: No. 6,505,279