Set In Motion

Serious students of the markets discover quickly enough, price action has nothing to do with forecasts or fundamentals.
Once that mental hurdle is overcome, the market landscape takes on a whole new meaning.
Moving Parts, A-Plenty
At present, there’re a lot of moving parts but a few things are known: the on-going population collapse, the soon-to-be market and currency collapse (or severe de-basement), the possible ‘balkanization‘ of the U.S., just for starters.
Those wheels have already been set in motion.
Within that construct, are the market navigations (trading actions) presented on this site.
Biotech Has Spoken
At least for now, the bears are in control (not advice, not a recommendation).
The minor ‘spring’ set-up, materialized during Thursday’s session, just as this update said was likely.
It’s what happened next, that’s important.
On Friday, the set-up failed; showing the higher probability is for more downside.
Biotech SPBIO, Daily
Price action is posting lower.

The potential trading channel has been re-drawn with the grey lines; indicating the possibility for more aggressive downside action (not advice, not a recommendation).
Positioning
As can be inferred with these updates, I’ve already positioned short this sector via leveraged inverse fund LABD (not advice, not a recommendation).
The stop is Thursday’s high (SPBIO, 6,135.81) which corresponds to LABD 16.66 (interesting, that).
Stay Tuned
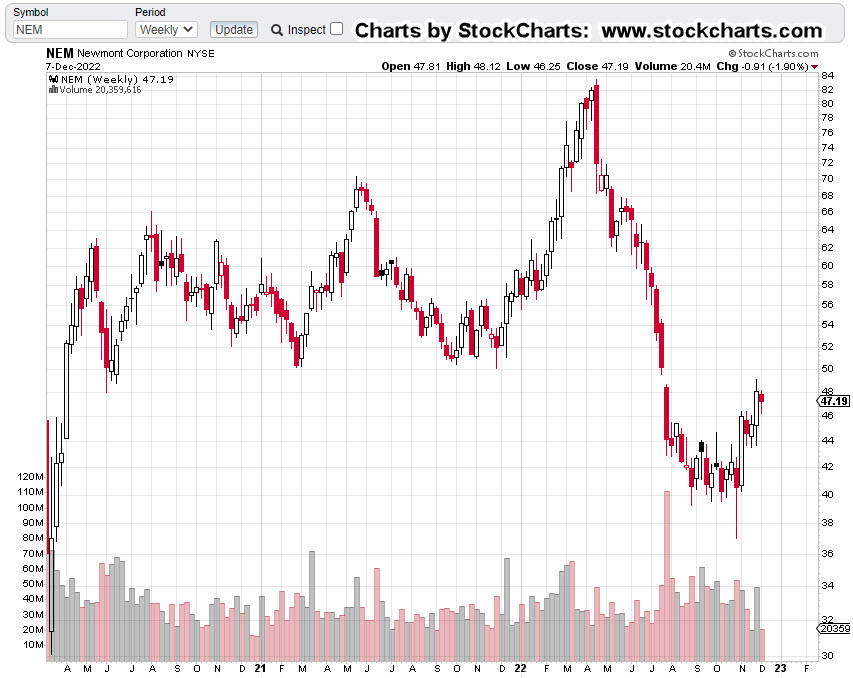
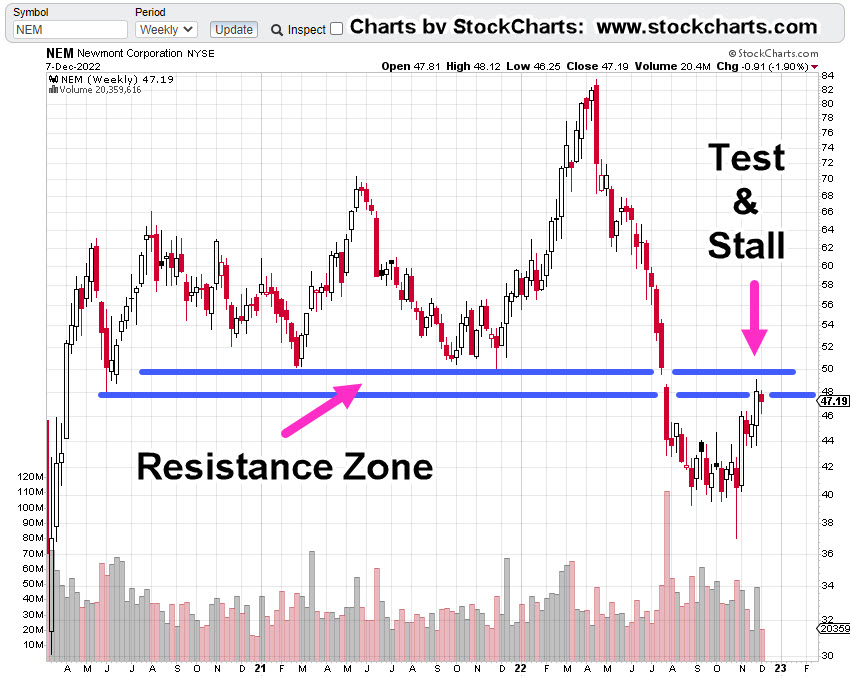
Charts by StockCharts
Note: Posts on this site are for education purposes only. They provide one firm’s insight on the markets. Not investment advice. See additional disclaimer here.
The Danger Point®, trade mark: No. 6,505,279