How To Trade ‘Kabuki’

You would think with all the handwringing, mental machinations, ‘debt ceiling’, we’re all going bankrupt, YouTube gold grifters et al, gold (GLD) would be in a monstrous rally.
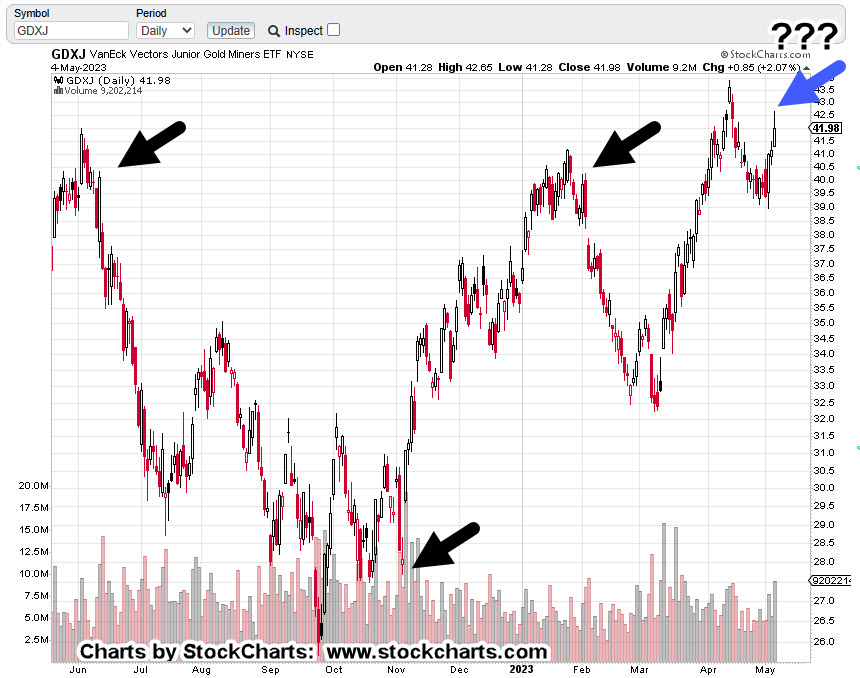
Instead, we have what appears to be exhaustion and non-confirmation.
Gold (GCM23), is the only monetary metal (gold, palladium, platinum, silver) anywhere near its all-time highs.
Old-timers would call it a huge non-confirmation. The other metals are not on board with the ‘inflation’ narrative.
Time and again, we’re back to actually reading price action and having it tell us what’s real, not the mainstream.
So, trading ‘kabuki’ seems to be straightforward; just read the chart. Here’s one explanation from an unlikely source on why that simple task is so difficult: absolute, total, unrelenting focus.
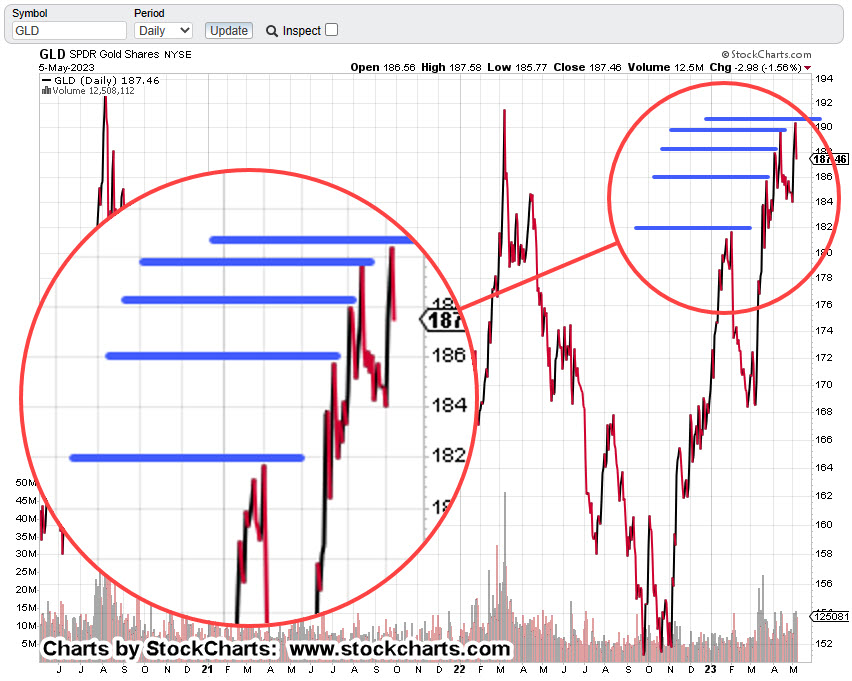
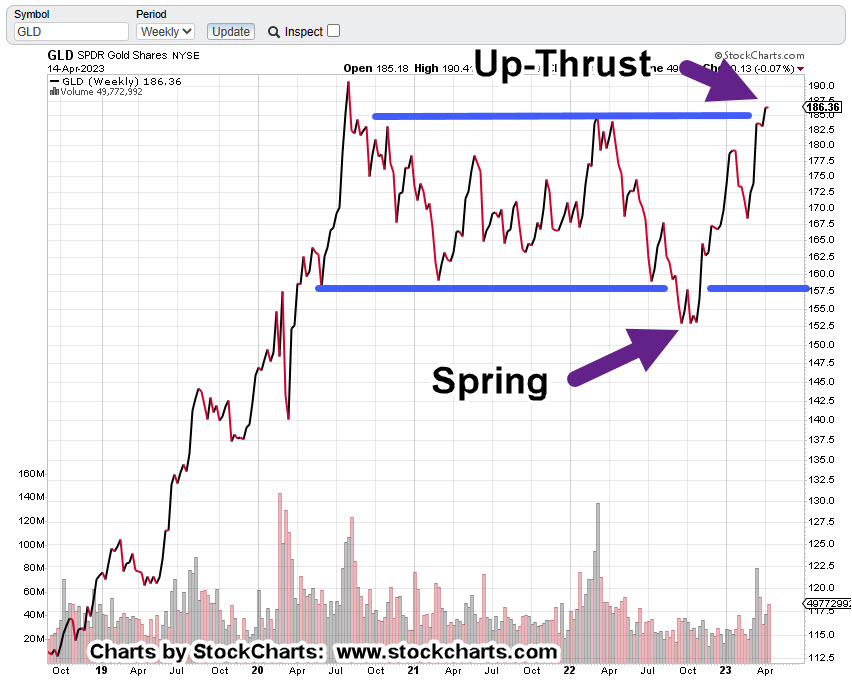
Gold (GLD), Daily
When we look at gold (as of 12:05 p.m. EST), from a technical standpoint, it’s in Wyckoff spring position; a set-up to move higher.
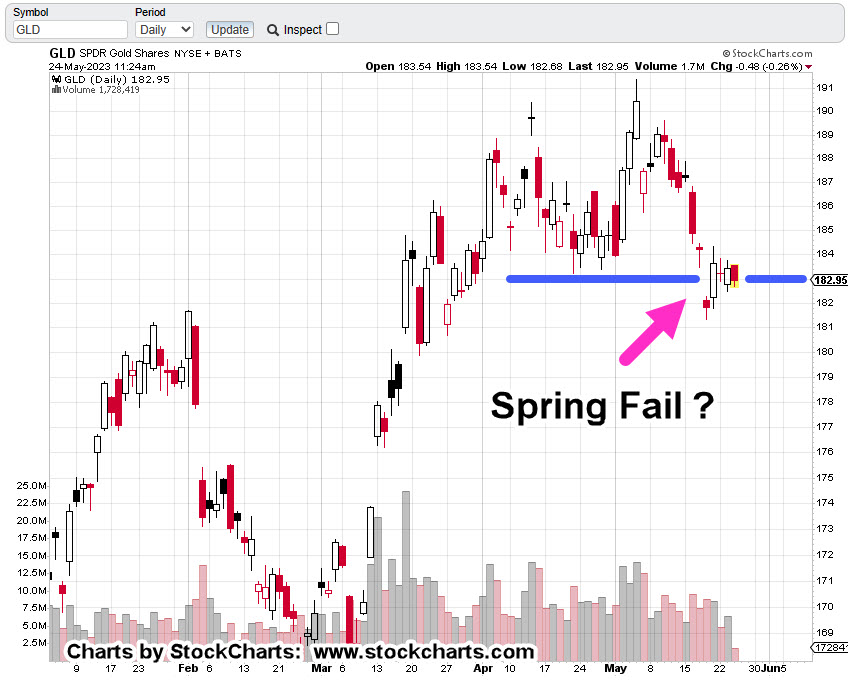
The difference in this set-up as opposed to the one on November 3rd, of 2022 (not shown), price action’s ‘hugging the lows’ as David Weis used to call it.
We’re not springing higher.
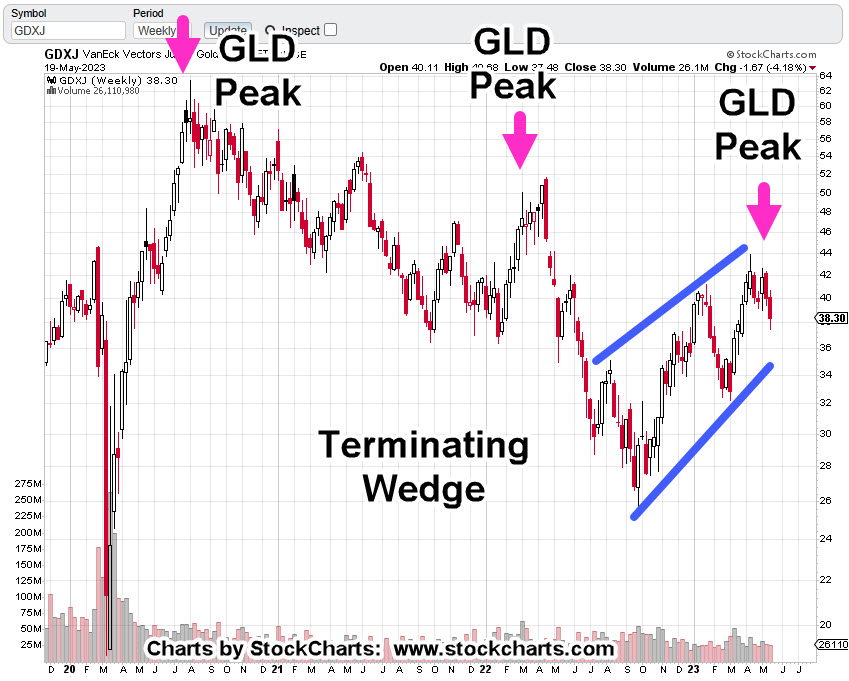
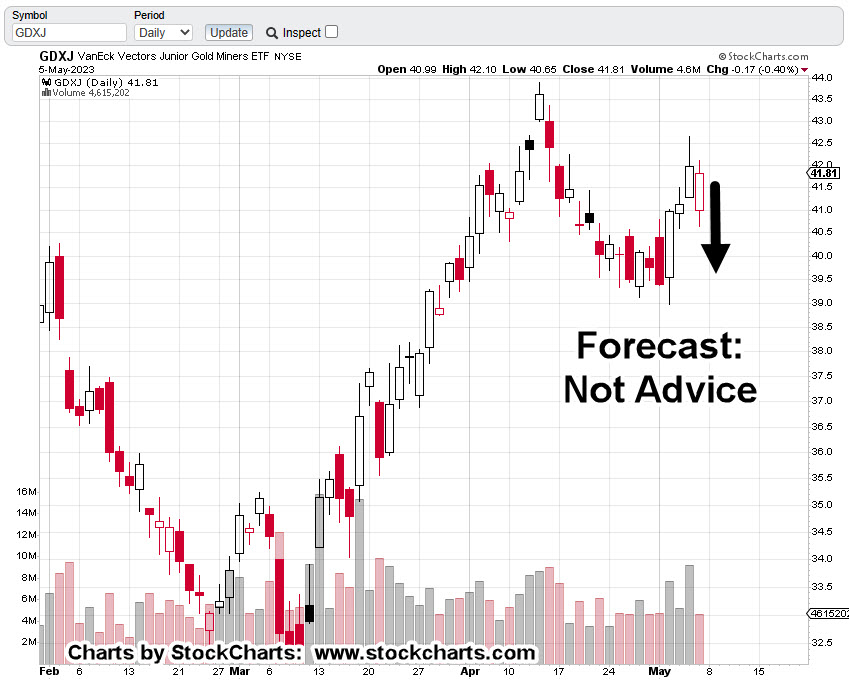
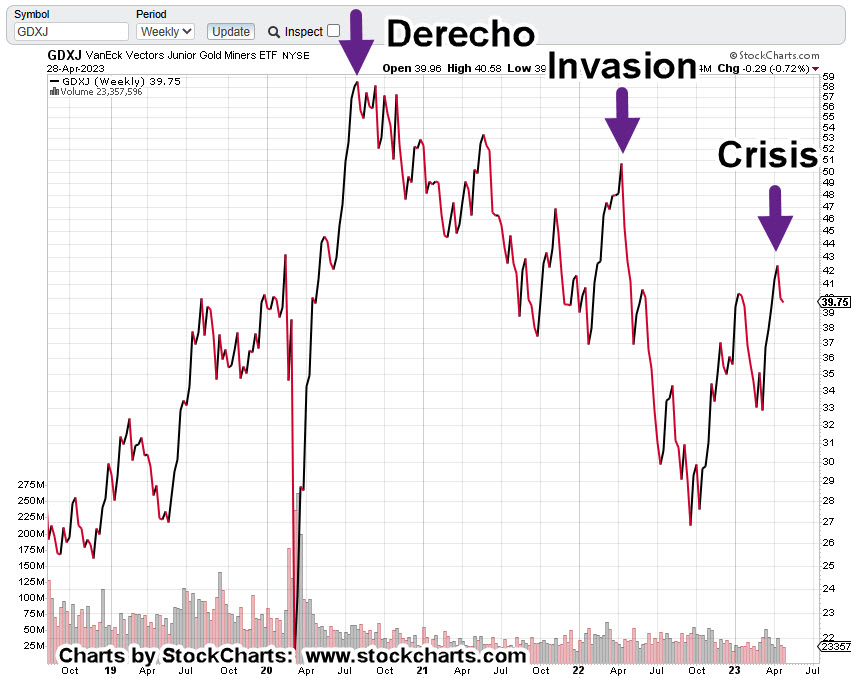
The miners on the other hand (GDX, GDXJ) have already made their decision, moving decisively lower during this session (not advice, not a recommendation).
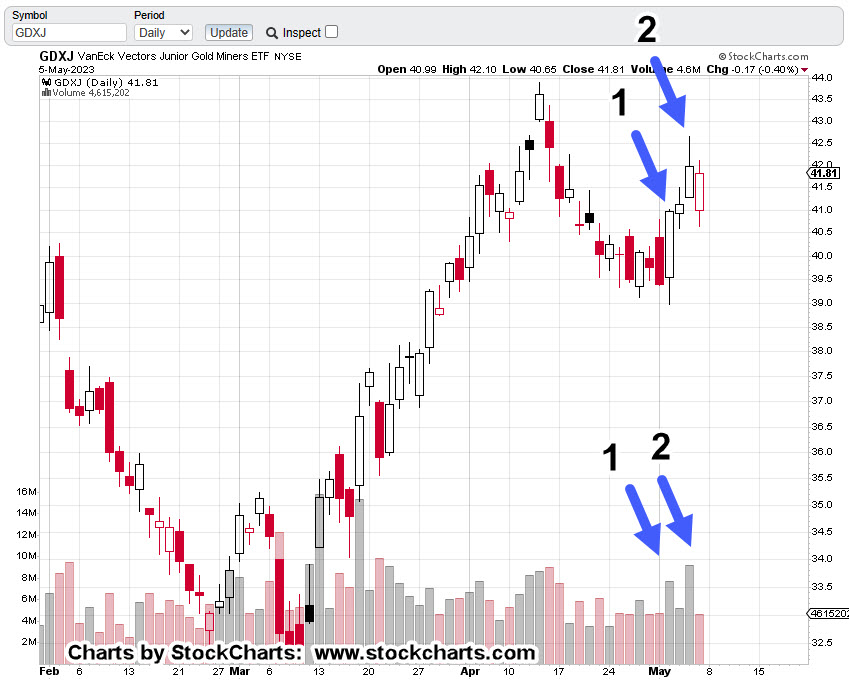
Junior Miners GDXJ, Daily
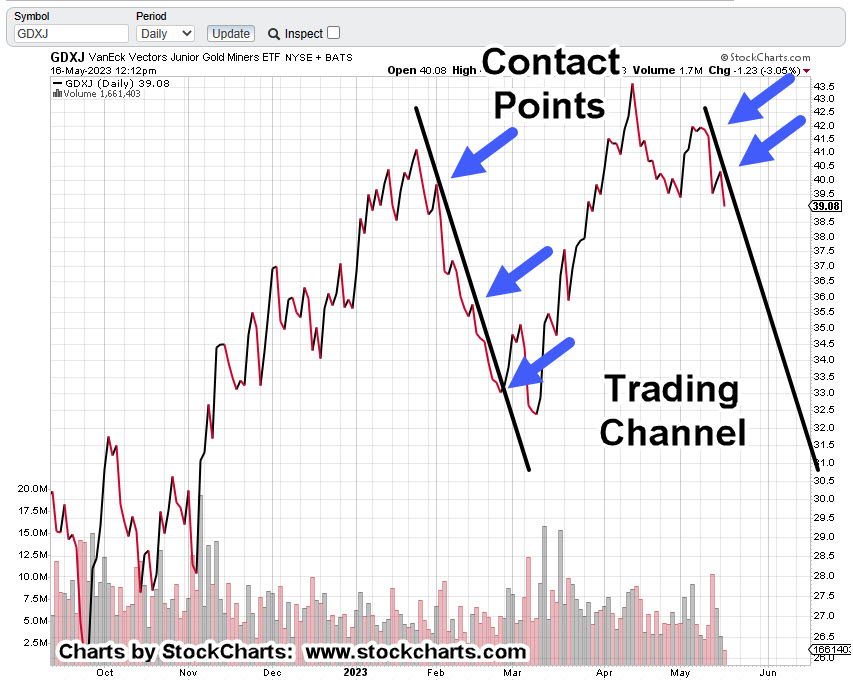
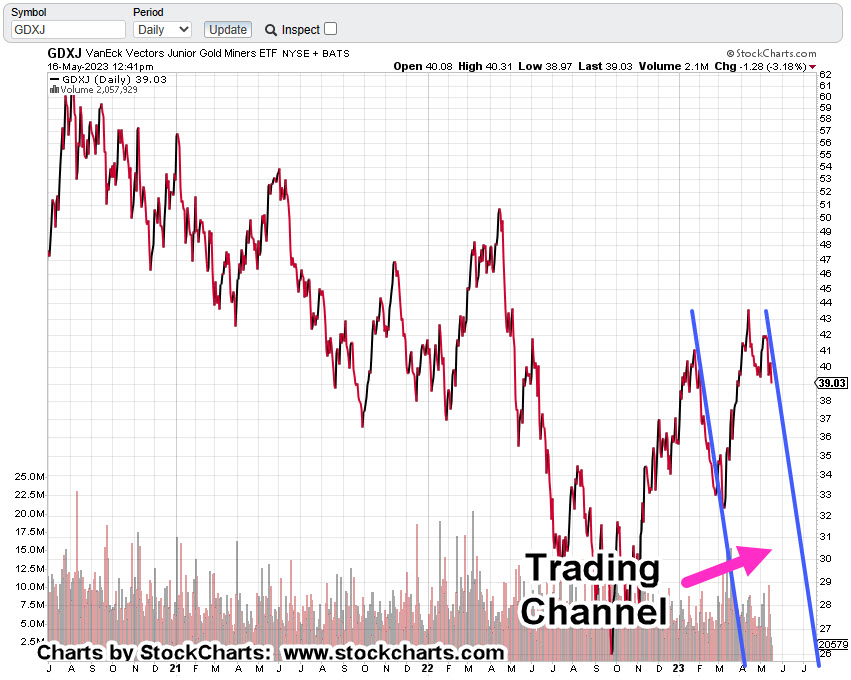
The chart below has two locations identified.
The first is this post identifying GDXJ, as a potential short opportunity.
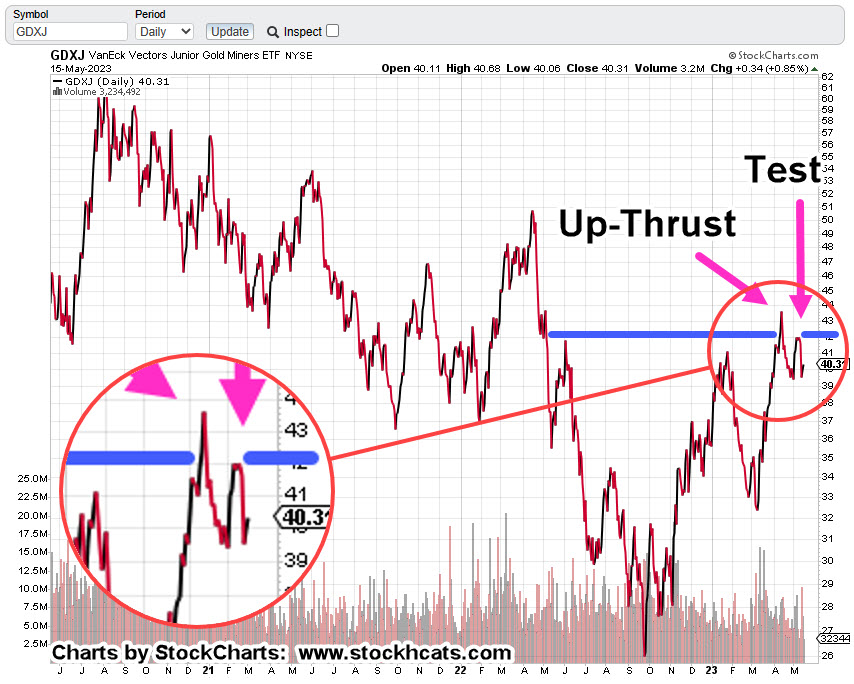
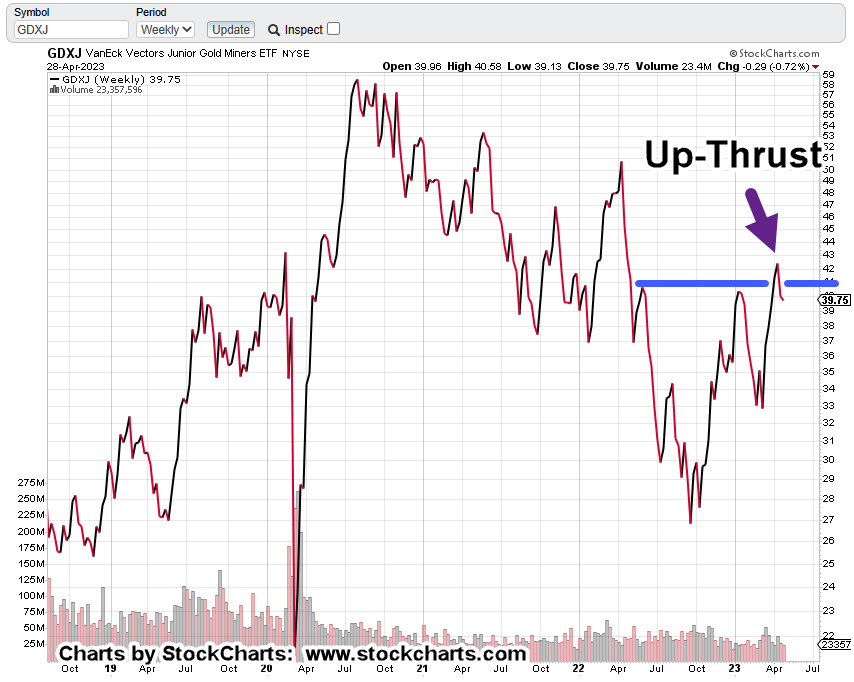
The second is this post identifying the ‘test, reverse’ of the up-thrust with high probability of more downside (not advice, not a recommendation).
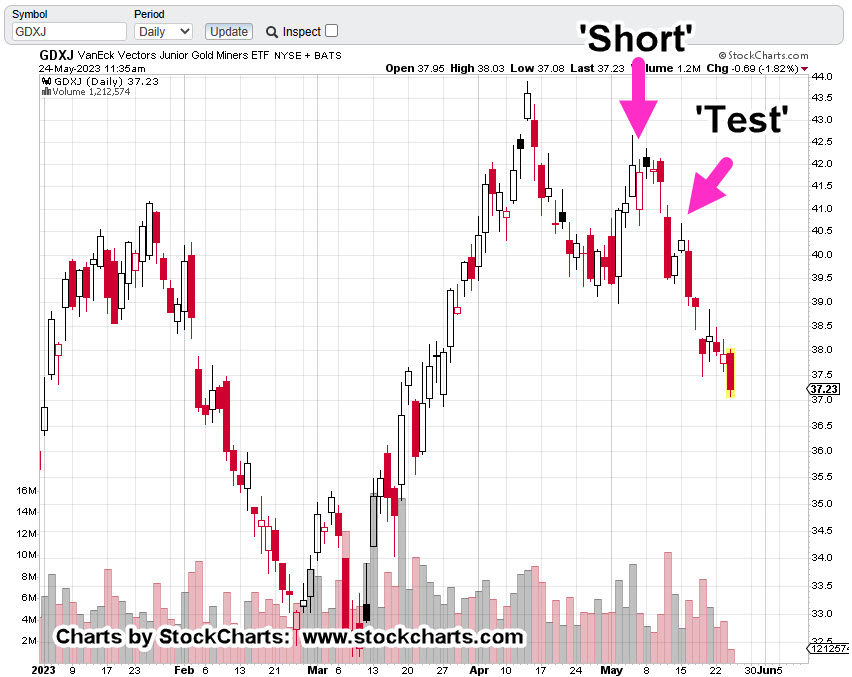
We can see the result.
Even though gold (GLD) had declined modestly with silver (SLV) more-so, the mining sector appears to be responding dramatically to the downside.
This ‘elevated metals, miners collapsing’ potential has been discussed previously.
Now, it appears that strategy is coming into play (not advice, not a recommendation).
Stay Tuned
Charts by StockCharts
Note: Posts on this site are for education purposes only. They provide one firm’s insight on the markets. Not investment advice. See additional disclaimer here.
The Danger Point®, trade mark: No. 6,505,279