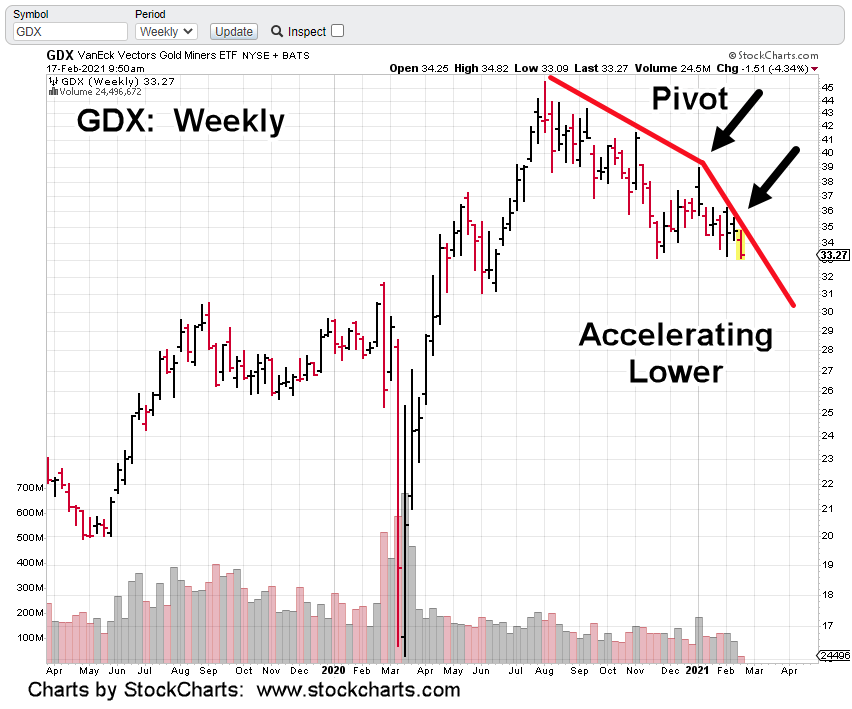
With GDX posting a new weekly low (below 33.23) early this session, it’s helping to confirm a pivot and acceleration to the downside.
Bullish or bearish, it’s a crowded trade that we’re avoiding (not advice, not a recommendation).
It took over a week of oscillating price action before GDX decided to post below the February 4th, low.
Even so, when an established low is penetrated, it puts the market in “Wyckoff Spring Position’.
That means there’ll (potentially) be some type of rally or rally attempt. If that happens, it’s just more oscillations that result in erosion of leveraged inverse funds.
Other areas of the market are performing better on the downside. Real estate IYR, looks like it may post a narrow range day (as of mid-session).
It’s typical action when at support. If there’s no break lower today, then IYR could make an attempt higher at the next session.
Based on previous analysis, that attempt (if it occurs) is expected to be short lived.
Note: Posts on this site are for education purposes only. They provide one firm’s insight on the markets. Not investment advice. See additional disclaimer here.
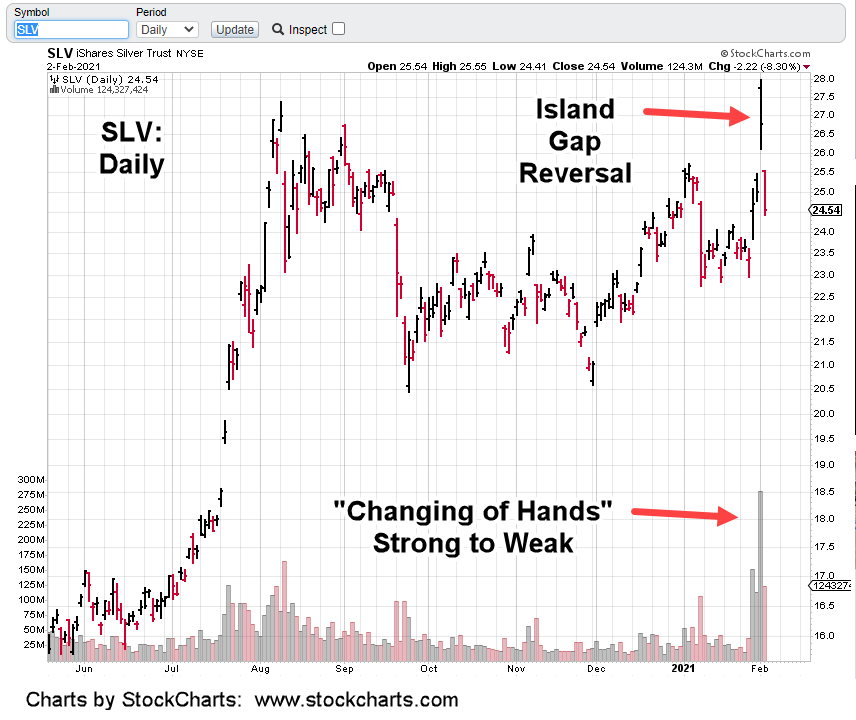
The silver hype couldn’t even last for a single day.
Price opened gap-higher on Monday and then steadily eroded to close lower; posting a reversal bar on massive volume.
The next day, yesterday, the trap is shut. Island gap reversal.
Way back in Livermore’s time, in his (fictionalized) biography, he says the big players can’t get in and out whenever they want.
Their positions are so large, entering and exiting would cause huge moves in the market. They need to have an “event” with massive volume so as to hide their actions (entering or exiting).
The pre-market update on Monday proposed the whole kabuki theater with GME, then SLV could have just been a ruse for big players to establish massive SLV (or futures) short positions; or just plain exit out entirely.
That idea doesn’t sound so far fetched now.
We’ll have to see if it’s true at the next commitment of trader’s report.
Either way, it’s not really important to dive into the minutiae. We can just look at the chart.
As Prechter likes to call it, massive volume signifies a “changing of hands”. Most likely from strong to weak (i.e. from professional to retail).
The significance probably invisible to the public, this may be the inflection point.
Now that SLV’s at a potential long term pivot, we could be at the cusp of a deflation impulse.
Commodities (like oil) along with real estate, one of the most illiquid of all markets, get crushed in a downturn.
Note: Posts on this site are for education purposes only. They provide one firm’s insight on the markets. Not investment advice. See additional disclaimer here.
Is anyone looking at the technical condition? No, it’s all about ‘putting it to the man’.
In all of Wyckoff’s writings, he never once proposed the idea of taking the large controlling entities for a ride.
He was totally immersed in figuring out what those entities were trying to accomplish; then getting on the right side of the trade.
For all we know, the whole hedge fund blow-up, kabuki theater could have just been a sacrificial lamb (an inside job) targeting silver for a massive short opportunity.
How’s that for strategic thinking.
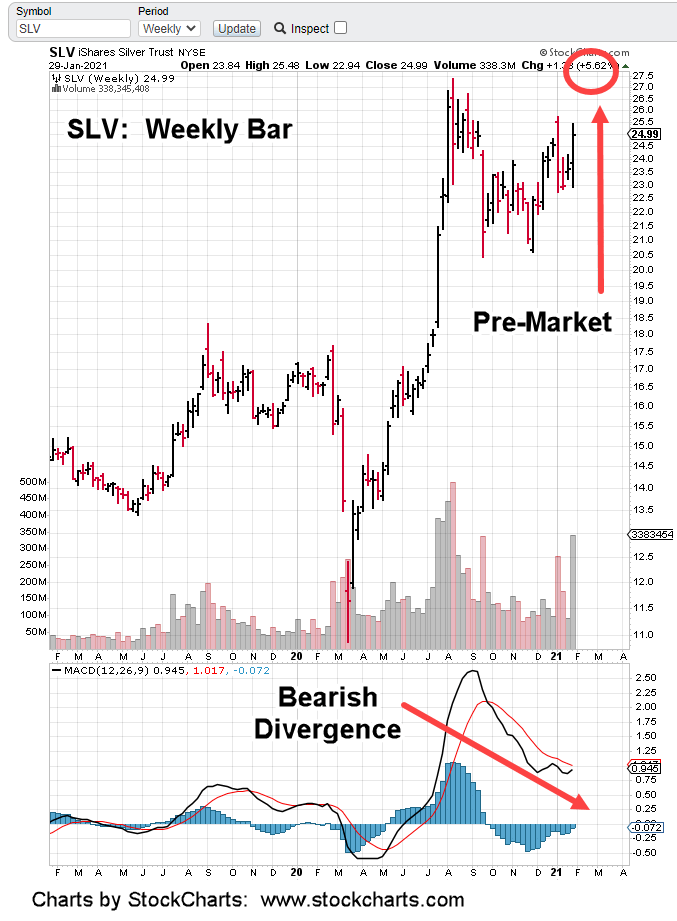
Right now, in the pre-market, SLV is right at new recovery highs.
The real question should be, ‘how long can the hype last?’
Can it finish the week at new highs and post a bearish divergence on the weekly MACD?
Price action itself will decide. What we do have, is risk being removed on the short side.
Inverse fund ZSL is down a stiff -21%. If there is a short, that’s the one to watch (not advice, not a recommendation).
It’s important to note, GLD is nowhere near a +10% move. It’s a non-confirmation on silver.
Separately, the overall markets are trading higher but appear to be under their prior session (daily) highs … indicating a short position in those markets is still viable.
Note: Posts on this site are for education purposes only. They provide one firm’s insight on the markets. Not investment advice. See additional disclaimer here.
There’s a lot going on in the senior mining index, GDX. Price action penetrated support yesterday and set up a spring (reversal) condition.
Today’s action is gap-up open with a test of the support level happening now (10:44 a.m. EST).
The chart shows the down-trend line and contact points.
The magenta, dashed arrow is the location of the initial short position (not advice, not a recommendation) via the inverse fund DUST.
As price action was rising into the morning session (with DUST declining), the short position was increased by about 14%. That area is shown as the orange dashed arrow.
We are looking for the spring action to fail and downtrend to resume.
If GDX closes lower for the day, we’ll move the DUST stop (not advice, not a recommendation) up to its session low; currently at 20.44.
Note: Posts on this site are for education purposes only. They provide one firm’s insight on the markets. Not investment advice. See additional disclaimer here.
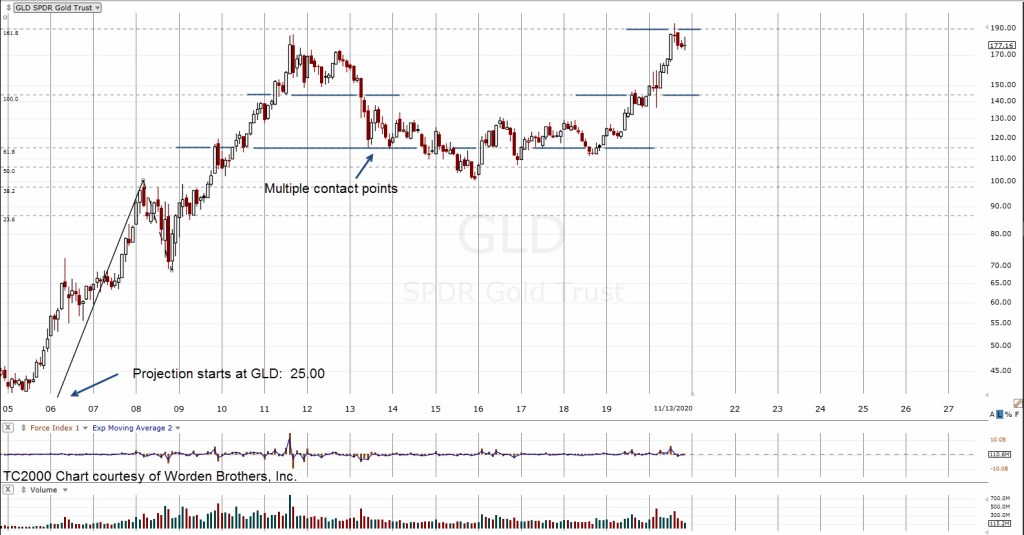
Using that knowledge, we can create a Fibonacci projection tool for the chart of GLD.
The GLD data on the chart does not go back that far. So, we have to improvise.
Taking the Fib projection tool down to the 24 – 25 area of the chart and then identifying a major top of the move during the financial crisis of 2007 – 2008, gives us the chart shown below.
Note the multiple price action contact points on the 61.8 projection. This area is an axis line. The market oscillated around this area for nearly 10-years, before heading on to new all-time highs.
The axis lines and reversal points on the chart provide confirmation we have selected the price action waves correctly.
Using the same 25-area on GLD, we’re gong to remove the projection tool and use the retrace tool and then zoom in using the weekly chart.
That chart is below:
There is a lot going on with this chart. Note the wide, high-volume bar. Volume for that week was about double from the week prior.
Markets tend to go back to these areas for a test.
That area also represents a Fibonacci 38.2% retrace of the entire move off the February 2001, lows.
On top of that, a retrace to GLD 130, is a near exact -33% from the highs.
If that weren’t enough, price action getting to that level would automatically set-up a Wyckoff spring (reversal) condition by penetrating the support area shown.
Will this all happen? Obviously it’s unknown at this point. However, it does give us context.
As always, price action is the final arbiter. We’re short on the GDX, the Major Miners via DUST (not advice, not a recommendation). Our original stop was probably too tight at just 0.41 points from entry.
We’ll see how it works out. Certainly, we are at another danger point.
Stay Tuned
Note: Posts on this site are for education purposes only. They provide one firm’s insight on the markets. Not investment advice. See additional disclaimer here.
Deflationary impulse is a term that is used to describe the potential decline in gold and silver prices.
If that’s what’s coming, it looks like it’s already started.
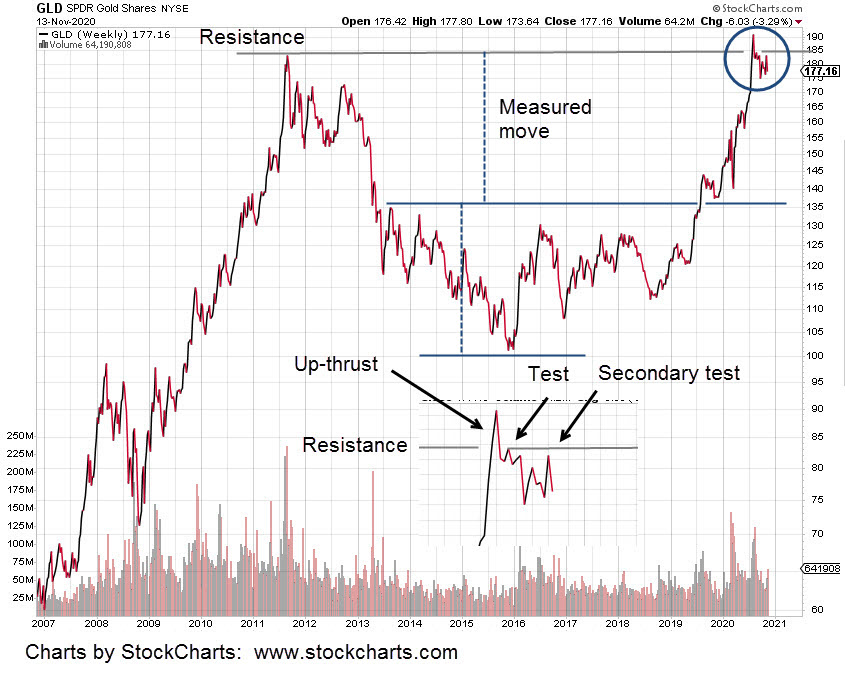
The weekly chart of GLD below, shows the long-term action in the sector.
We have a trading range that formed during 2013 – 2019. That range gave a projected ‘measured move’, to the 185-area for GLD.
The target has been met. The bullish trade is over and now something else is being created.
That something from the circled area shown, expanded at the bottom of the chart, appears to be a reversal (Wyckoff up-thrust) condition.
The up-thrust was tested early in the reversal (first arrow) and this past week looks like a secondary test. Secondary tests do happen. Not too often but its acceptable market behavior.
In the updates here and here, the overnight futures price action was used to determine this past Friday, 13th, was a 38% retrace of the most recent down move; indicating weakness.
Anything can happen. GLD could open higher on Monday and somehow power its way through the down-trend line shown in Friday’s update.
However, probabilities based on the combined analysis point to continued downside action.
If we get a decline, how far would it go?
Price action permitting, we’ll cover downside targets in the Monday pre-market update.
Note: Posts on this site are for education purposes only. They provide one firm’s insight on the markets. Not investment advice. See additional disclaimer here.
Gold is set to open higher as expected. Corn is set to open lower … not expected and nat-gas looks like it will test its trend-line.
The only position currently open is CORN.
Lower CORN open in the works, crop report due at the upcoming close and price action hugging the lows. We’re at the danger point three days in a row; planning to exit CORN (not a recommendation, not advice).
Taking the markets on the watch list into account, the opportunity appears to be nat-gas, UNG.
If price action contacts the trend-line and begins to pull away, there is a potential confirmation and trade set-up.
Note: Posts on this site are for education purposes only. They provide one firm’s insight on the markets. Not investment advice. See additional disclaimer here.
Gold (GLD) may rise slightly into the election … then pivot down.
If gold and silver are the safe havens, why have they not moved higher as the overall market has declined?
Years ago, literally decades ago, Robert Prechter proposed ‘it’s all the same market’. Meaning, everything is connected and nothing moves independent.
Sufficient evidence has been proposed on this site, that potential exists for deflation first, then inflation.
Continuing on with Prechter, he states that any significant directional move (major reversal) won’t happen until nearly every market participant is on the wrong side of the trade.
It’s easy to see who is on the (potential) wrong side of the trade for gold and silver. Just one glance at YouTube reveals hoards, buying into the hyperinflation argument.
Sometimes the hoard is correct … but not very often.
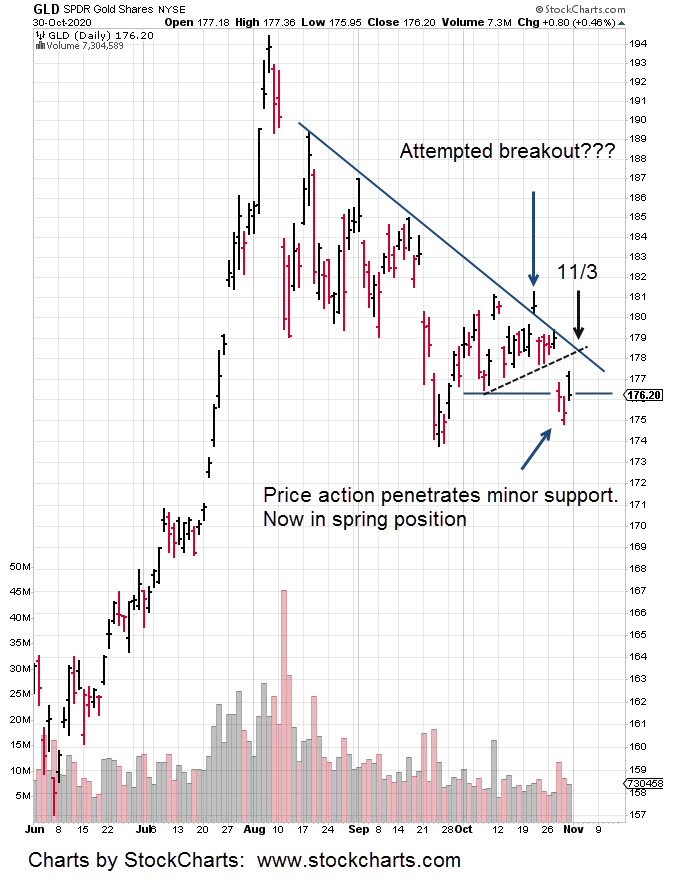
Getting back to gold and GLD. An expandable version of the chart is here.
Price action penetrated minor support and generated a Wyckoff spring condition.
This past Friday’s action opened gap-higher and declined to test the support level.
The expectation is for higher action into the election.
How price behaves at the trend-lines shown (if and when contact is made) will indicate whether or not it’s in position to reverse lower or head higher to the 180 – 181, area.
Price action itself decides the next likely course.
Should there be a reversal, there are numerous ways to position (not a recommendation, not advice) for a decline. Inverse funds DUST, JDST, and ZSL are just a few vehicles available.
Note: Posts on this site are for education purposes only. They provide one firm’s insight on the markets. Not investment advice. See additional disclaimer here.
The JDST trade, discussed over the past several weeks has been closed as of today.
Price action in the Junior Mining Index, GDXJ, declined sharply during the day but failed to decisively penetrate support at the 52.00 area.
Combined entry price for three separate JDST entries (9.98, 10.38, 10.58) was 10.19. Exit price was 12.09.
Since the short trade was executed with the leveraged inverse fund JDST, we’re not going to wait around to see what happens next.
Inverse funds have a habit of ‘blowing up’ as happed with this exact fund just a few months ago.
These vehicles are absolutely not for the novice and even the experienced pro can get impaled on them every now and then.
In fact, the last substantial trade in JDST was closed out on March 12th, 2020. That exit was just two days before the fund had its monster disconnect. Enough said.
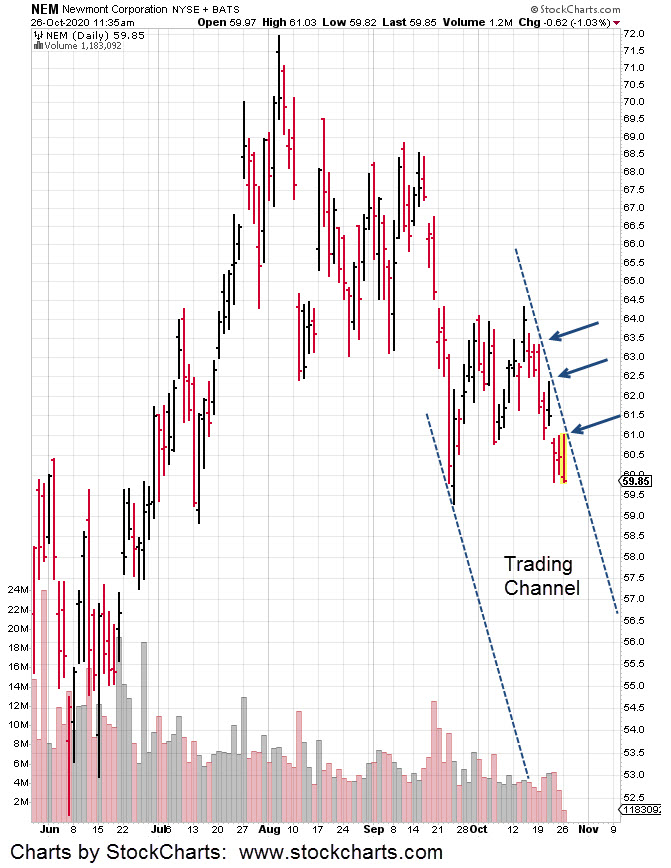
On a separate note; because of the price action and position of NEM, it’s now in Wyckoff spring position. It thus has the potential to move higher from here.
Note: Posts on this site are for education purposes only. They provide one firm’s insight on the markets. Not investment advice. See additional disclaimer here.
Note: Posts on this site are for education purposes only. They provide one firm’s insight on the markets. Not investment advice. See additional disclaimer here.