Gold is set to open higher as expected. Corn is set to open lower … not expected and nat-gas looks like it will test its trend-line.
The only position currently open is CORN.
Lower CORN open in the works, crop report due at the upcoming close and price action hugging the lows. We’re at the danger point three days in a row; planning to exit CORN (not a recommendation, not advice).
Taking the markets on the watch list into account, the opportunity appears to be nat-gas, UNG.
If price action contacts the trend-line and begins to pull away, there is a potential confirmation and trade set-up.
Note: Posts on this site are for education purposes only. They provide one firm’s insight on the markets. Not investment advice. See additional disclaimer here.
Gold (GLD) may rise slightly into the election … then pivot down.
If gold and silver are the safe havens, why have they not moved higher as the overall market has declined?
Years ago, literally decades ago, Robert Prechter proposed ‘it’s all the same market’. Meaning, everything is connected and nothing moves independent.
Sufficient evidence has been proposed on this site, that potential exists for deflation first, then inflation.
Continuing on with Prechter, he states that any significant directional move (major reversal) won’t happen until nearly every market participant is on the wrong side of the trade.
It’s easy to see who is on the (potential) wrong side of the trade for gold and silver. Just one glance at YouTube reveals hoards, buying into the hyperinflation argument.
Sometimes the hoard is correct … but not very often.
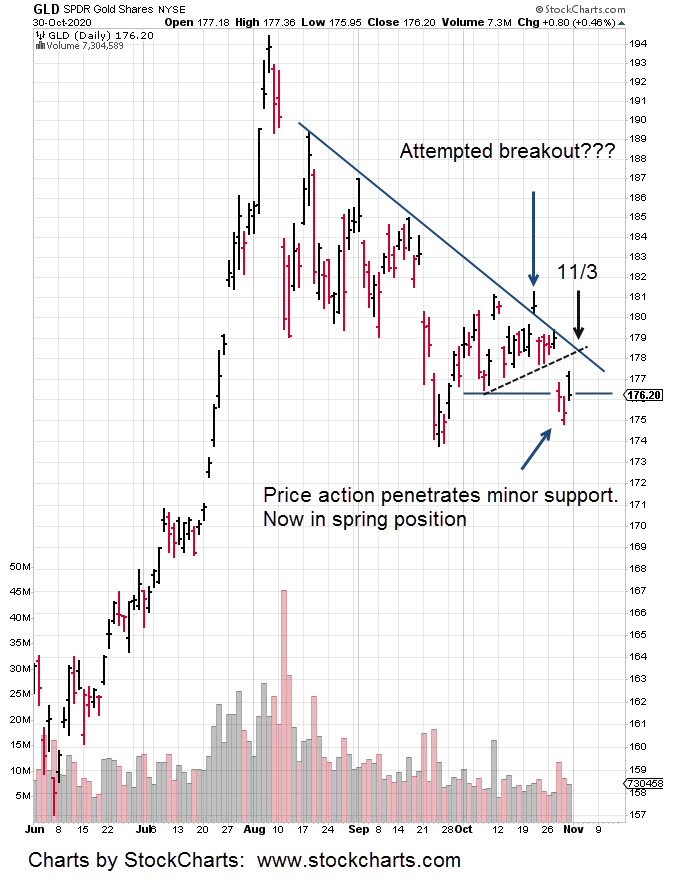
Getting back to gold and GLD. An expandable version of the chart is here.
Price action penetrated minor support and generated a Wyckoff spring condition.
This past Friday’s action opened gap-higher and declined to test the support level.
The expectation is for higher action into the election.
How price behaves at the trend-lines shown (if and when contact is made) will indicate whether or not it’s in position to reverse lower or head higher to the 180 – 181, area.
Price action itself decides the next likely course.
Should there be a reversal, there are numerous ways to position (not a recommendation, not advice) for a decline. Inverse funds DUST, JDST, and ZSL are just a few vehicles available.
Note: Posts on this site are for education purposes only. They provide one firm’s insight on the markets. Not investment advice. See additional disclaimer here.
The JDST trade, discussed over the past several weeks has been closed as of today.
Price action in the Junior Mining Index, GDXJ, declined sharply during the day but failed to decisively penetrate support at the 52.00 area.
Combined entry price for three separate JDST entries (9.98, 10.38, 10.58) was 10.19. Exit price was 12.09.
Since the short trade was executed with the leveraged inverse fund JDST, we’re not going to wait around to see what happens next.
Inverse funds have a habit of ‘blowing up’ as happed with this exact fund just a few months ago.
These vehicles are absolutely not for the novice and even the experienced pro can get impaled on them every now and then.
In fact, the last substantial trade in JDST was closed out on March 12th, 2020. That exit was just two days before the fund had its monster disconnect. Enough said.
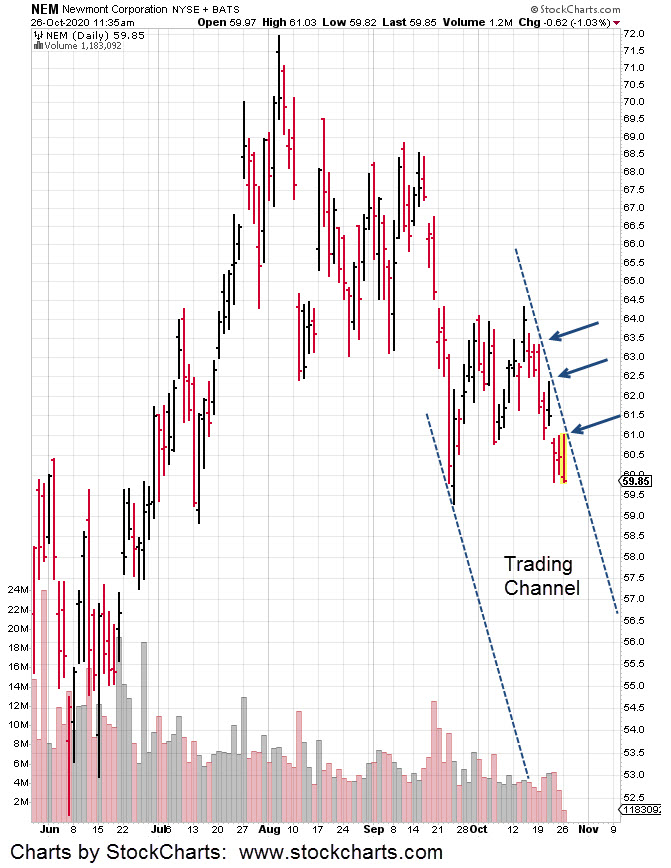
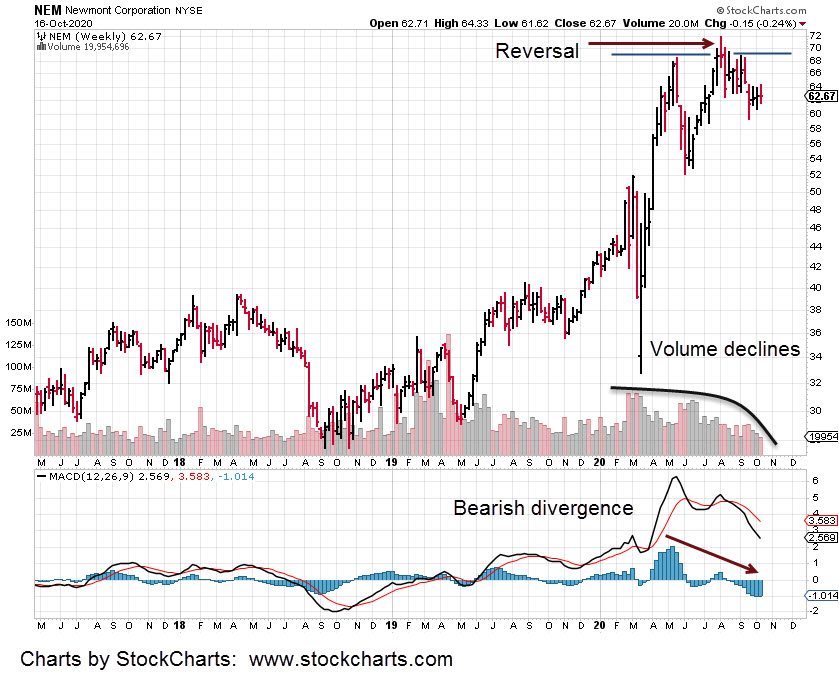
On a separate note; because of the price action and position of NEM, it’s now in Wyckoff spring position. It thus has the potential to move higher from here.
Note: Posts on this site are for education purposes only. They provide one firm’s insight on the markets. Not investment advice. See additional disclaimer here.
Note: Posts on this site are for education purposes only. They provide one firm’s insight on the markets. Not investment advice. See additional disclaimer here.
Note: Posts on this site are for education purposes only. They provide one firm’s insight on the markets. Not investment advice. See additional disclaimer here.
The entire precious metals sector may be about to take an unexpected hit.
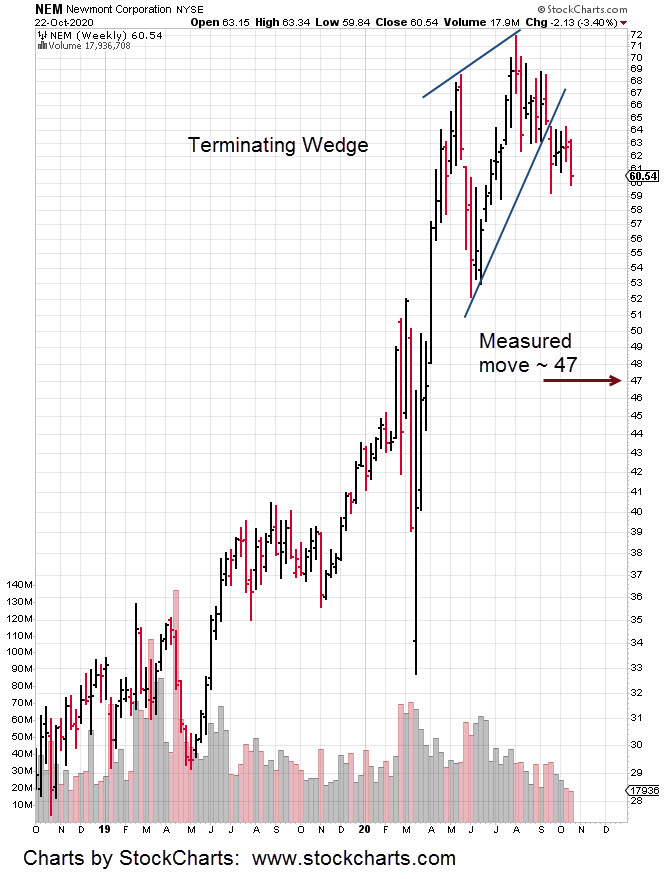
Prior updates have discussed the Newmont (NEM) bearish divergence and reversal. This update shows a rising wedge breakout to the downside.
Using standard analysis techniques on the chart below, we get a measured move to the vicinity of 47 for NEM.
A decline of that magnitude, a drop of over 22%, may be the catalyst for a whole other bearish scenario.
Just based on empirical observation and analysis generally available (YouTube, et al), it’s pretty safe to say that no-one is prepared for a significant decline.
Well, almost no-one. As reported back in late September, the only YouTube analyst (that was located) proposing the idea of a decline was Sajad, in this report.
Note: Posts on this site are for education purposes only. They provide one firm’s insight on the markets. Not investment advice. See additional disclaimer here.
When in an uptrend and prices start to flag, it’s a warning that energy is lost.
The Newmont update showed the heavy hitter was in a reversal. That update gave specifics on how or when the reversal would be negated (and back into an uptrend).
It’s not happening. The upside hasn’t showed … or, at least not yet.
The next trading day, Newmont (NEM) lost 1.5%. The day after that (yesterday), was another down day with a loss of nearly 1%.
Today, NEM is attempting to move higher. However, the weekly bar is still in reversal.
The mining indexes themselves are not so clear. The junior index with its weekly chart below, has it reversing last week and now attempting to move higher.
It’s losing steam. It’s no secret that failed moves can be the most dynamic of all price action.
The market is ‘supposed’ to go one way … in the case of the silver/gold miner’s, they’re supposed to be moving higher; Hyperinflation and everything, right?
What if everyone’s on the wrong side of the trade?
What if the expected hyperinflation is years away?
This juncture right now, appears (not advice, not a recommendation) to be a low risk area to go short.
In the case of the junior index GDXJ, if price action closes up for the week, the bull market may continue.
If not, and GDXJ closes down for the week, the up-trend looks like it’s failing and the entire sector could fall apart.
Note: Posts on this site are for education purposes only. They provide one firm’s insight on the markets. Not investment advice. See additional disclaimer here.
Note: Posts on this site are for education purposes only. They provide one firm’s insight on the markets. Not investment advice. See additional disclaimer here.
It’s a Fibonacci eight days from the low of September 4th, to the top on the 16th.
That time correlation, along with the channel hits, help to provide validity to the set-up.
Our short position in the sector has not changed appreciably. There was a slight backing off yesterday, by reducing the size about one-percent.
However, during today’s action as IBB was making intraday highs (BIS making lows), the short position was increased, via BIS.
In any event, we have a hard stop at the day’s high, IBB 134.85, which is approximately 31.46, on BIS: Not financial advice, not a recommendation.
As of this post, 7:00 p.m., EST, the S&P 500 futures are trading down about -0.50%, giving the inference that downside action will continue at the next session.
Silver futures have dropped another 4.5% – 5%. Price action’s heading straight down. Nearest chart support for the SIZ20 (December) contract is around 20.00.
Note: Posts on this site are for education purposes only. They provide one firm’s insight on the markets. Not investment advice. See additional disclaimer here.
Which brings us to silver and the boogeyman of ‘hyperinflation’s just around the corner’. It could be the latest false narrative that’s not panning out.
At some point, the dollar will go to zero. That’s well understood by anyone with a modest amount of financial knowledge.
It’s what happens before that; that’s what’s important.
Even J. Bravo, is starting to think it may not be a slam dunk to dollar zero. He had a guest on a while back that got howls of disapproval with his deflation (first) assessment.
Not saying the premise is right. Just saying when there’s that much of a consensus (hyperinflation), it has a nasty habit of not coming to fruition.
As always, anything can happen. We could get hit with a solar flare or a massive volcanic eruption throwing everything out of balance.
Matter of fact, both of those are highly likely right along with a near earth miss, asteroid passing within 13,000 miles … tomorrow.
In the meantime, we’ll focus on typical market behavior.
The last update stated: “Barring any additional upside, the expectation is for price action to retrace and test the wide, high volume chart areas.”
Fast forward to now. There was just one more blip higher before silver began its correction in earnest. This is normal and expected market behavior.
The chart shows there’s potential to go all the way back to support levels at the 17-area.
However, it’s also possible we’ve seen a top and silver’s headed to new lows (time stamp 3:10); That’s completely opposite the consensus and potentially a more likely result.
Note: Posts on this site are for education purposes only. They provide one firm’s insight on the markets. Not investment advice. See additional disclaimer here.