Note: Posts on this site are for education purposes only. They provide one firm’s insight on the markets. Not investment advice. See additional disclaimer here.
Note: Posts on this site are for education purposes only. They provide one firm’s insight on the markets. Not investment advice. See additional disclaimer here.
Looking at the weekly close chart, we can see the wide range.
In addition, there’s a significant bullish divergence that (technically) gives the dollar, UUP, enough energy to test the top of that range; a potential that’s completely opposite the current narrative.
A this juncture, silver, gold and the miners are still correlated.
Yesterday, a potential top and reversal in miners GDX, was identified. Today, it appears to be hovering and looking unsure of its direction.
GDX has not posted a new daily high or low as of this update.
A sustained dollar rally (along with the bond market?) would be unexpected given what seems to be apoplectic hyperinflation ranting.
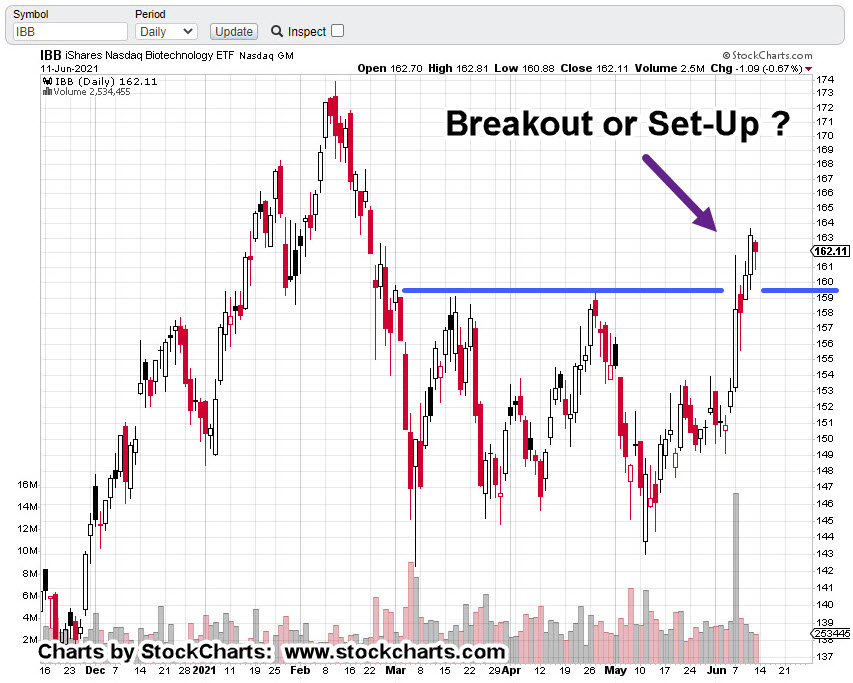
Separately, in biotech, the market (IBB) has stalled to the upside in a higher than expected test. Inverse fund LABD, made a new daily low and it too, has stalled.
Downward thrust energy on LABD is dissipating.
Technical update for biotech, planned for tomorrow … market permitting.
Note: Posts on this site are for education purposes only. They provide one firm’s insight on the markets. Not investment advice. See additional disclaimer here.
Note: Posts on this site are for education purposes only. They provide one firm’s insight on the markets. Not investment advice. See additional disclaimer here.
Yesterday, was an upward push that wound up being an ‘out-side-down’ bar (GLD, GDXJ, SLV) … a reversal in itself.
That’s not in the script. Or, is it?
At this point, the public’s literally redirected, manipulated, at will. It’s a sick game being played by all who control the media.
From a personal standpoint, I’d rather make some popcorn, take my red wagon full of fiat, go camp down around $800/oz., and wait.
The gold ice cream man may never show up. If he does, great.
If not, there’re other opportunities; at least I’ll not be one of the manipulated masses screaming inflation hyperbole if/as/when gold ratchets all the way down.
Stay Tuned
Note: Posts on this site are for education purposes only. They provide one firm’s insight on the markets. Not investment advice. See additional disclaimer here.
With price action similar to the Amgen reversal, senior mining index GDX, is testing resistance.
As if taking a cue from yesterday’s report on gold heading lower, today we have gold and the miners deciding to head higher.
All is not what it seems however.
The GDX chart above, shows we’re already in up-thrust condition. There has been a sign of supply (selling overwhelming the buying) and now we’re heading up into a test.
Going back to this report on Amgen, it’s a near exact replica of price action; except it’s (apparently) taking place quicker.
Note the bottom of the ‘Sign of Supply’ is a Fibonacci 8-Days from the high posted on April 21st.
That would naturally lend itself to expect testing action to complete on Fibonacci Day 13, which is this coming Friday.
Remember, that as soon as everyone’s got it figured out (Fibonacci time frame) it changes to something else. So, if no one is really paying attention and still in the hyper-inflation bull camp, they’ll look at this action as a bull move; missing the reversal (when or if it comes).
Tests can fail as well. GDX could push through the resistance and negate the up-thrust.
As stated many times before, the gold market’s too crowded with too many rabid bulls.
This may be a good test and reversal set-up but we’ll stick with shorting biotech (not advice, not a recommendation).
By the way … biotech’s doing very well on the short side today … 🙂
Note: Posts on this site are for education purposes only. They provide one firm’s insight on the markets. Not investment advice. See additional disclaimer here.
No-one in the inflation camp wants to hear that … it’s uncomfortable to face the potential of being so wrong.
Albeit wrong in the short term but probably right later … after it’s too late. More on that farther down.
Just like the lazy (and complicit, we might add) financial journalist publishing the standard (speck blaming) propaganda for the day, so too are the hyper-inflationists, jumping on the most popular bandwagon in town.
Not even considering the potential for a retrace; admittedly, which could be short and sharp but significant nonetheless.
This site has presented several times, we’re in a situation similar to that of Genesis 41. It’s the corn and grain first … then gold and silver.
Just to back that up a bit before getting to the charts, we have the following:
Those so focused on stacking metals will likely be using that stack to pry much needed food, food staples, seeds and fertilizer out of the hands of those not willing to sell … at any price.
Why are the oligarchs not worried about the ‘little guy’ stacking metals?
Because there’re going to make it irrelevant … at least for just long enough to completely bankrupt, starve or ‘inject’ the middle class.
Moving on to the charts:
The title header said ‘big picture’. Here we are with monthly gold charts going back to the 1950s, time-frame.
It’s been a long … long bull market. It appears to have made a top at ~1,972 and is retracing … if only just a bit.
The second chart is the one that gives us pause. Consider the potential for a more substantial pull-back.
Markets like to retrace and test. It’s what they do.
That second chart is scary. It’s plain, the 760 – 780 area is a long time (monthly) support level that goes all the way back to 1980.
Absolutely no-one expects, or is planning for gold to get back to $800/oz, or lower.
Think of the irony. The ‘stackers’ (and maybe the rest of us), having to exchange actual money, gold and silver, for worthless fiat just so they/we can buy food to stay alive.
After the middle class stackers have exhausted their metals hoard, that’s when gold and silver will launch into the next bull phase.
It has been done this way (keeping the peasants under control), literally for millennia. The method works … why change?
Summary:
The intent here, is to at least recognize the possibility for the above scenario. It’s clear and becoming more clear every day, food is the weapon of choice.
The objective is to have enough food ahead of time; be in position to take advantage of once-in-a-lifetime metals prices should that opportunity be presented.
Note: Posts on this site are for education purposes only. They provide one firm’s insight on the markets. Not investment advice. See additional disclaimer here.
The last update contained the following statement:
“Such a shallow retrace is rare. More typical is at least a 38.2%, level being tested before price reverses and heads lower. “
Back in the days of my engineering work (see About), when making a statement or conclusion, other engineers (or science professionals) would immediately expect some kind of proof or supporting documentation.
It’s just the way their brains worked; it’s somewhat an implied (unspoken) requirement of the industry and a good thing as well.
A good engineering team (along with technicians) functioned more like a select military unit than a civilian office.
Very heady stuff; especially if you’re on a major project like aircraft flight test and certification.
So, after observing and working thirty-plus years of price action, the empirical observation of 38.2%, retrace being more common than 23.6%, had become my own mental note. Filed away with the other mental notes of price action.
That note’s easily supported … even on the fly as we’ll see below.
We have three charts of equities in the silver/gold mining sector that are currently all in a retrace.
Two of those went straight to 38.2%, while one of them hit 23.6%, first and then went on to 38.2%.
Agnico Eagle Mines (AEM) retraces to 38.2% and stalls.
Seabridge Gold (SA) retraces to 38.2% and stalls.
Wheaton Precious Metals (WPM) retraces first to 23.6%, and then moves on to 38.2% … and stalls.
Reading price action is partially an art-form and partially a science. The one thing that can’t (ever) be leap-frogged is experience.
Dr. Elder said it himself when he said ‘trading is an old man’s game’.
If you don’t have (but want) the experience, it’s best to get started now. Start racking up the hours … days … weeks and years.
Market Summary:
Steven Van Meter in this update (time stamp 1:39) shows the Rydex Bull/Bear ratio (courtesy of northmantrader.com). That indicator, along with what seems like everything else, is at a never before extreme.
Note: Posts on this site are for education purposes only. They provide one firm’s insight on the markets. Not investment advice. See additional disclaimer here.
Last month, March 13th, had this forecast for GLD, to retrace at least to 166-area; a Fibonacci 23.6%, level.
So, here we are.
GLD closed last Friday, at 166.35 … close enough.
Before we get to the chart analysis, we have the following summary from the video link in the header line:
‘We were seeing some noticeable improvement in the economy … especially in the U.S. as the [speck protection] took hold.’
(time stamp 5:03).
‘Taking hold’, indeed.
We can see just how well that’s going, here, here and here … adding to a very long list.
Before we leave this topic, we have entire school districts being shut down from speck protection reactions.
Let’s extrapolate that into ‘entire grocery chains shut down’, or ‘entire air transport companies shut down’ and the picture is clear.
By now, anyone with two lipids rubbing together can see the false narrative has reached beyond absurd into a completely different realm.
We’ll just have to call it the ‘Twilight Zone‘ for lack of a better description.
All of this will affect the markets … gold included; probably in ways unknown at this point.
Analysis:
So, here we are at the 23.6% retrace. What’s next?
First off, 23.6% is very weak. It’s not typically seen as the final (upside) reversal point in general market behavior.
However, if GLD does reverse from here, posting new daily and weekly lows, it’s in serious trouble.
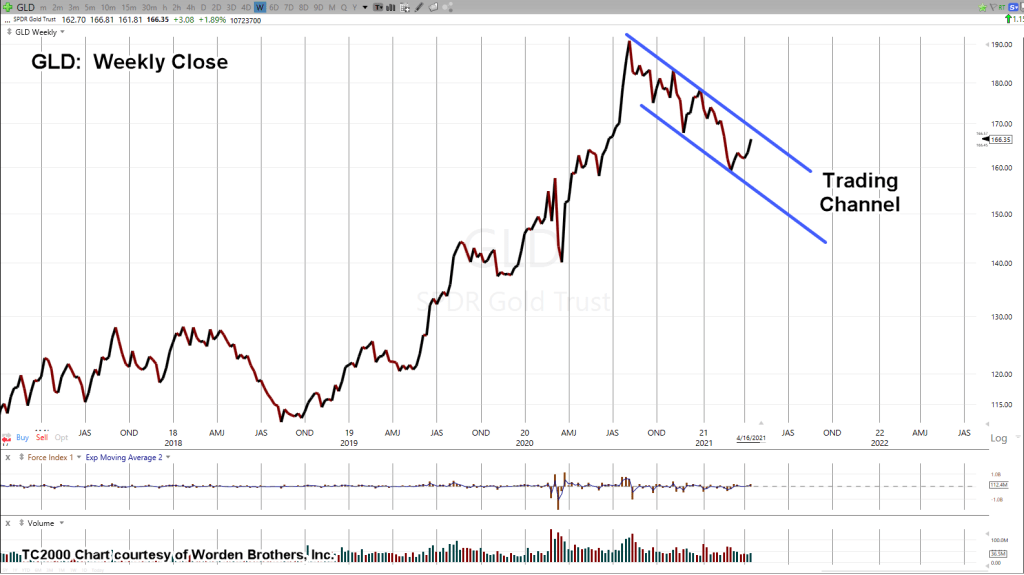
The next chart has GLD in a downward channel that’s been in-effect since last August.
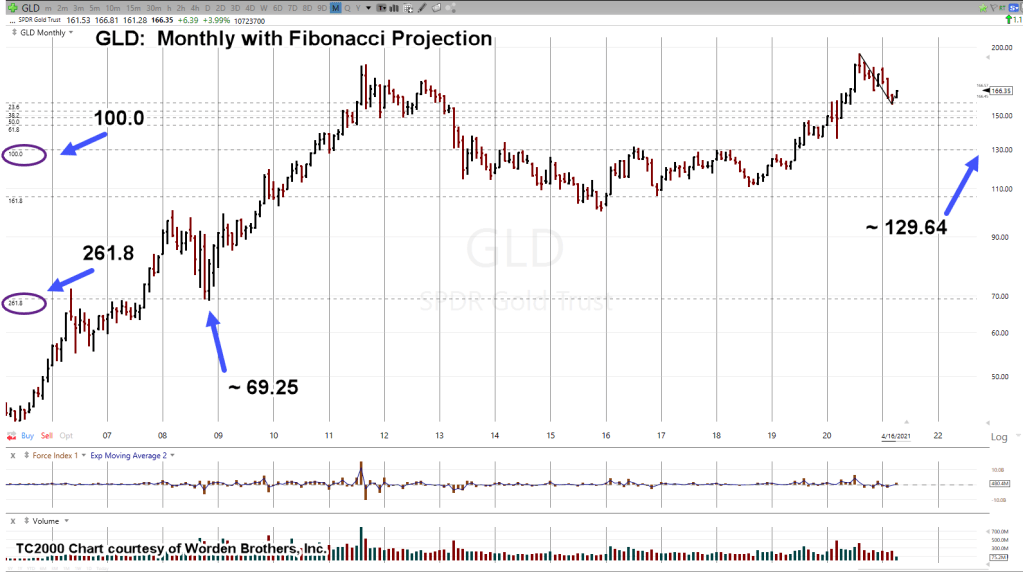
Pulling out to a longer time frame … the monthly; using a Fibonacci projection from these levels we have some interesting price targets.
Frist, is the 1:1, or 100.0% – 100.0% on the Fibonacci tool that projects GLD down to about 130 (129.64). This just happens to be the area Steven Van Metre has been discussing (as a potential target) for months.
Moving on lower to the 69.25 area for GLD, are targets mentioned by Harry Dent … albeit, years ago (actually, it was below $400).
We should keep in mind, a Fibonacci retrace of 76.4%, from all time high to cycle low, 1999/2001, is the 64-area on GLD.
Getting below $400 at this juncture seems unlikely.
Summary:
A downside reversal off 23.6% retrace would signify substantial weakness.
GLD would have to push below last week’s low of 161.81, to increase probabilities of a sustained downside move.
Stated many times on this site, precious metals are a crowded trade.
Operating at the same time, adverse reactions (and death) being caused by speck protection. A massive number of the population is subject to being permanently debilitated.
That could feed into the availability of all items; gold included but more importantly, the food supply.
To wit, CORN has just pivoted to the up side in a new trend; rising at over 437%, annualized.
More on that, later.
Stay Tuned
Note: Posts on this site are for education purposes only. They provide one firm’s insight on the markets. Not investment advice. See additional disclaimer here.
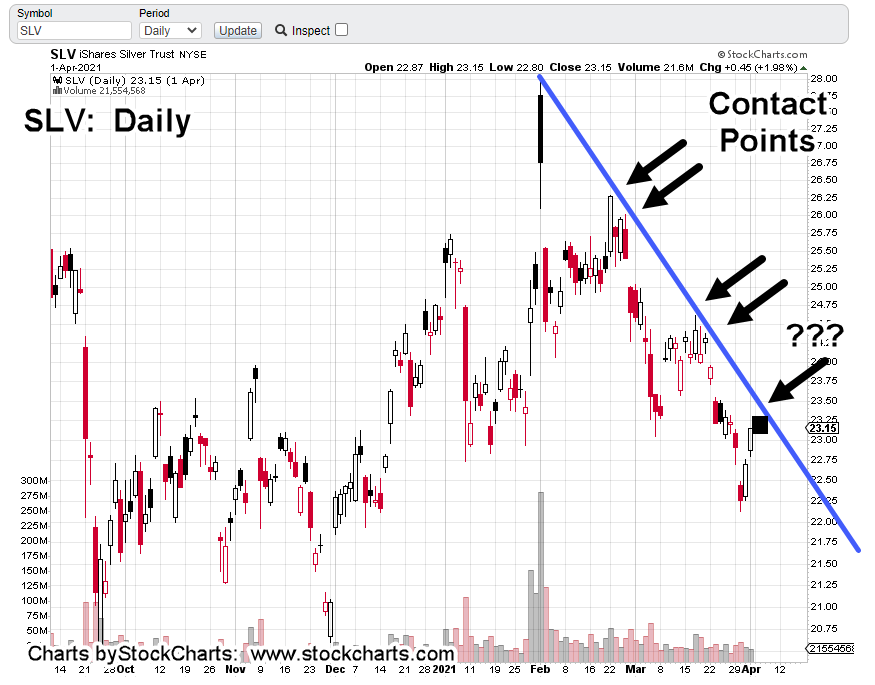
It’s about 9:37p.m. EST, on Sunday. Price action in the futures markets (SIK21) has silver up about +0.40%.
Projecting that action onto the regular daily session of silver, has it within the black box; located right up against the blue trend line.
At this juncture, the down-trend is still in effect.
In others markets … real estate:
A report just out by Uneducated Economist has ‘boots on the ground’ reports lumber inventory (for housing construction) is piling up at mills at levels never before seen … ‘stacked to the rafters’.
Note: Posts on this site are for education purposes only. They provide one firm’s insight on the markets. Not investment advice. See additional disclaimer here.









 The Danger Point®