Best Buy’s breaking a trendline that’s been in effect since December 1991.
The weekly chart (below) has zoomed-in to the last 13-years or so, showing the magnitude of the breakdown.
While the financial press plies their trade, this just out as the latest effort to confuse whoever is still listening, anyone with two BBY gift-cards rubbing together feels in their gut, we’ve gone straight past ‘recession’ and into ‘depression‘ (not advice, not a recommendation).
The chart of BBY, itself, is telling us there’s been a (potential) massive change of direction.
Best Buy (BBY), Weekly Close
The lower dashed trend-line continues all the way back to December 1991.
The wedge ‘throw-over’ lasted an incredible Fibonacci 21-months, from July of 2020 to the ‘test’ in March of 2022.
Lower price action confirmed that reversal and now, we’re breaking down from the 32-year long formation.
Positioning
From a personal standpoint, I have no plans to short BBY at this time.
However, BBY price action can, and is being used as confirmation to remain short (of not stopped out) via the biotech trade LABD-23-11 (not advice, not a recommendation).
Note: Posts on this site are for education purposes only. They provide one firm’s insight on the markets. Not investment advice. See additional disclaimer here.
Note: Posts on this site are for education purposes only. They provide one firm’s insight on the markets. Not investment advice. See additional disclaimer here.
‘Buckle your seatbelt Dorothy, ’cause Kansas is going bye-bye’
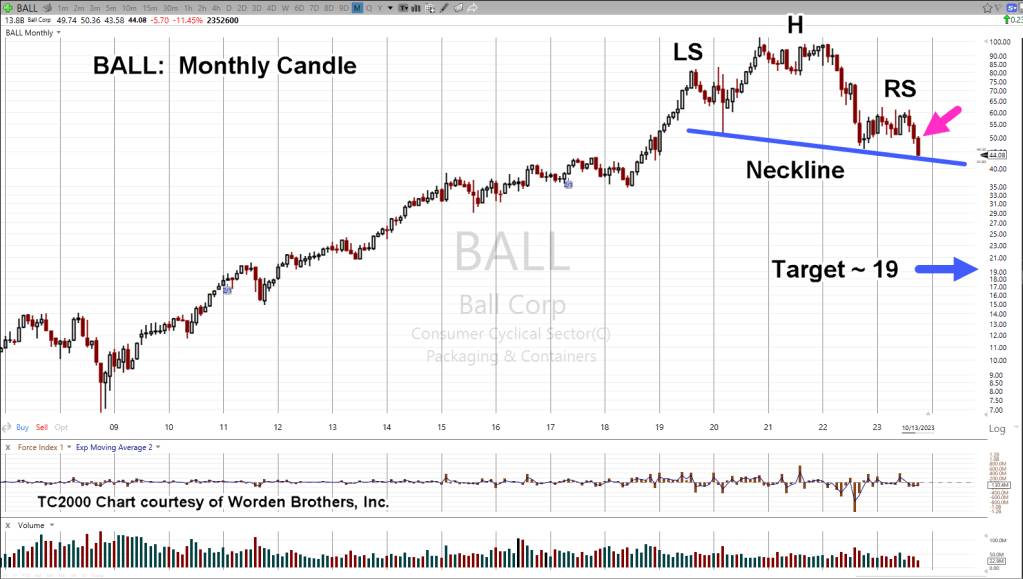
Right along with the airlines, packaging and containers (like BALL), are down hard from their all-time highs, posted long ago.
As of Friday’s close, BALL is down a stiff – 57%, from its 2020 highs and we could be just getting started.
Do Not Pass ‘Go’
It’s the opinion of this author, we never had or are going to have, a ‘recession’.
We went straight past that, right into ‘depression.’
The monthly chart below, has a massive Head & Shoulders pattern that’s been years in the making.
Ball Corp. (BALL), Monthly
From a textbook standpoint, this is near perfection.
An obvious Left Shoulder, Head, and Right Shoulder.
The Neckline is sloping downward, indicating weakness.
The retrace from the October 2022 lows (not shown), has managed only Fibonacci 23.6%, providing confirmation of significant weakness.
The magenta arrow shows it’s been three months in-a-row (the ‘breakdown’) of lower action.
Penetration & Support
BALL, has penetrated prior lows posted during October 2022, and we’re currently at the neckline.
That means Wyckoff ‘spring’ position (penetrating the lows) and there’s a potential for some type of upward action; not much, but the possibility is there.
Positioning
BALL may present the opportunity for a direct short (borrowing, selling the actual stock), with good daily volume and dividend of only 1.8% (not advice, not a recommendation).
Note: A direct short puts the trader on the hook for paying the dividend and any other upward short covering ‘surprises’ … risky indeed.
Note: Posts on this site are for education purposes only. They provide one firm’s insight on the markets. Not investment advice. See additional disclaimer here.
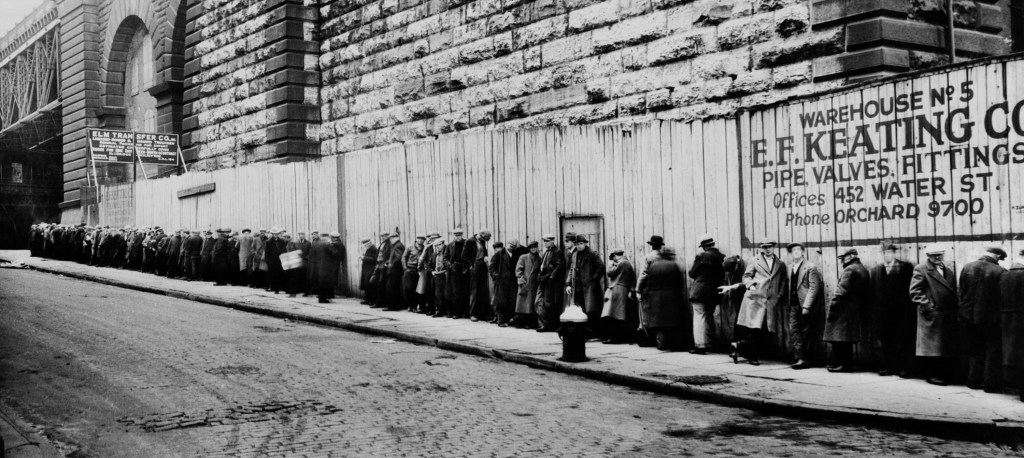
Provided many times on this site, the assessment we’ve gone straight past recession and directly to: ‘The Greater Depression’, or ‘The Great Depression 2.0’
By now, we’re all aware of this data, just out from ZeroHedge.
That data is at the ‘peak’ or the depths of 1932, and we in our current market, haven’t even got started!
The Fed’s interest rate announcement is due out at 2:00 p.m., Eastern, today; does it really matter?
We can see with unbiased observation; the wheels have already, irrevocably, been set in motion.
The economy along with the ‘elephant’ that no one talks about, are juggernauts on a downward course.
The 1929 Crash, Then Bull Rally
Remember, the big market speculators of the early 1900s typically made their fortunes on the way down (not advice, not a recommendation).
Let’s also not forget, one of, if not the largest market rallies up to that time (in percentage terms), happened right in the middle of The Great Depression.
Of course, to trade that mid-1930s rally, you had to have the capital to do so.
Which brings us to the next topic: Real Estate.
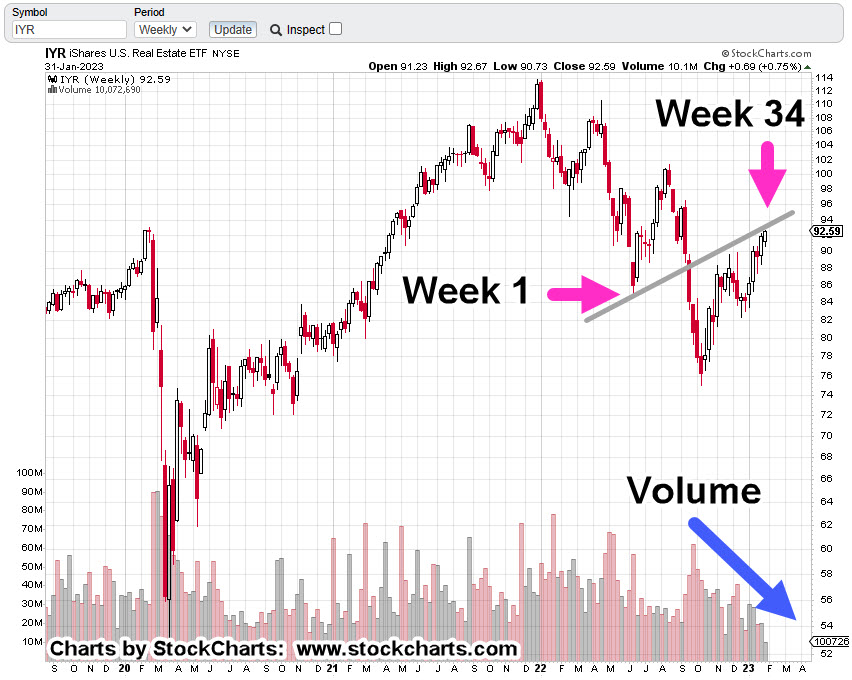
Real Estate IYR, Weekly
With yesterday’s new print high, we’re at Fibonacci Week 34. That puts us at a potential trading channel or inflection point as discussed in this post.
There’s no guarantee of a trading channel or even a reversal.
However, we do have a confluence of events; upside volume (pressure) declining, marginal new highs and the potential Fed pivot point, due out today.
It’s about 20-minutes before the open. Let’s see what happens next.
Note: Posts on this site are for education purposes only. They provide one firm’s insight on the markets. Not investment advice. See additional disclaimer here.
Like a stubborn mule, silver’s just not going along with the ‘hyperinflation’ narrative.
How many years of mainstream ‘breakout’ forecasts, has it been?
‘Silver upside breakout just around the corner’. ‘Silver to launch higher because of inflation’. ‘Silver physical shortage to expose futures manipulation’ … and on.
It’s not happening. Why?
Silver, more so than gold, is an industrial metal. In that sense, more like copper than gold.
That said, silver’s price action alone, tells us (along with copper) we’re in an imploding economy.
Before we get to the charts, let’s review what was said at the last update on silver (emphasis added):
“Since gold (GLD) is in position for an upward test of its wedge breakdown (chart not shown), it’s reasonable to expect another bounce off support for silver.
Using the ‘rule of alternation’, we already had a brief move off the first support level before reversing.
The next contact at lower support, will likely bounce for longer or not at all.“
Well, ‘bounce for longer’, is exactly what we got.
The prior bounce from low to high lasted 11-trading days (5/13/22 – 5/27/22). The current bounce lasted nearly twice as long; 20-trading days.
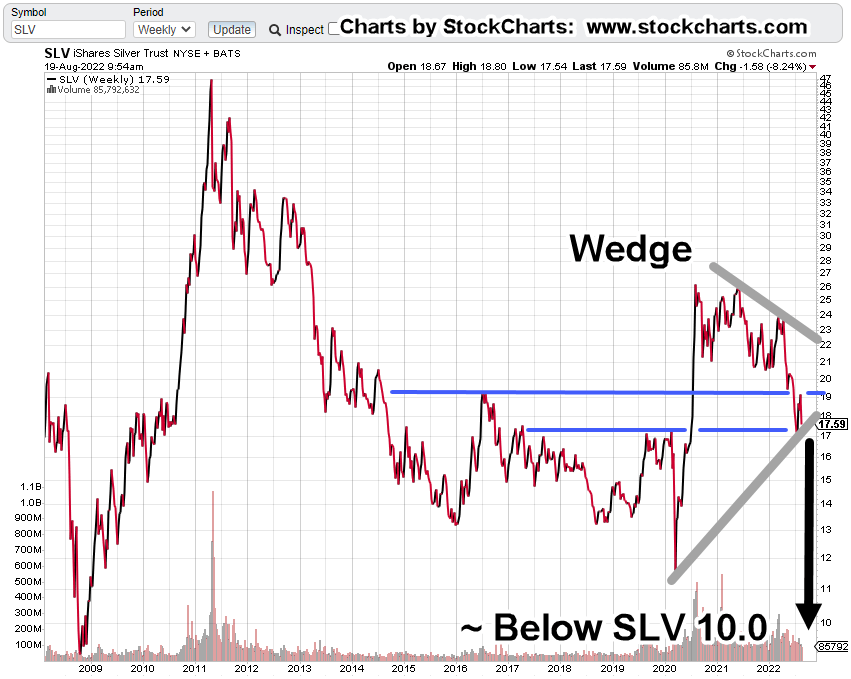
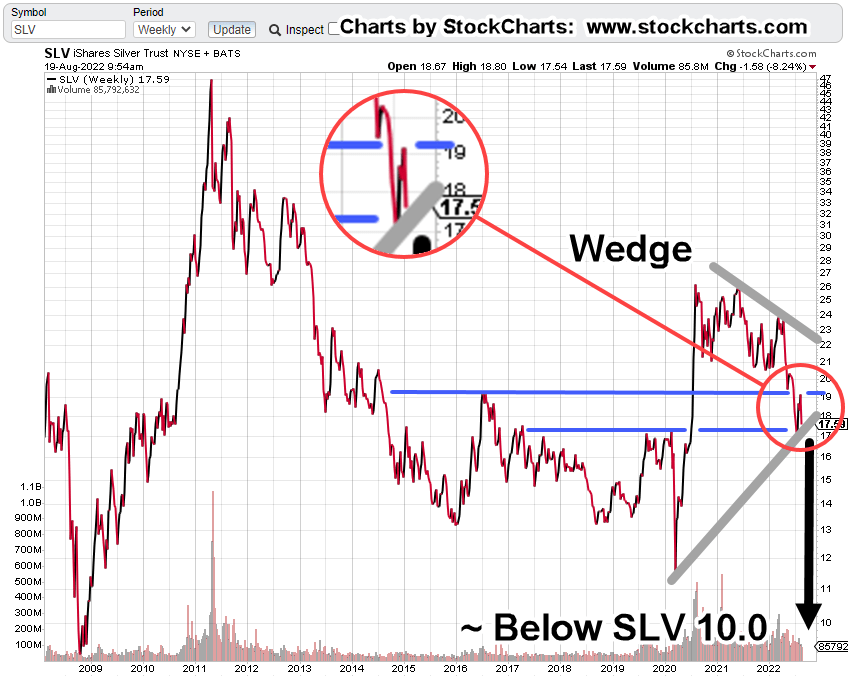
Silver (SLV), Weekly Close
Since the last update, price action bounced off support, confirmed the wedge, tested upside resistance and now, back down to the wedge boundary.
The zoom chart below shows the detail of the resistance test and reversal.
If SLV posts a decisive break below the wedge boundary, standard traditional charting technique provides a downside target in the vicinity of SLV 10.0, or slightly below.
Summary
As always, anything can happen. If silver decides to start posting bullish action, the analysis will be changed.
At this point, with growing fundamentals of economic collapse, i.e., Great Depression 2.0, silver’s price action is fighting the bulls (and winning), thus, confirming the economic decline (not advice not a recommendation).
Note: Posts on this site are for education purposes only. They provide one firm’s insight on the markets. Not investment advice. See additional disclaimer here.
Media analysts and YouTubers alike, are scratching their collective coneheads.
They’re asking; why is silver down a whopping – 39%, from its print high of February 1st, this year?
If we factor in the high of SLV 48.35 (from April of 2011), silver’s been pummeled – 65%.
With the ‘rampant’ inflation and never-ending money printing, silver (along with gold) should, there’s that word ‘should’, be skyrocketing higher.
It’s an apparent mystery; steeped with smoke-filled back rooms and intrigue.
The ‘Inflation’ Narrative
Let’s help unravel silver’s decline by taking a look at some of the facts.
First up, is ‘inflation’.
The inflation narrative is false. There; glad we got that out of the way. 🙂
How do we know?
We know it’s false because the price action itself, tells us it’s false.
It’s obvious at this point, what we have is supply destruction and not inflation.
The Economic ‘Connection’
Next up, is the economy.
Silver along with copper are industrial metals. They follow the economy … more so with copper. Copper futures are down – 32.5%, from their March 7th, highs.
Coper’s industrial uses are linked here. Nearly half of copper production is for building and construction.
Since the largest real estate bubble in world history has just popped, copper demand is essentially going to collapse.
If at this early stage of Great Depression 2.0, the average person can’t pay the phone bill, where are they going to get any money to drive precious metals demand higher?
Moving on to ‘truth’, we have price action.
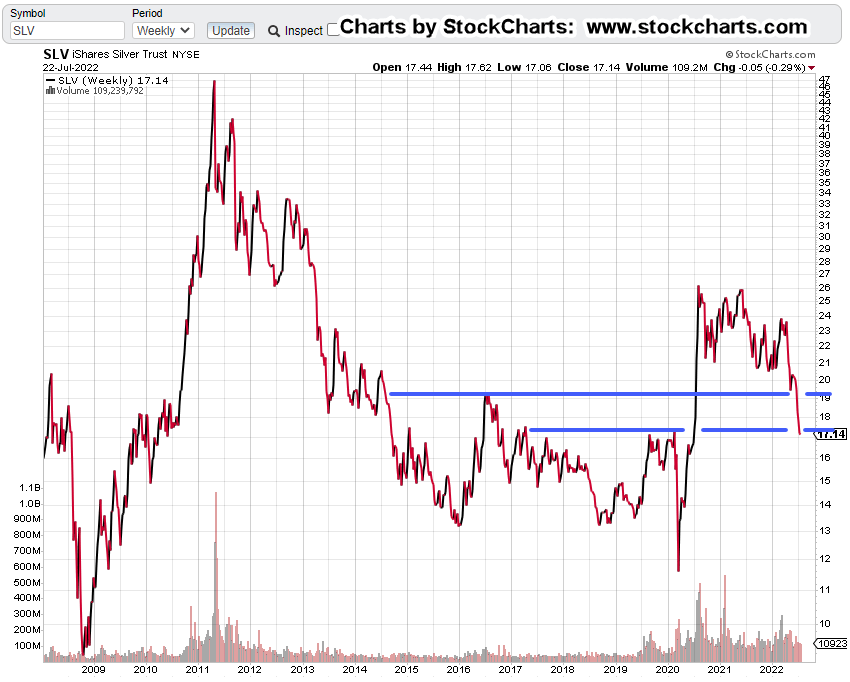
Silver SLV, Weekly Close
The chart below has SLV, penetrating one support level (upper blue line) and just now, at the next support.
Since gold (GLD) is in position for an upward test of its wedge breakdown (chart not shown), it’s reasonable to expect another bounce off support for silver.
Using the ‘rule of alternation’, we already had a brief move off the first support level before reversing.
The next contact at lower support, will likely bounce for longer or not at all.
If silver can’t go higher … look out below.
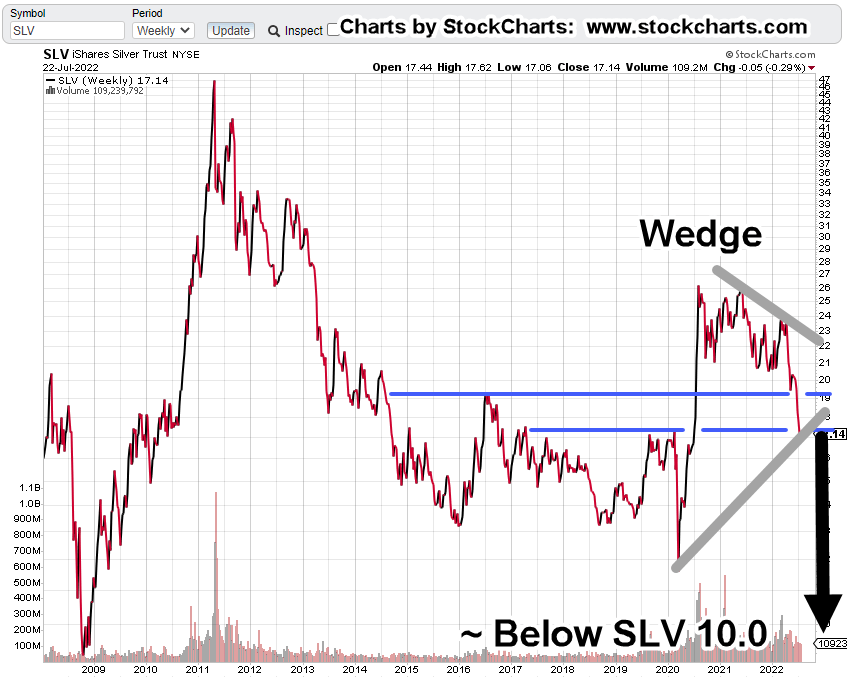
Silver SLV, To Single Digits?
The economic depression is just getting started and industrial metals demand is already collapsing.
Although a data point of one, the following is significant.
Supporting the ‘depression’ assessment is this link; specifically, time stamp 3:20, with a recent graph of housing listings in California … going vertical.
SLV, is in position to test higher; thus, confirming the wedge pattern (grey lines) shown below.
Added to that pattern is a measured move target should SLV, break down to lower levels after an upward test.
There it is: ‘Mystery’ solved.
Silver is heading lower because price action said it would.
Now, the fundamentals are kicking in to add a potential mass acceleration to the decline.
Note: Posts on this site are for education purposes only. They provide one firm’s insight on the markets. Not investment advice. See additional disclaimer here.