With the overall semiconductor index higher in the pre-market, it’s possible INTC could use today to grind its way higher into a test (not advice, not a recommendation).
The chart shows we’ve had an up-thrust (reversal), then a -7.45% drop (ease-of-movement) to minor support levels.
intel INTC, Daily
The blue-line, resistance, is also the 50% retrace from highs of January 2020 to the lows of April, this year.
The objective is to see if the range narrows (upside) between yesterday’s low and high, for a short position (not advice, not a recommendation).
In the pre-market (7:40 a.m., EST), INTC is trading slightly higher (+0.46) pts).
Note: Posts on this site are for education purposes only. They provide one firm’s insight on the markets. Not investment advice. See additional disclaimer here.
Note: Posts on this site are for education purposes only. They provide one firm’s insight on the markets. Not investment advice. See additional disclaimer here.
Note: Posts on this site are for education purposes only. They provide one firm’s insight on the markets. Not investment advice. See additional disclaimer here.
Note: Posts on this site are for education purposes only. They provide one firm’s insight on the markets. Not investment advice. See additional disclaimer here.
It’s the market’s job to frustrate and bankrupt as many participants as possible.
For the highly competitive alpha, the desire to ‘be right’ and catch the absolute turn, overrides any fear of ‘pulling the trigger’.
That fear is for the timid, over-calculating, fastidious type.
Either way, the market attempts to shake-out one side (the alpha trader) or leave the other side behind (the other traders).
Volatility & Price Extremes
So it is with both Intel (INTC), and biotech SPBIO, with its leveraged inverse LABD.
For Intel, today’s action looked like it would never stop and kept screaming higher.
However, if we look at the daily chart, INTC (at this juncture) has failed to post a new extreme daily high.
The chart shows that each recent extreme has been lower than the last (prices approximated).
Intel INTC, Daily
We’ll see if the next session or sessions will be able to penetrate farther to the upside … or if today was the last gasp before heading significantly lower.
For biotech SPBIO, and the leveraged inverse LABD it was a different story, high volatility.
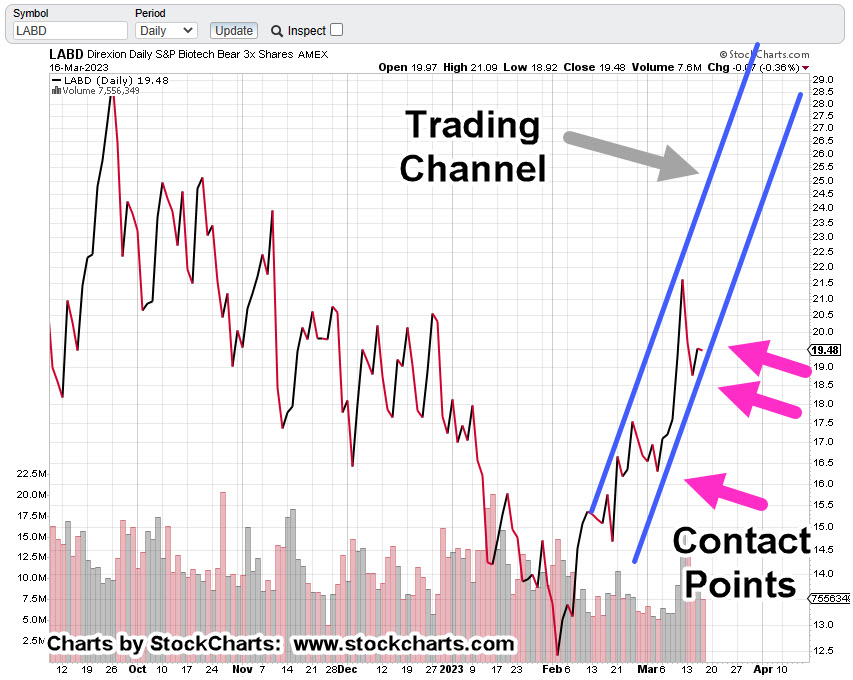
With that sector, the wild price swings do not make it obvious but there’s (as of today) a nascent trend confirmation and trading channel.
SPBIO, Leveraged Inverse LABD, Daily Close
It’s been about six-weeks since the biotech reversal was identified in this post.
A short entry at the location noted (LABD 12.91) would now be yielding an open profit over + 50% (not advice, not a recommendation).
It’s easy to see at this point getting in position later, when it’s obvious, sets one up to get whacked on an adverse move like we’ve had over the past four sessions.
After Hours
With about 30-mintues left in the after-hours session, inverse LABD, is trading higher between 0.50% – 1.0% and INTC is lower by -0.38%.
Note: Posts on this site are for education purposes only. They provide one firm’s insight on the markets. Not investment advice. See additional disclaimer here.
It’s possible the latest bank-run scare was only a one-day reprieve.
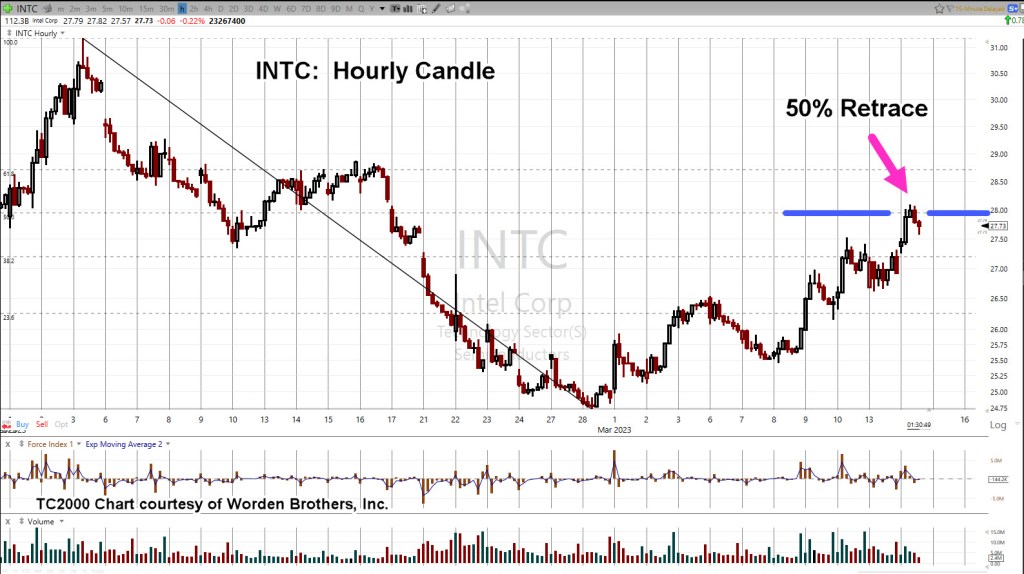
Chief cook, and bottle washer, Intel (INTC) pushed past the upside area identified in the last update.
It now appears to be in a ‘test and reversal’.
The first chart is the hourly, showing the 50% retrace.
Intel INTC, Hourly
When pulling farther back to the daily, we see the trend line break being tested … today.
Intel INTC, Daily
During yesterday’s session, we have not even got started to the downside and already data vendors were having trouble (network problems) providing market quotes.
As this post is being created (2:05 p.m., EST) Intel continues to pull away from its intraday highs.
Note: Posts on this site are for education purposes only. They provide one firm’s insight on the markets. Not investment advice. See additional disclaimer here.
Note: Posts on this site are for education purposes only. They provide one firm’s insight on the markets. Not investment advice. See additional disclaimer here.
Note: Posts on this site are for education purposes only. They provide one firm’s insight on the markets. Not investment advice. See additional disclaimer here.
Although none of the above directly affects day to day price action of INTC, what it does do, is provide the fundamental backdrop; Portland and immediate vicinity is heading down and the pace is accelerating.
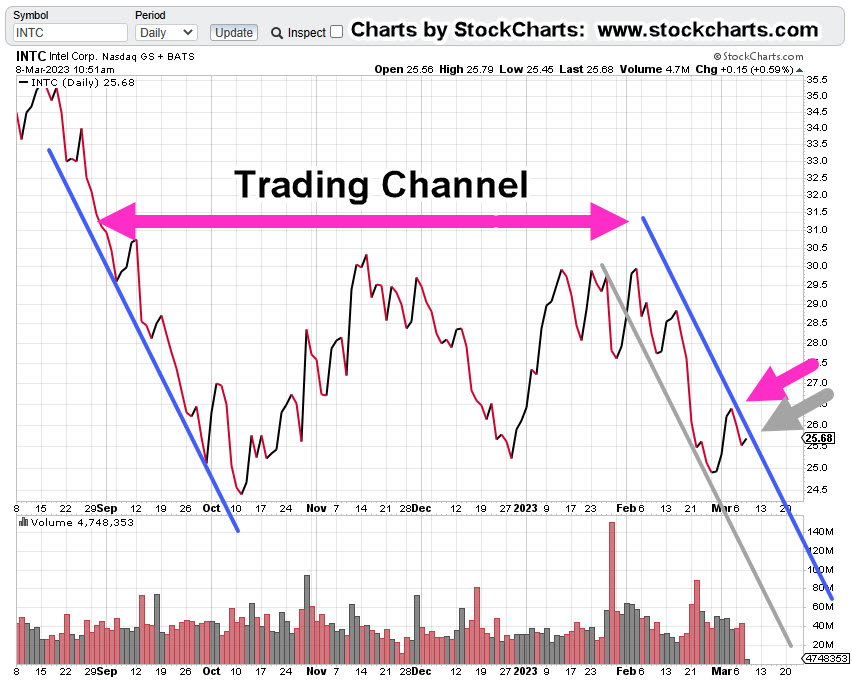
Intel Daily Close
At this juncture (11:38 a.m., EST), Intel is clawing its way back to test a potential trendline.
All lines are exactly parallel.
The grey trendline in the chart is there to show, we have repeating trendlines throughout the price action when taken from the left side of the trading channel.
If price action continues to struggle and closes near the level as shown (grey arrow), it’s a potential indicator that we have a right side trendline contact (not advice, not a recommendation).
Note: Posts on this site are for education purposes only. They provide one firm’s insight on the markets. Not investment advice. See additional disclaimer here.
Unless we reverse right here and now, Fibonacci retrace and projections (shown below) target the $260 – level for TSLA.
If you know what’s (potentially) coming, you can get ready.
The ‘Ponzi’ case for Tesla has already been established with this prior link, here. Of special note in that link, are the production percentages for General Motors.
With all of that, let’s go out on a limb and project TSLA might top at 266, instead of the Fibonacci projected 260 (not advice, not a recommendation).
Tesla TSLA, Daily
The daily chart is compressed to show the entire down-wave and retrace from the November 4th, 2021, high.
Three retrace levels are shown (magenta); first is 23.6%, then 38.2% and labeled retrace of 50%, near the 259-level.
Moving closer-in, and including Fibonacci wave projection, while keeping the retrace levels, yields the following.
The chart’s a little bit busy but one gets the idea.
There’s a Fibonacci overlap of retrace and projection near the 259-260, level.
What’s another 6-points between friends to get to 266?
Next Steps
Of course, anything can happen and TSLA, could reverse to the downside on Monday.
However, if it continues higher, we’ll be monitoring for potential confirmation of the target and subsequent reversal (not advice, not a recommendation).
Note: Posts on this site are for education purposes only. They provide one firm’s insight on the markets. Not investment advice. See additional disclaimer here.