What A Surprise!

The Fed’s next move may be to raise rates, not lower them.
For those following this site, there’s no surprise. Over a year ago, we had this:
“Like ‘bread and circuses’, the ‘pivot’ discussion is a distraction … “
Incorporating the potential of rates higher into one’s analysis, ‘internalizing’ it as Uneducated Economist says, positions one completely out of the herd, able to view events objectively.
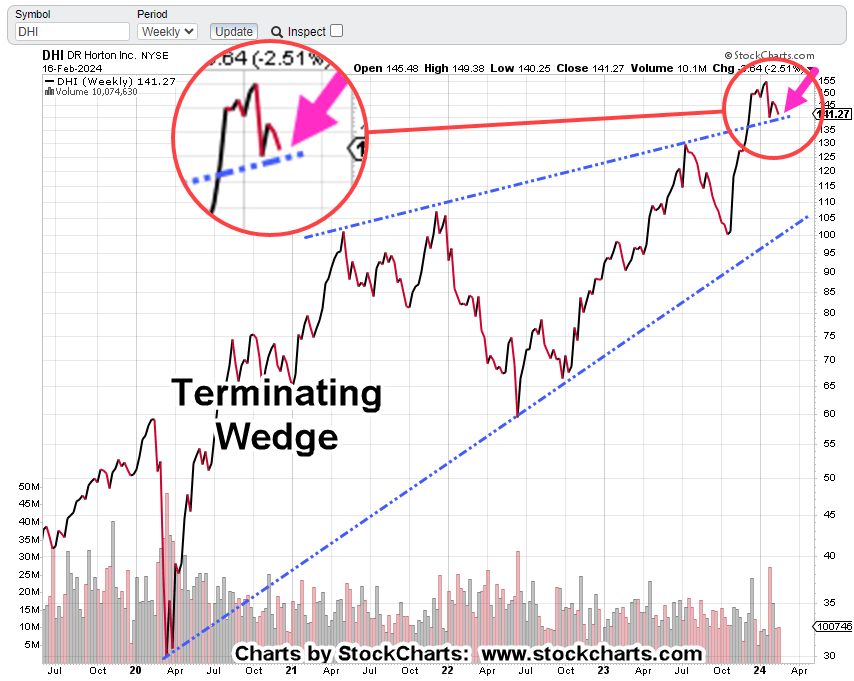
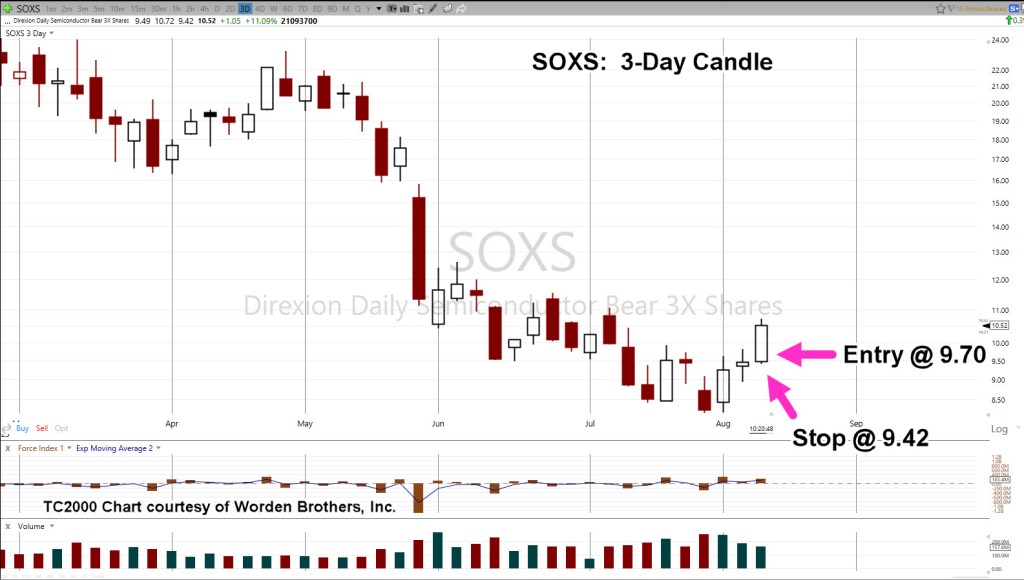
All of which brings us to the bond market, specifically long bonds TLT.
Long Bonds ETF, TLT Daily Close
Updates from this site are noted.
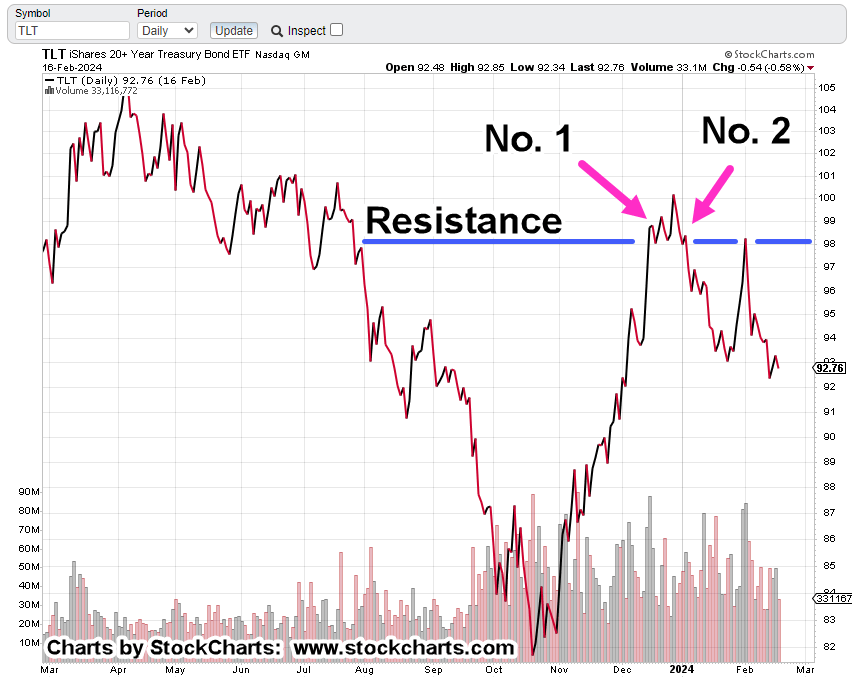
Until price action shows otherwise, rates are likely to head higher, not lower (bond prices down).
Therefore, using that strategic premise, the upside breakout (above resistance) in bonds had a higher probability of downside reversal than upside continuation.
No. 1 : The Usual Suspects
In the update with the above name, link here, scroll down to bullet item No. 10 for analysis.
The potential for a false breakout was correctly identified,
No. 2: Bond Reversal ? … Ruh, Roh
First, there’s potential, then, the actual.
The next update, link here, presented among other things, the odd occurrence of both bond and overall markets moving down simultaneously.
The inference being, the 40-year bond bull market is over and higher rates are more likely (not advice, not a recommendation).
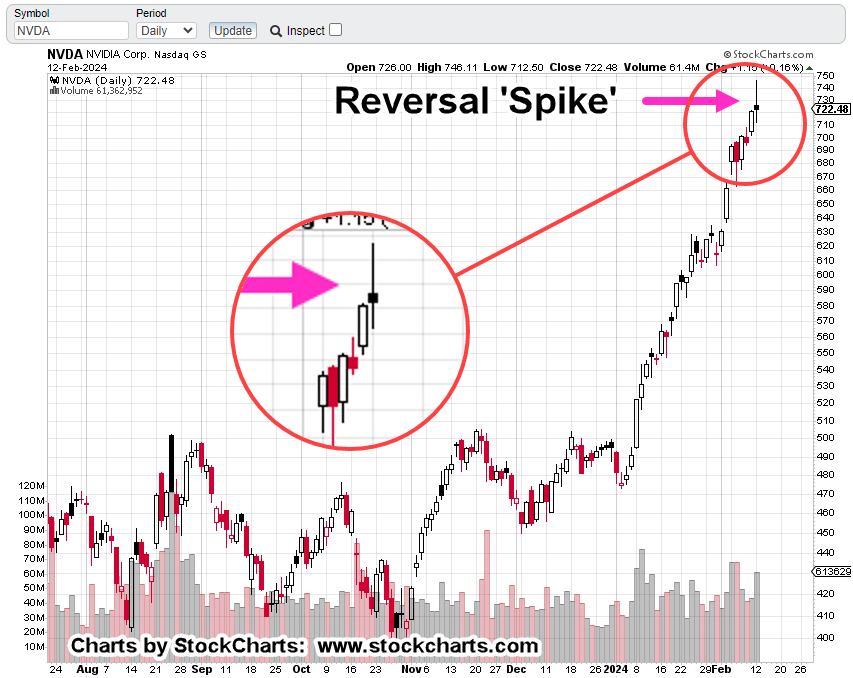
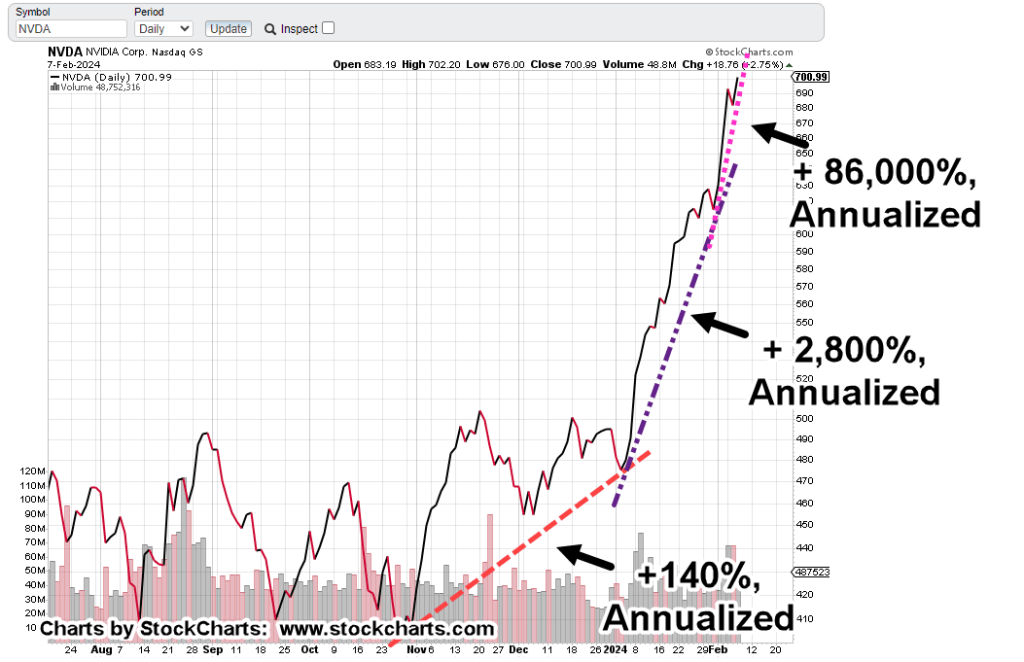
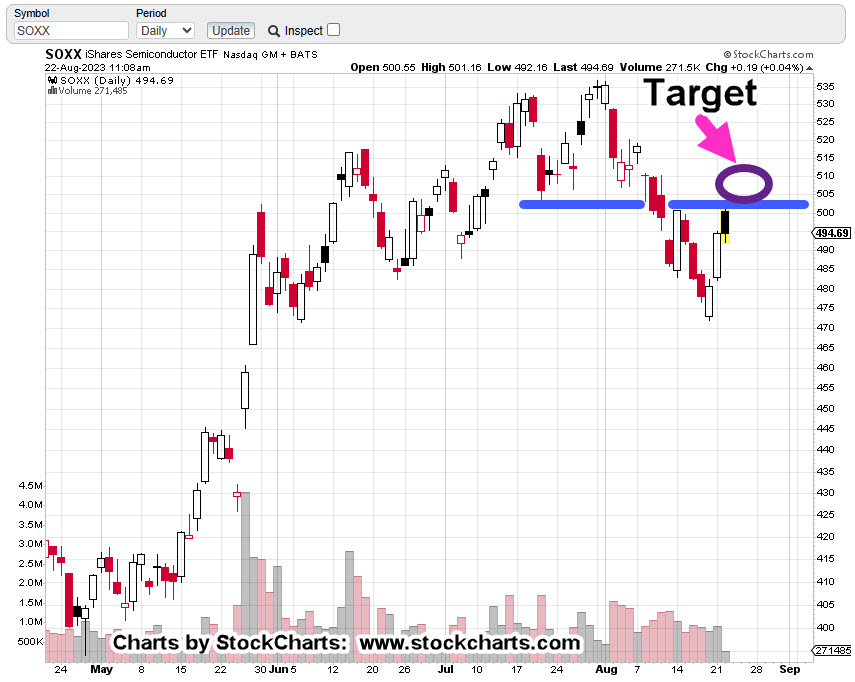
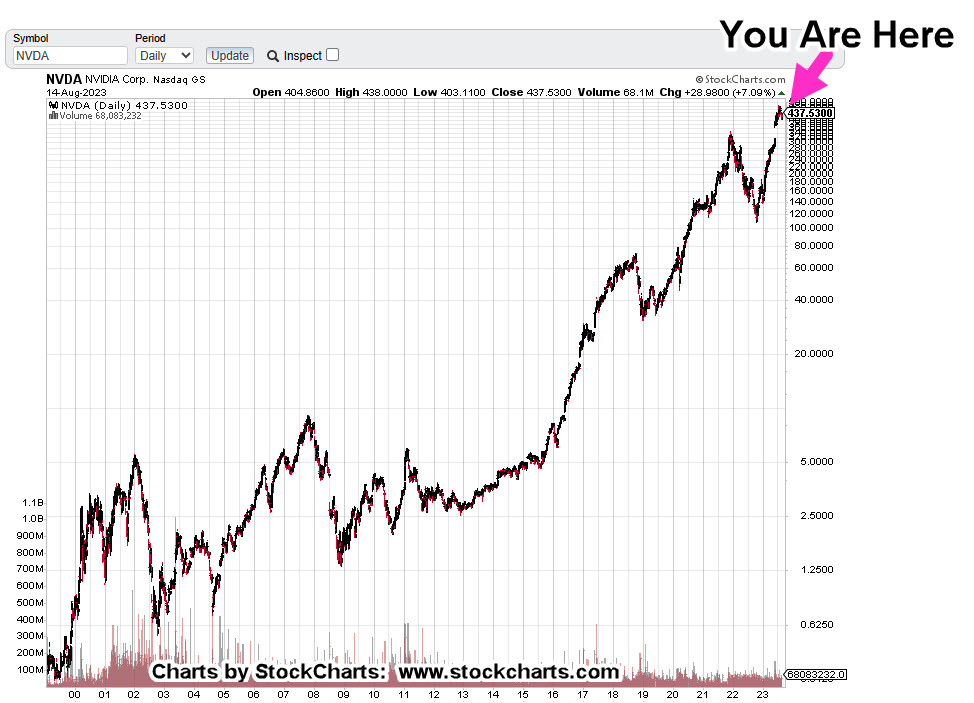
Then, The Fed and Nvidia
The next few days may be quite interesting.
Nvidia (NVDA) earnings are due after hours on Wednesday and the Fed minutes are scheduled for release earlier (2:00 p.m., EST) the same day.
Stay Tuned
Charts by StockCharts
Note: Posts on this site are for education purposes only. They provide one firm’s insight on the markets. Not investment advice. See additional disclaimer here.
The Danger Point®, trade mark: No. 6,505,279