Watching J.B.’s (Jerimiah Babe’s) Los Angeles walkabouts, proves commercial real estate’s already imploded.

The instant the linked video starts, we see the root of the problem.
Of course, it’s all part of the plan but that’s a topic for another time.
What’s shown in J.B.’s video(s) is that one after another, commercial properties are boarded up and fenced off.
One might think it’s only progressive utopia California that’s having a rough time; taking a look at comments to his videos shows otherwise.
Just one example taken from the video link:
“Even if the U.S. lifted all lockdown restrictions 100% TODAY, I still think for many companies, its too late.”
The economy is not coming back … not in our lifetimes anyway.
No matter what happens, re-building will take many decades. Even so, the destruction has to be completed first.
We’re nowhere near downside end (economy, markets or otherwise).
On Thursday you would’ve thought from the news, we just collapsed by 50% or more. In fact, the S&P (SPY) was only down -2.41%.
Think about what happens we get the hit … that does not come back.
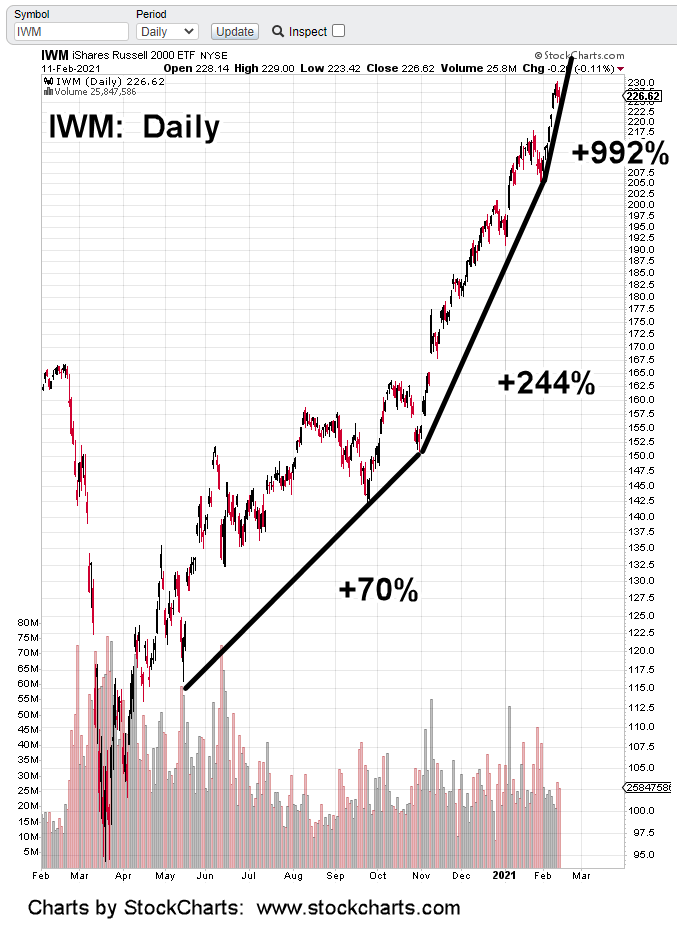
As early as May 12th of last year, this site began to note the similarities of the markets to August of 1987. In retrospect, that post (and the ones that followed) seemed a little premature.
It’s a different story now.
Markets even more extended; bond rates higher.
Throughout the years, going back to the early 1900’s, the professionals always preferred down markets. Profits (and fortunes) can be made much faster and with more reliability.
Fear is much easier to gage (on the charts) than greed.
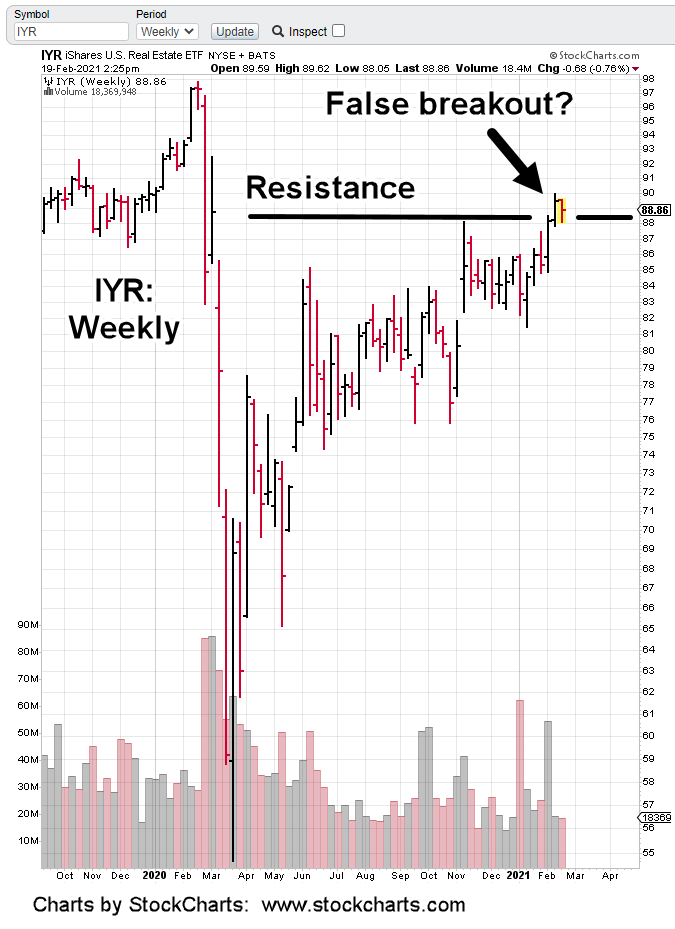
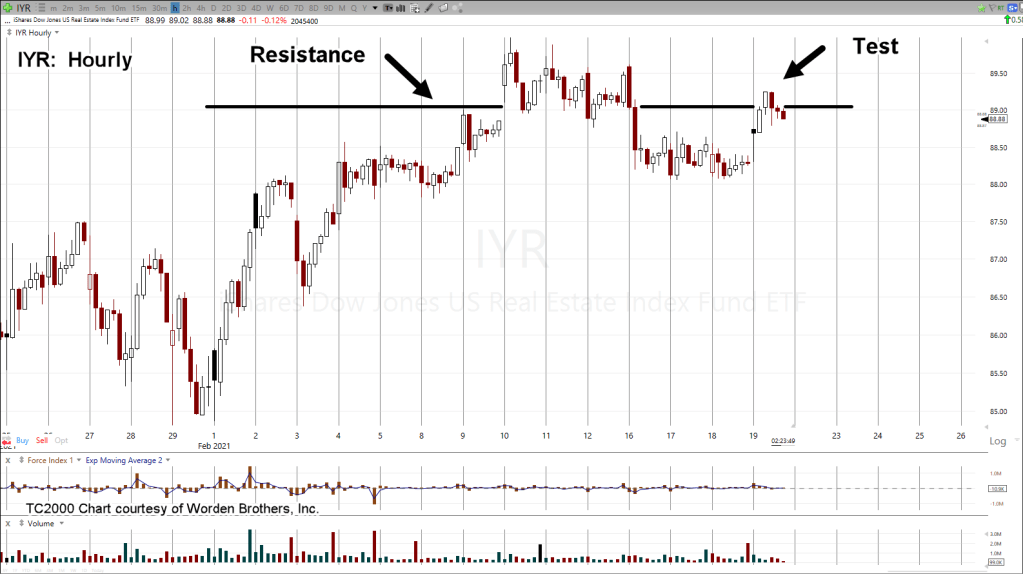
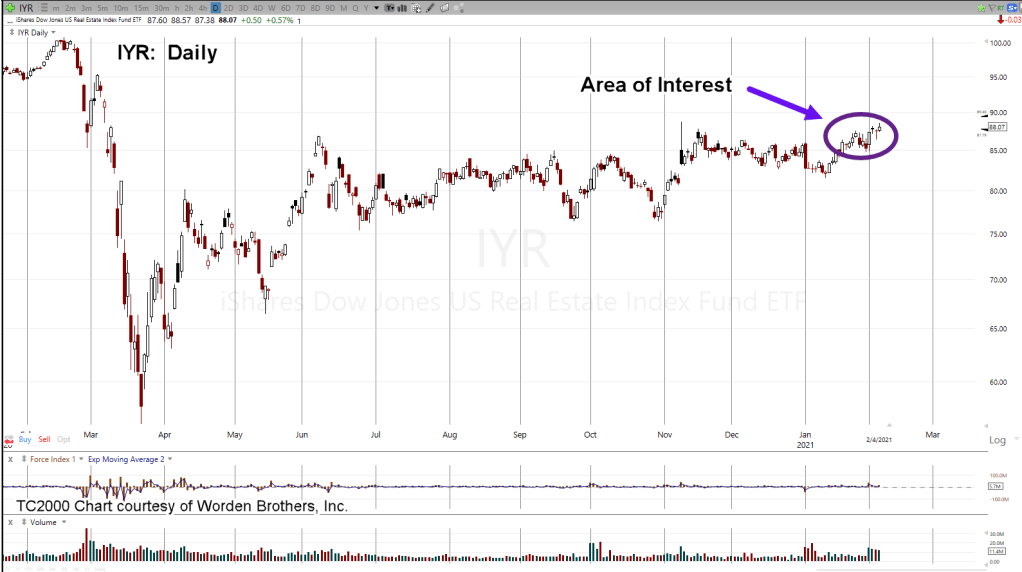
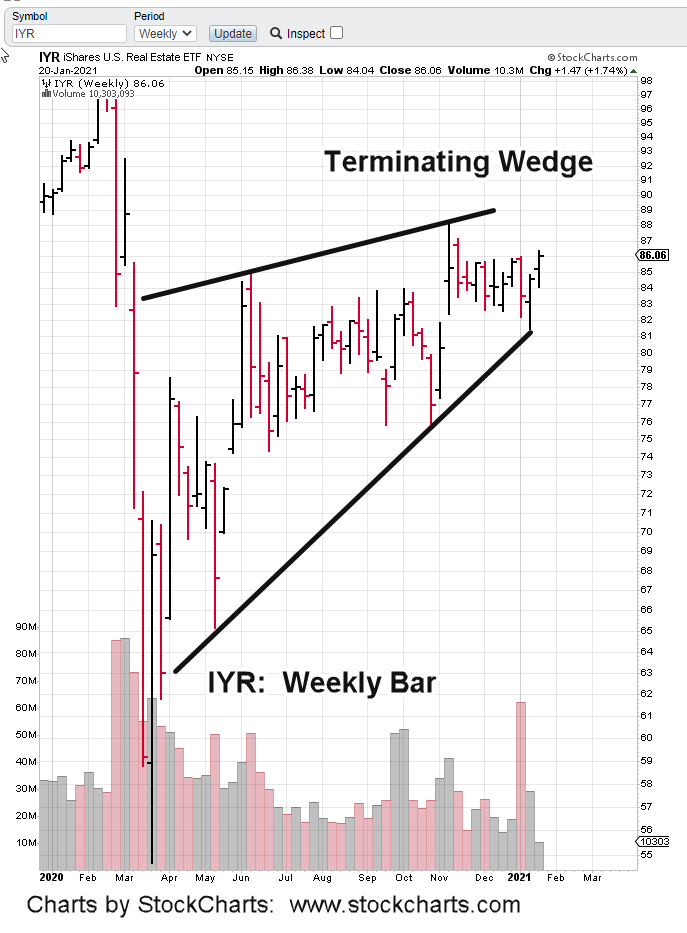
With that in mind, we can look at real estate with a clear head and assess the opportunities.
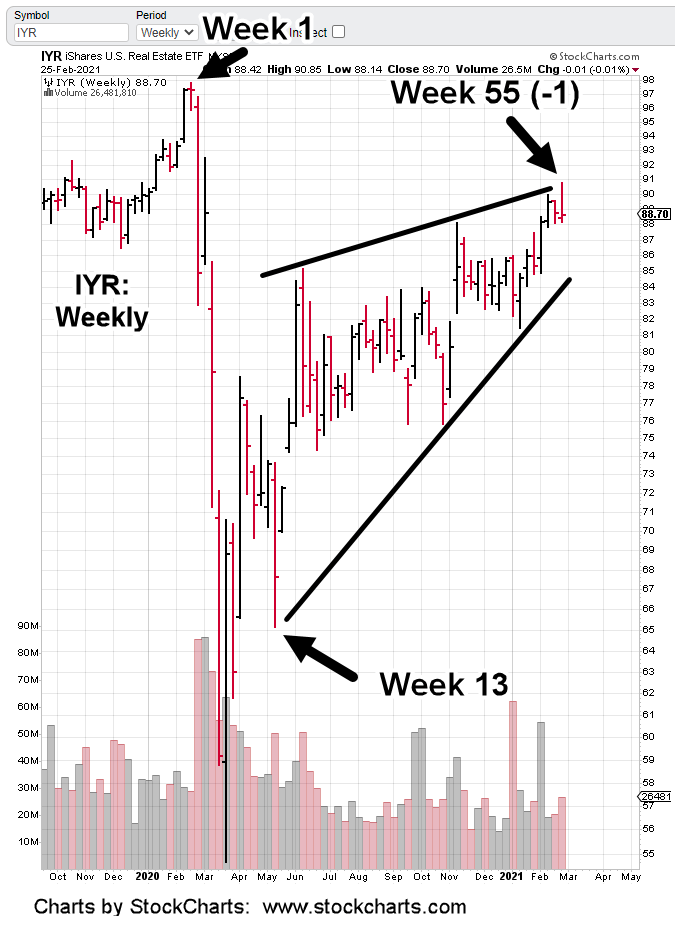
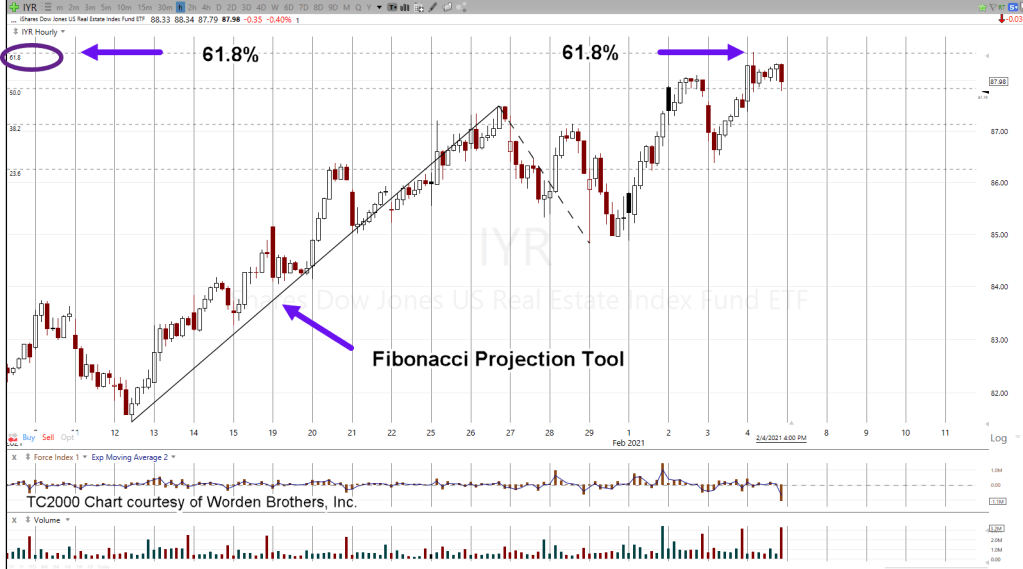
It turns out, not only has IYR got itself into a terminating wedge, it’s doing so at Fibonacci time frames.
During the past six-weeks, my firm (link here) has been positioning in and out, and back in, several times using short fund DRV (not advice not a recommendation).
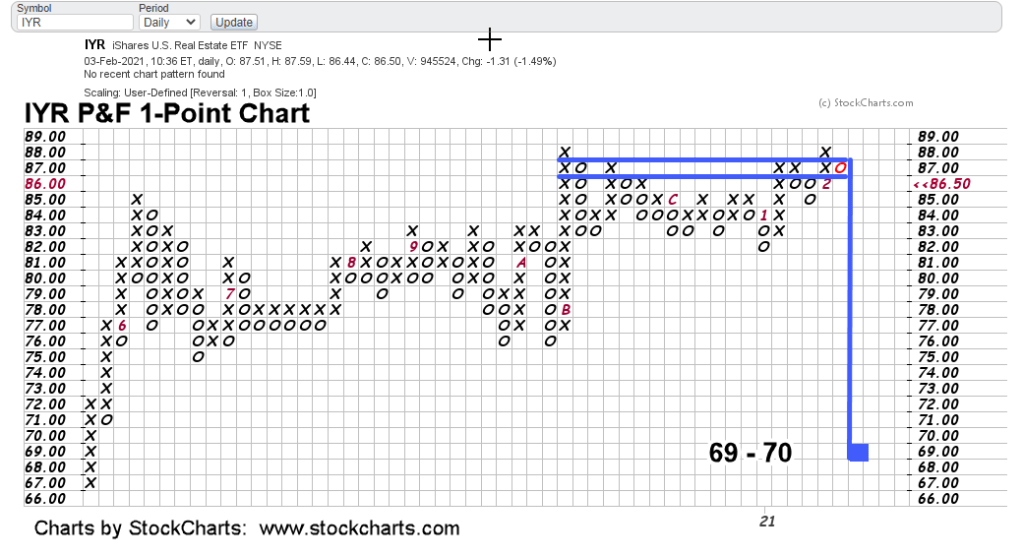
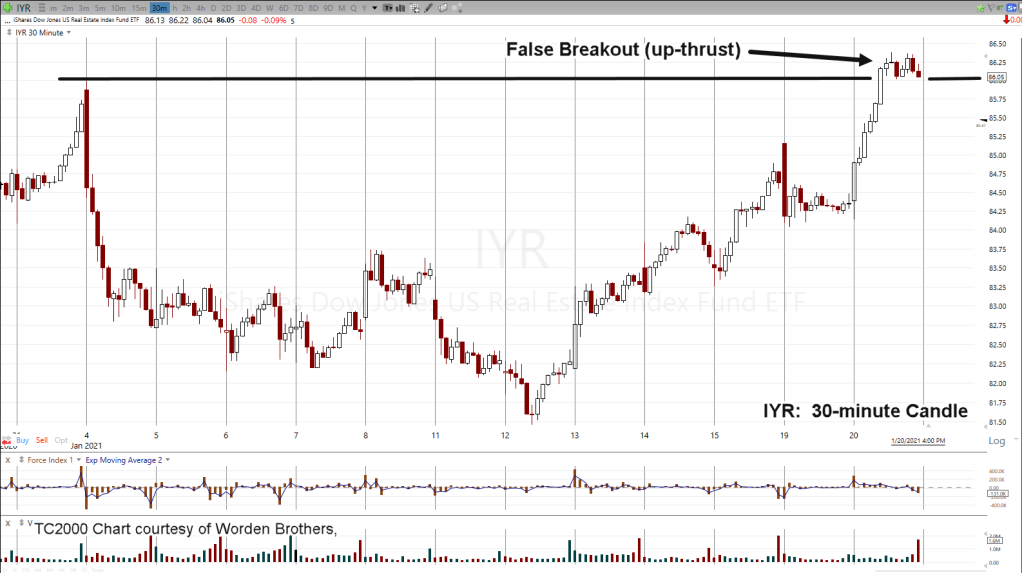
Just yesterday, before IYR broke decisively lower, that DRV position was increased to its maximum level thus far.
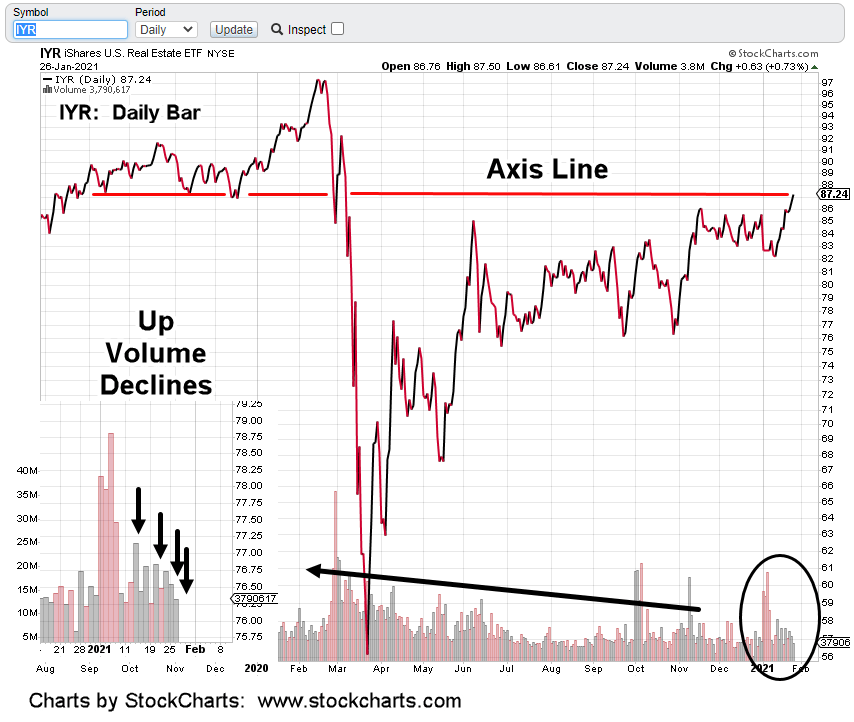
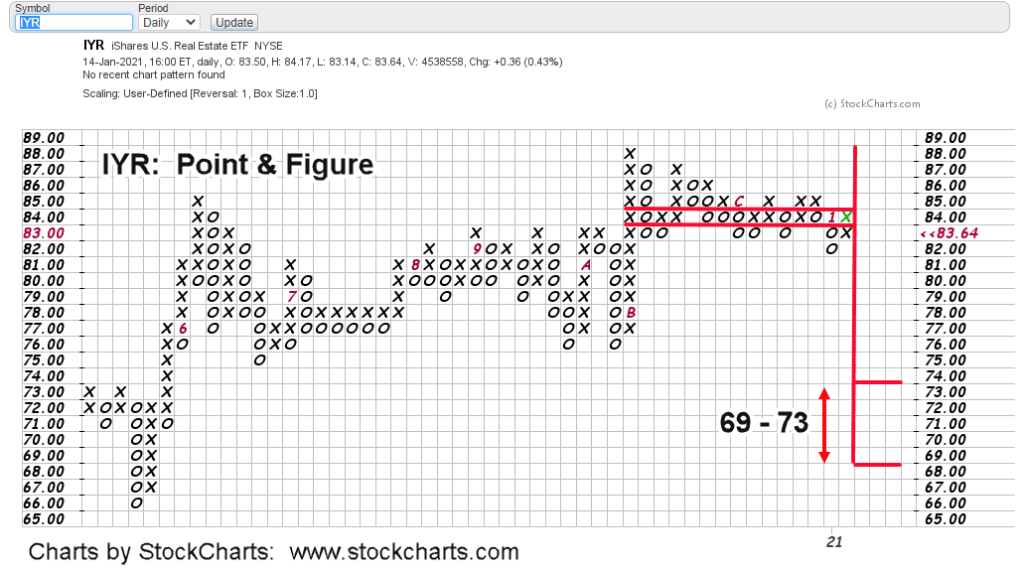
Obviously, a new high in IYR is not anticipated. The reason for selecting real estate as a strategic short (unlike the LABD swing trade) is for the downside potential.
Inverse leveraged funds work best during a sustained, directional move. It remains to be seen if DRV was a good selection; not only for a trade vehicle, but for the anticipated collapse in real estate.
Stay Tuned
Charts by StockCharts
Note: Posts on this site are for education purposes only. They provide one firm’s insight on the markets. Not investment advice. See additional disclaimer here.