Note: Posts on this site are for education purposes only. They provide one firm’s insight on the markets. Not investment advice. See additional disclaimer here.
Note: Posts on this site are for education purposes only. They provide one firm’s insight on the markets. Not investment advice. See additional disclaimer here.
Can we go further to say, a ‘set-up’ within a ‘set-up’?
With the caveat that absolutely anything can happen, let’s look at what may be a competed test on the weekly time frame while at the same time, a completed up-thrust set-up on the daily time frame.
First, the weekly using the inverted chart.
Biotech XBI, Weekly (inverted)
As a reference, here’s the link to the prior weekly chart, discussing the spring ‘test’ set-up.
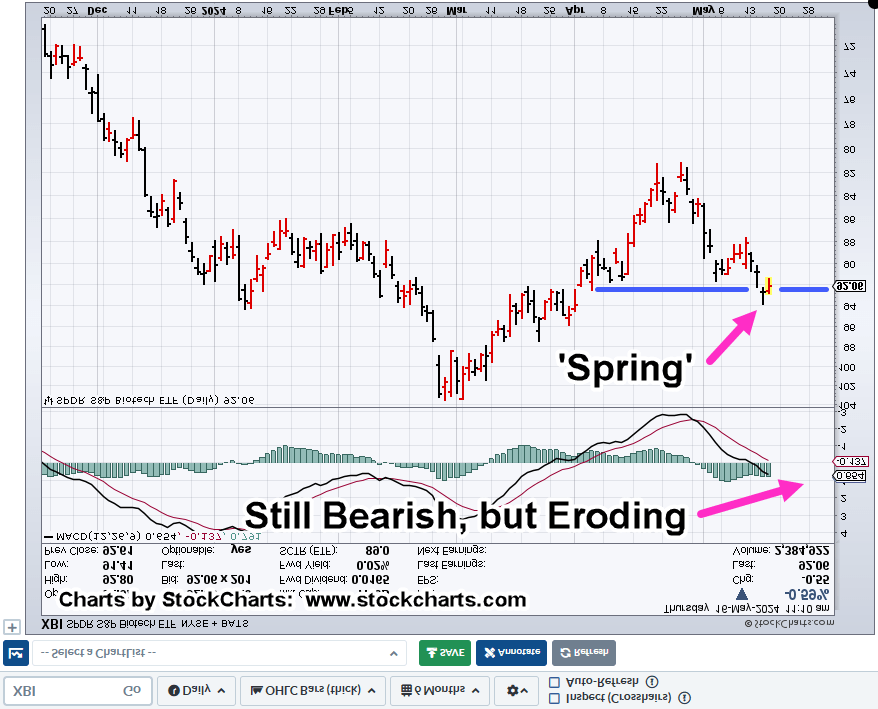
Moving on to the daily we have the following. Note, the daily has been inverted as well.
Biotech XBI, Daily (inverted)
From an MACD indicator standpoint, we’re still in bearish territory (bullish on the regular chart).
The entire trade set-up could evaporate.
So, there’s no doubt, we’re at The Danger Point®
From yesterday’s update the market itself has shown its stop level for a short position (not advice, not a recommendation).
Looking at the two charts, it’s possible to see a test of a spring on the larger weekly time frame which may itself have created a spring set-up on the daily timeframe: corresponding to up-thrust test, and up-thrust for non-inverted XBI.
Consider that this is all happening while the broader markets are making new all-time highs.
Note: Posts on this site are for education purposes only. They provide one firm’s insight on the markets. Not investment advice. See additional disclaimer here.
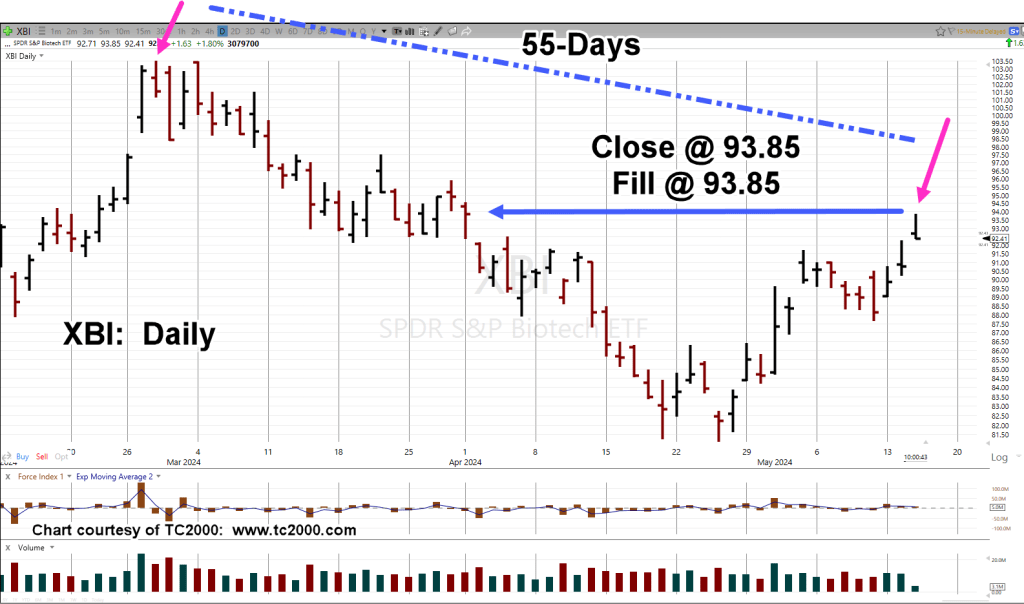
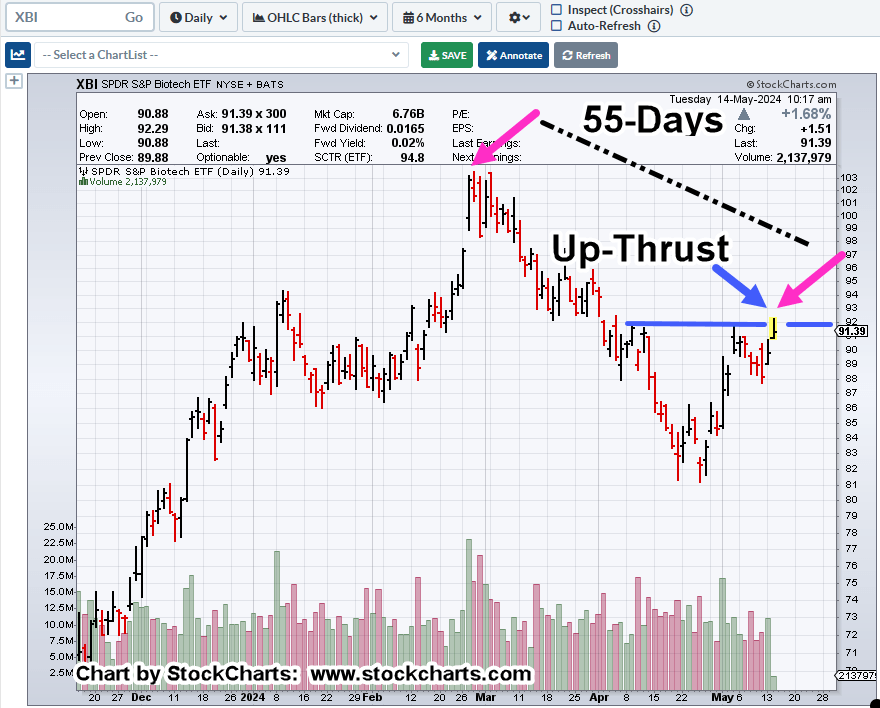
Was this morning’s launch higher in biotech a ‘gut-check’ of the up-thrust (set-up), or just filling the gap left from the April 2nd, move lower?
The Fibonacci 55-Day, count remains intact as it moves from the closing high of February 27th, to the ‘print’ high of the 28th.
As of this post (10:40 a.m., EST), XBI has already retraced back to the top of yesterday’s trading range.
As we look at the chart, it’s important to note today’s early session high was 93.85, the exact closing price of the ‘gap’ created on April 1st, and 2nd.
Biotech XBI, Daily
If this action really is just a test of the larger scale up-thrust (described here), one gets the sense a significant move lower may be at hand (not advice, not a recommendation).
We’re just over an hour into the session and XBI has posted a clean reversal bar for the first hour.
In the event there’s no significant move lower, and the set-up fails, today’s high represents a good stop level for a short position (not advice, not a recommendation).
Note: Posts on this site are for education purposes only. They provide one firm’s insight on the markets. Not investment advice. See additional disclaimer here.
“However, it’s just a sneaky suspicion, XBI may try to inch itself past the daily highs of April 9th, and April 11th (not advice, not a recommendation).”
Fast forward to now and here we are.
We’re at Fibonacci 55-Days, from the closing high on February 27th; today’s price action opened the session by penetrating highs of April 9th and April 11th.
Doing so, puts XBI in up-thrust (potential reversal) position.
Biotech XBI, Daily
We can say, XBI is at The Danger Point®
As this post is being created (10:34 a.m., EST) price action appears to be eroding from the early session push higher.
The typical market characteristic for XBI, is to retest in the second hour or so of trading; in this case that would mean a move back to the highs.
If that does not happen, it adds weight to the potential reversal scenario (not advice, not a recommendation).
Note: Posts on this site are for education purposes only. They provide one firm’s insight on the markets. Not investment advice. See additional disclaimer here.
When we last left biotech XBI, a push higher into a potential stop-zone was expected, link here.
‘The tape is always right’ as they say, and price action, somewhat unexpectedly, blew past those stop levels.
At this point (12:27 p.m., EST) we’re nearing the 50% retrace on the XBI. That level is somewhere around XBI, 92.28-ish. Currently XBI is trading at 90.12, about 2-points away.
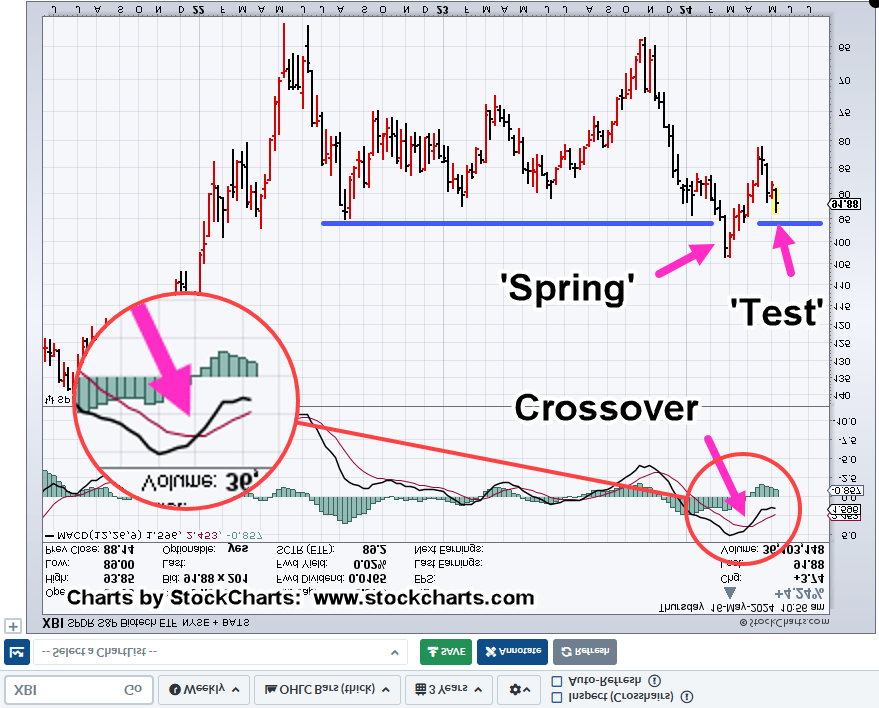
We’ll do a little experiment with the weekly chart by inverting it to show the longer-term view.
Biotech XBI, Weekly (inverted)
Note the MACD lines are still crossed to the upside.
One way to look at the action is that we’re in a test of the spring set-up (up-thrust, non-inverted).
The retrace to the 50% level may have already happened with last Friday’s action.
However, it’s just a sneaky suspicion, XBI may try to inch itself past the daily highs of April 9th, and April 11th (not advice, not a recommendation).
Note: Posts on this site are for education purposes only. They provide one firm’s insight on the markets. Not investment advice. See additional disclaimer here.
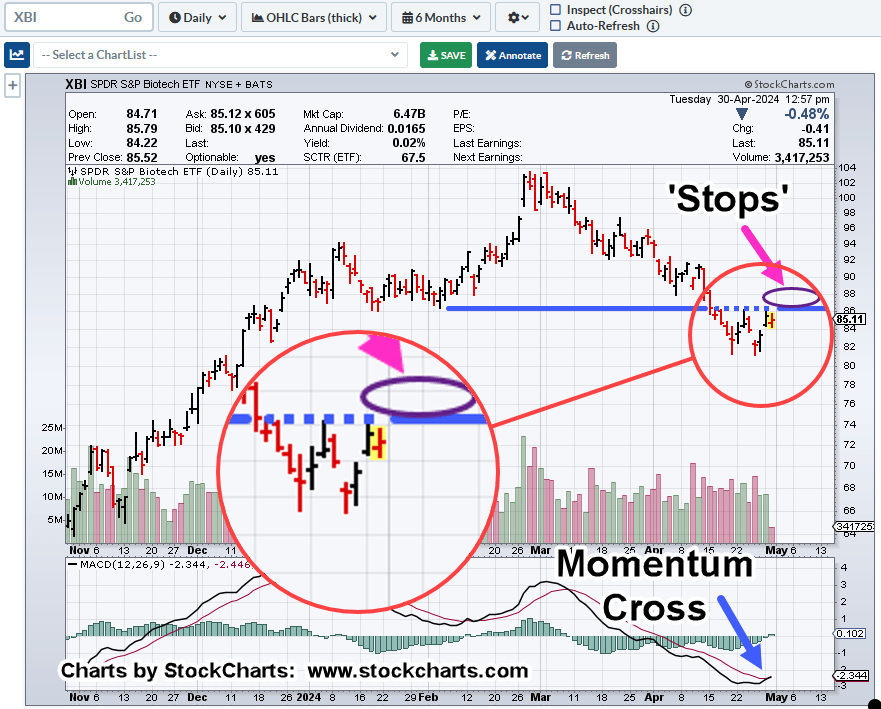
As former floor trader Richie Naso says, ‘You have to think like a criminal’ (time stamp 10:50).
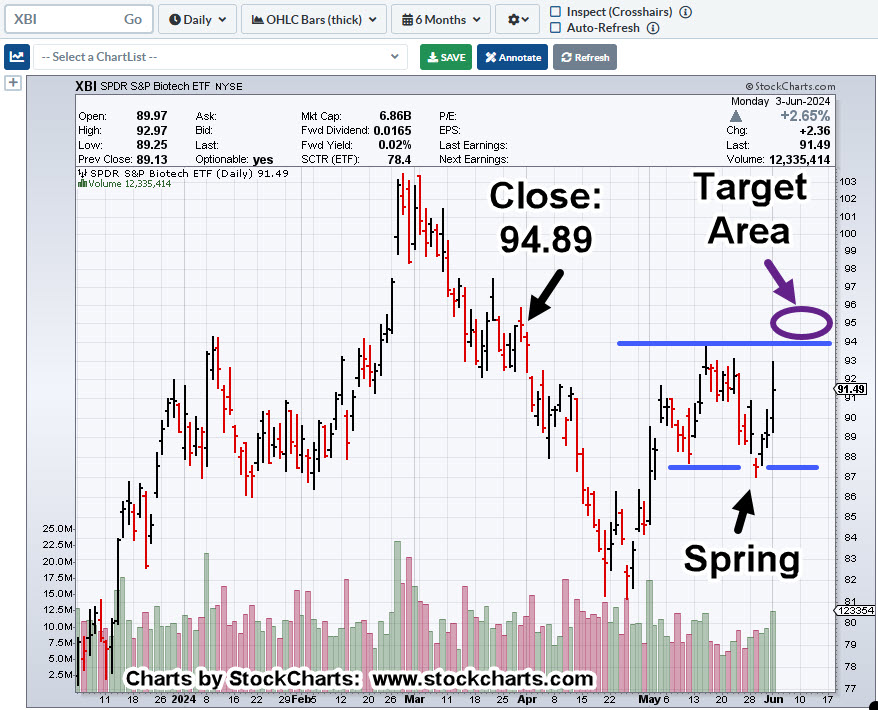
Using his example, a market-maker executes orders ‘to create liquidity’; where on the chart of biotech XBI (below), would that bundle of ‘order’ liquidity exist?
Biotech XBI, Daily
The purple oval shows where there’s a potential of congregated ‘stops’.
Also note, the MACD cross.
This trigger signal is on the Daily MACD, only as the weekly shows longer term momentum continues lower (not advice, not a recommendation).
At this juncture, XBI has broken out of previous trend channels and so, we have a new construct.
Positioning
Presently, I have no open positions in biotech (not advice, not a recommendation).
Back in the day, I would likely be holding short, placing my stops exactly at the location of the purple oval.
Let’s see if the market searches out my old stop location that if hit, would have taken me out of position (via LABD) right in time for a potential reversal to the downside. 🙂
Note: Posts on this site are for education purposes only. They provide one firm’s insight on the markets. Not investment advice. See additional disclaimer here.
If there’s one market attracting huge numbers of grifters, carpetbaggers, peddlers, and all-around crazies, it’s precious metals.
I’ve been hearing from this crowd, ‘the government’s going to collapse, the dollar’s going to collapse’, since the early 1980s.
As said many times before, I like precious metals as much as the next guy.
However, from a strategy standpoint, with each passing day, we see it’s the food supply (here, and here) that comes first (not advice, not a recommendation).
What’s currently taking place is so much more complicated (in my opinion) than just ‘stacking’.
Let’s not forget the flood of ‘fake’ or ‘diluted‘ precious metals and other chicanery; like having your coin-shop bank account closed for no apparent reason.
Well, we have to keep the loonies on the path which brings us to our case in point, Newmont Mining, NEM.
Newmont, Good News is Bad News
Gold price has moved higher over the past four to five months and expectedly, that’s been noted in Newmont’s latest Quarterly release, link here.
NEM, stock price at ‘nine-month highs’, what’s not to like?
It’s when we look at the chart, we see a different story.
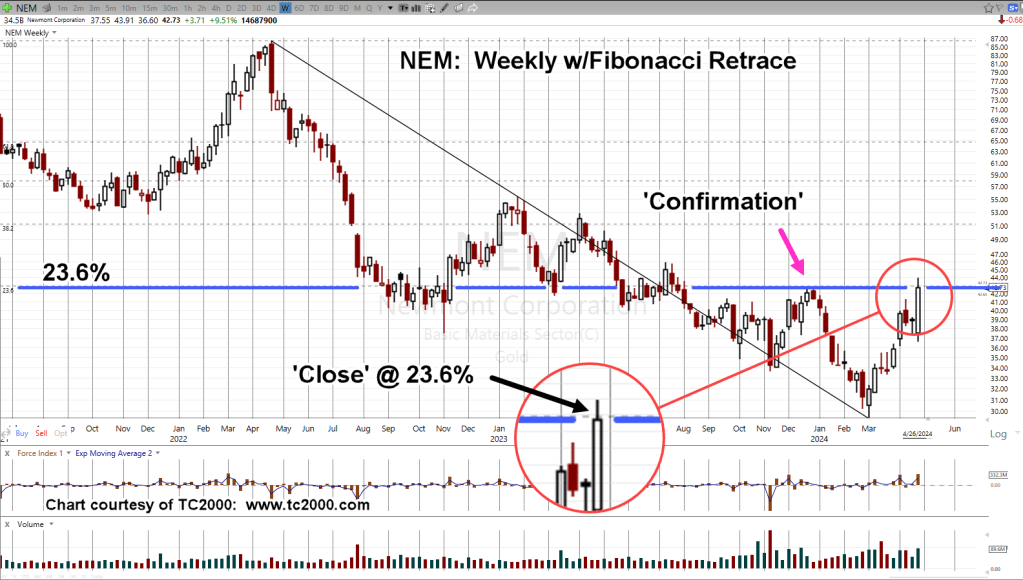
Newmont Mining, NEM, Weekly
After all the ‘good news’, NEM has only retraced an anemic 23.6%, of its overall downside move.
Note the close on Friday was right at the 23.6% level, giving it even more significance.
This level has also become an ‘axis line’ as exhibited by price action going back to August of 2022.
By The Numbers
When looking through the major sectors, retrace (and reversal) from 23.6%, is becoming more frequent.
Two other indices posting and reversing from that level (measured from recent highs), are biotech XBI, and real estate, IYR.
NEM, What’s Next?
Thursday, 4/25, was a wide bar with heavy volume.
We’ve stopped at the retrace, which is also resistance, confirmed by price action in late December. ’23.
A reasonable expectation is NEM, retraces, testing the wide bar and volume before continuing to the downside or moving back higher to a breakout (not advice, not a recommendation).
Note: Posts on this site are for education purposes only. They provide one firm’s insight on the markets. Not investment advice. See additional disclaimer here.
Note: Posts on this site are for education purposes only. They provide one firm’s insight on the markets. Not investment advice. See additional disclaimer here.
How do you know if it’s a countertrend move, or an outright reversal?
Do you stay with the trade or, as Dr. Elder said, ‘do you just take the money and run?’
For biotech XBI, it’s been a nasty two days of upside for any short positions, but the real question is, are we there yet?
Looking at the charts below, you’ll have to decide for yourself.
However, from my perspective, it’s possible that ‘today is the day’; meaning, we may be at the top of the correction (not advice, not a recommendation).
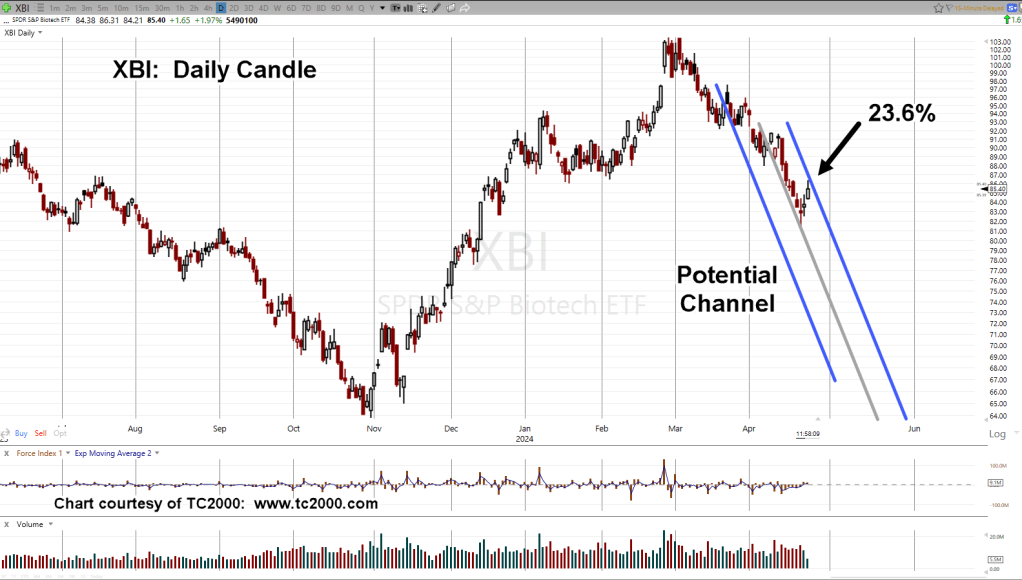
Biotech XBI, Daily
The chart is self-explanatory.
From the day a ‘change of character’ was identified to last Friday’s low, is a Fibonacci 21 days.
From that low to today, is a Fibonacci 3 Days.
We’ll compress the chart scale for a bigger picture view of the current action.
Also included is the grey centerline, showing the channel has a symmetrical ‘look’.
Also note, we’re at a 23.6%, retrace at the day’s high (thus far) and price action appears to be eroding downward.
Note: Posts on this site are for education purposes only. They provide one firm’s insight on the markets. Not investment advice. See additional disclaimer here.