Pre market activity (8:31 a.m. EST) has TLT trading up +0.74, at 161.29, which is above the target level set in the last update.
We’ve already laid the groundwork for the ‘speculator’s’ short position in bonds as the largest in history.
It’s the ‘commercials’ that know their markets and in this case (according to Steven Van Metre), the commercials are the banks.
Isn’t it interesting. The banks always get their money, right?
Well, that may be about to happen now, as well.
Just a quick digression from today’s update and concerning the Van Metre link above. At time stamp 14:29, he shows a Wyckoff accumulation schematic. Nice.
From a trading standpoint, there are leveraged bond funds such as TMF (not advice, not a recommendation).
However, this firm has never traded that vehicle and is choosing to be short the junior gold miners (JDST) as well as long natural gas (UNG) for its current positioning.
Natural gas (UNG) for a seasonal trade … with some potential supply disruptions thrown in; the Junior Gold Miner short position (JDST) to work the ‘deflation’ side of what’s going on.
Reports here and here, provide documentation on the thinking behind those positions. Searching for UNG and JDST will give the full gamut of research.
Back to the markets. If we’re doing our job right and there’s a huge down-draft, we’ll already be in position to profit as a matter of course.
Note: Posts on this site are for education purposes only. They provide one firm’s insight on the markets. Not investment advice. See additional disclaimer here.
Note: Posts on this site are for education purposes only. They provide one firm’s insight on the markets. Not investment advice. See additional disclaimer here.
Note: Posts on this site are for education purposes only. They provide one firm’s insight on the markets. Not investment advice. See additional disclaimer here.
Note: Posts on this site are for education purposes only. They provide one firm’s insight on the markets. Not investment advice. See additional disclaimer here.
Note: Posts on this site are for education purposes only. They provide one firm’s insight on the markets. Not investment advice. See additional disclaimer here.
As reported by Steven Van Metre, here, the long bond speculators have an historic, all-time massive short position.
He shows their net position is four standard deviations away from norm. The chart he references can also be found at Zero Hedge, here.
So, just how significant is that?
The bell curve chart shows the typical 3-standard deviations cover 99.97% of all data observations.
We may as well say that four standard deviations cover all data: 100%.
The speculators are so convinced bond price are going lower (interest rates up), the have amassed a huge position.
Now, it gets interesting.
The chart below of TLT (long bond), has bonds currently declining in a measured move that projects to the 152.5-level. Feeding into the speculator’s positions (giving them a gain thus far).
We also have a Fibonacci time sequence in effect for TLT.
It that’s met in the coming week (and we get a new low), it will be a Fibonacci 34 weeks from the high set during the week of March 13th.
If TLT penetrates the low set on Week 13, and depending on how far below support that penetration goes, it will set up a Wyckoff spring condition … setting up the TLT to move higher.
Moving higher is against the speculator’s positions. They are short and the index would be moving up.
It could potentially be the largest short-squeeze of all time.
If that happens, think about what will happen to the markets, the dollar and the precious metals markets.
Note: Posts on this site are for education purposes only. They provide one firm’s insight on the markets. Not investment advice. See additional disclaimer here.
The entire precious metals sector may be about to take an unexpected hit.
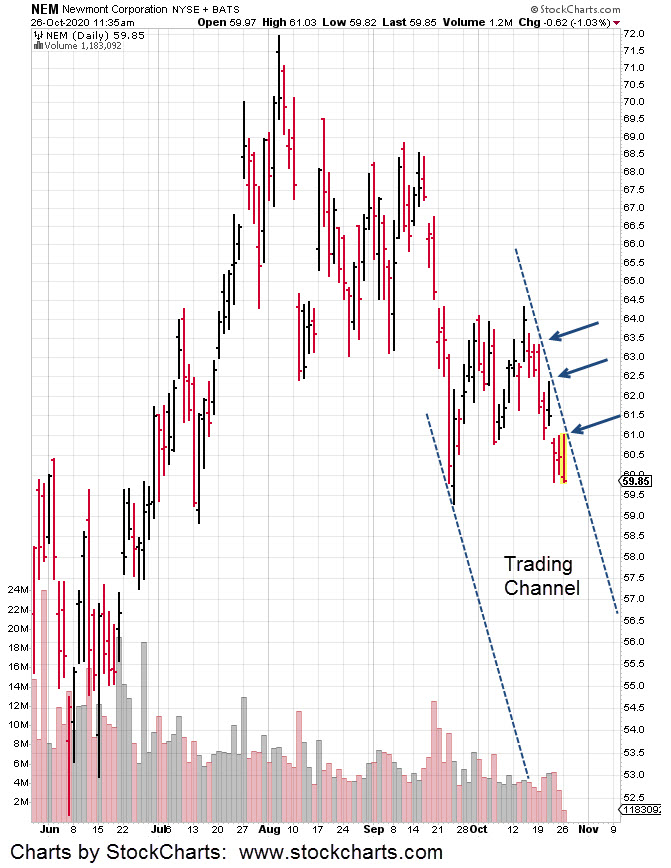
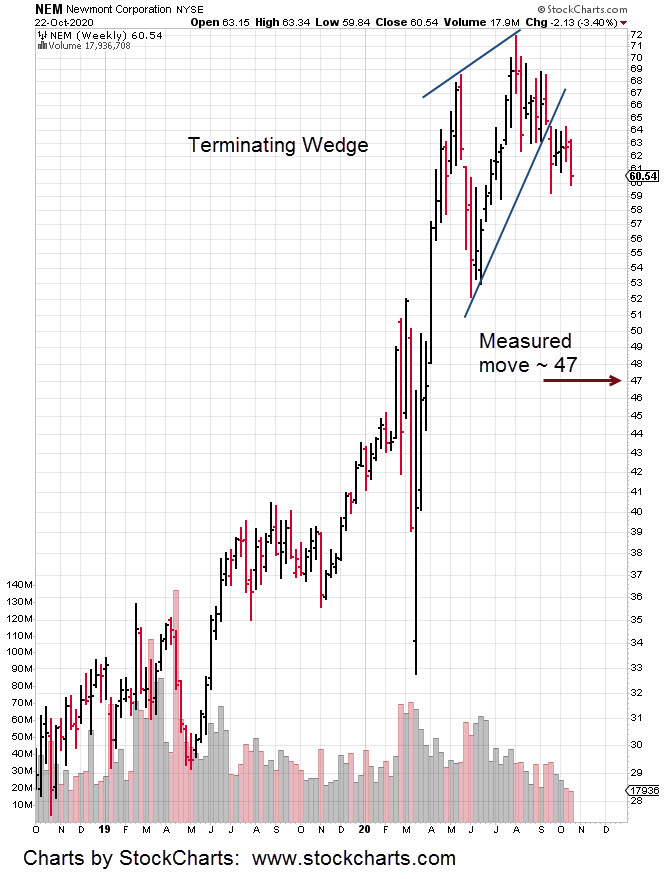
Prior updates have discussed the Newmont (NEM) bearish divergence and reversal. This update shows a rising wedge breakout to the downside.
Using standard analysis techniques on the chart below, we get a measured move to the vicinity of 47 for NEM.
A decline of that magnitude, a drop of over 22%, may be the catalyst for a whole other bearish scenario.
Just based on empirical observation and analysis generally available (YouTube, et al), it’s pretty safe to say that no-one is prepared for a significant decline.
Well, almost no-one. As reported back in late September, the only YouTube analyst (that was located) proposing the idea of a decline was Sajad, in this report.
Note: Posts on this site are for education purposes only. They provide one firm’s insight on the markets. Not investment advice. See additional disclaimer here.
Note: Posts on this site are for education purposes only. They provide one firm’s insight on the markets. Not investment advice. See additional disclaimer here.
Let’s walk through the junior gold miner’s index (GDXJ), reversal one step at a time.
The following discussion refers to the five number points on the daily chart below.
Before we start … the stage was already set over the weekend with the ‘Newmont’ update. We showed that it’s in reversal.
The junior index (GDXJ) does not look obvious at this point. In the markets things (usually) never look clear-cut at the exact inflection point.
Let’s begin:
First, the gold miners have been in an uptrend along with the rest of the markets since the recent bottom in March of this year.
Data Point No. 1
Price action penetrates deep below established support with the second largest down volume shown on the chart. This can be interpreted as either a shake-out or the beginning of distribution.
The next day has a reversal bar that closes right at the support level. Volume is heavy, but not as heavy as the prior down session.
The day after that, the inside day, is the first indication that something’s wrong. If this index is really in a screaming bull market it’s not going to allow anyone to get aboard comfortably.
The following days show price action laboring to move higher until the next down-thrust.
Data Point No. 2
The down thrust pushed just below the support level shown and closed lower. Again, the next day is a tight range inside day … instead of a sharp move higher.
This action is more indication there’s not enough demand to push prices immediately higher.
Note: When price action penetrates support, it sets up what’s called a Wyckoff ‘spring condition’. It’s a market set-up where prices are expected to rise dramatically.
Instead of dramatic, it took four trading days for GDXJ to rise into the next data point.
Data Point No. 3
We’re at previous resistance and we can see price action stall. It then retraces back to the 57-area (black dashed line), and made another attempt at an upside breakout.
That attempt only lasts one day before we begin a decline into the next data point
Data Point No. 4
Price action pushes below the previous minor support at the 57-area and forms a reversal bar … which was yesterday. That brings us to today.
Data Point No. 5
Another attempt to breakout higher results in what looks like at this point, a failed attempt.
This is the danger point.
Price action closed off the high of the day. This indicates there’s not enough demand to keep the close at higher levels.
It’s at this location, a short position was opened (not advice, not a recommendation) via JDST with a stop near the day’s low (for JDST).
It’s a tight stop.
The expectation is for price action in GDXJ to decline from these levels.
We’ve shown how there is not enough demand to drive price higher. The cacophony of so called hyper-inflation ‘experts’, is all part of the picture.
If everyone’s long silver/gold miners … who’s left to buy?
Note: Posts on this site are for education purposes only. They provide one firm’s insight on the markets. Not investment advice. See additional disclaimer here.
When in an uptrend and prices start to flag, it’s a warning that energy is lost.
The Newmont update showed the heavy hitter was in a reversal. That update gave specifics on how or when the reversal would be negated (and back into an uptrend).
It’s not happening. The upside hasn’t showed … or, at least not yet.
The next trading day, Newmont (NEM) lost 1.5%. The day after that (yesterday), was another down day with a loss of nearly 1%.
Today, NEM is attempting to move higher. However, the weekly bar is still in reversal.
The mining indexes themselves are not so clear. The junior index with its weekly chart below, has it reversing last week and now attempting to move higher.
It’s losing steam. It’s no secret that failed moves can be the most dynamic of all price action.
The market is ‘supposed’ to go one way … in the case of the silver/gold miner’s, they’re supposed to be moving higher; Hyperinflation and everything, right?
What if everyone’s on the wrong side of the trade?
What if the expected hyperinflation is years away?
This juncture right now, appears (not advice, not a recommendation) to be a low risk area to go short.
In the case of the junior index GDXJ, if price action closes up for the week, the bull market may continue.
If not, and GDXJ closes down for the week, the up-trend looks like it’s failing and the entire sector could fall apart.
Note: Posts on this site are for education purposes only. They provide one firm’s insight on the markets. Not investment advice. See additional disclaimer here.