Gold … The Show Begins

Popcorn Ready … Asylum Freaks Out

You would think everybody’s escaped.

We have this link and this one and probably many more.

Those who’ve been monitoring this site already know, today has been in the planning stages for months.

This post was the first one to discuss the target area for a reversal in gold (GLD).

So, here we are.

So-called inflation is running rampant and it looks as if everybody’s in agreement.

Well, almost.

Turns out there’s a guy in the Pacific Northwest, a ‘boots on the ground’ type that sells lumber for a living.

Uneducated Economist never waivered on the fact, prices are rising as a result of supply constraints and not inflation.

There was one more as well.

Steven Van Metre has given his take on current monetary policies; they’re deflationary.

It’s a minority view.

Either way, we’re about to find out the truth.
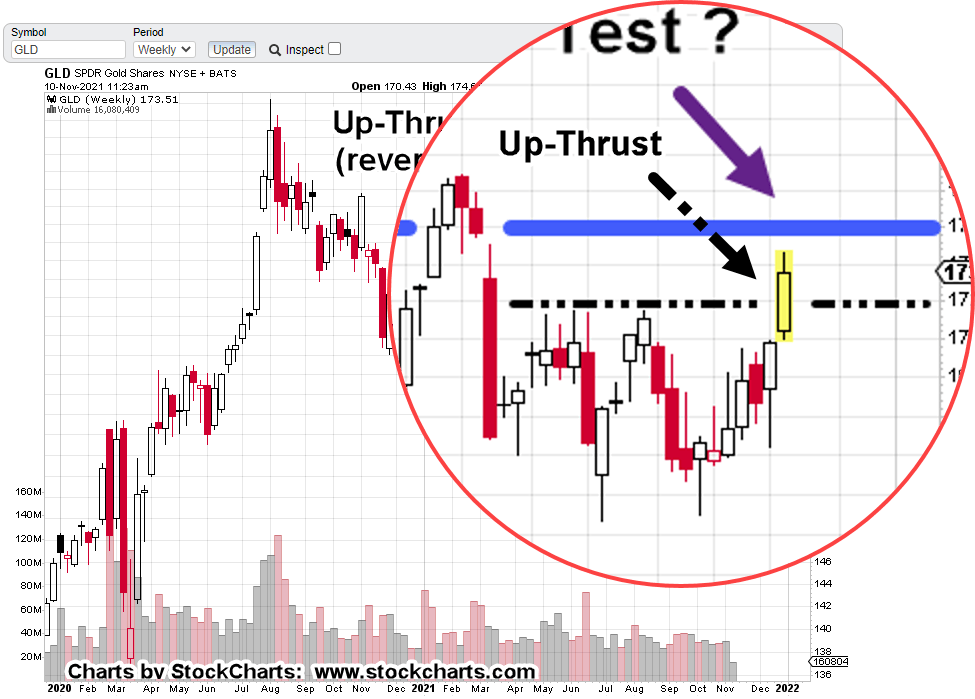
Gold (GLD) Analysis

The fact GLD, has reached a target identified two months ago, gives credence to a potential reversal.

We’ll start first, with the un-marked weekly chart of GLD:

Now, the mark up:

It looks like we have a test of the original Up-Thrust (reversal).

In addition, today’s action (above black dashed- line) is another Up-Thrust.

Is this a reversal, within a reversal ?

The chart below zooms in on that area:

Everyone has their own investment/trading time-frame and method.

There’s no doubt, gold (GLD) is at the danger point. Price action can go either way.

Positioning:

The ‘inflation’ links above highlight current psychology and sentiment. The bull trap may be set.

As of this morning, we’re already positioned short this sector via DUST (not advice, not a recommendation).

Note:

A push below today’s DUST low of 17.27, does not necessarily negate the trade but it does (or will) bring it under scrutiny for potential exit (not advice, not a recommendation).

Stay Tuned

Charts by StockCharts

Note:  Posts on this site are for education purposes only.  They provide one firm’s insight on the markets.  Not investment advice.  See additional disclaimer here.

The Danger Point®, trade mark: No. 6,505,279

Ventas … Rolling Over

Demographic Impacts & Price Action

The very first sentence at the Ventas website, linked here (under ‘portfolio’ statements) may no longer be true.

With ‘official’ data essentially suspect, we won’t know what’s left of the ‘ageing population’ until far in the future.

This winter (what used to be the regular flu season) will/should give some indication of just how much the customer base of Ventas has literally disappeared.

Looks like price action has already decided and is rolling over … even while the overall markets continue to press at or near new highs.

Stay Tuned

Charts by StockCharts

Note:  Posts on this site are for education purposes only.  They provide one firm’s insight on the markets.  Not investment advice.  See additional disclaimer here.

The Danger Point®, trade mark: No. 6,505,279

Gold Sellers Exhausted ?

According To The Latest Propaganda

It has to be this way.

As counter-intuitive as it sounds, for there to be a significant downside reversal in gold (GLD), the vast majority if not nearly all traders, speculators, and investors need to be on the wrong side of the trade.

Getting that crowd positioned without them realizing it, or being plain hypnotized like our asylum escapees, the gold bulls, helps get articles like this accepted by the masses.

The daily chart of gold proxy GLD, shows the potential target area for reversal.

This area has been a reversal target for months … since mid-September.

Working the markets in this way, that is, identifying a potential future condition for trend change, allows one to think about how it’s all going to go down.

Of course, consistent, incessant, propaganda along with bullish (asylum) hysteria is a must. 🙂

Just to be fair, sometimes and on a rare occasion, the crowd is right.

With that in mind, we’ll have to see how GLD price action behaves if/when it breaks through resistance.

Stay Tuned

Charts by StockCharts

Note:  Posts on this site are for education purposes only.  They provide one firm’s insight on the markets.  Not investment advice.  See additional disclaimer here.

The Danger Point®, trade mark: No. 6,505,279

Random Notes

The Usual Suspects For The Week

No. 1

Only The Beginning

Probably the best example thus far of what lies ahead.

At this site’s location in Central Texas, there’s been a so-called ‘clinic’ over the weekend.

A clinic to provide ‘protection’ to any that are still (at this late date) stupid enough to believe standard media reports.

There’s no joy in being correct about this subject.

However, at the same time and over the months … now running into years, attempts have been made to get the word out.

Way back in May of 2020, this update was published before most anything was fully known.

The conclusions came from intuition (discernment), coupled with empirical observation.

Family members have been notified. Church members notified; attempting to find anyone that would listen.

The typical response was:

I don’t want to talk about that right now.’

I don’t believe that.

‘You’re not a qualified source’.

So, what can you do?

Well, what this author’s doing, is providing leadership to those who want it.

That means, recognizing what’s coming (or what’s likely), positioning or trading in the markets for potential gain.

No. 2

The Real Bull Market

Right around mid-year last year, the product at this link was priced at $12.95.

That product is no longer available from the supplier as can be seen from the comment:

Going to this link, shows the product is not even listed.

If we go to this link, that same product if you can find it, now ranges from $49.94, to $119.95.

That’s an increase of 286% to 826%, in about eighteen months.

Going to this link and forwarding to time stamp 6:12, might get to the crux of why the product is not available or only available at a near 1,000%, increase in price.

No. 3

Keep It Simple … Be Proficient

In line with No. 2, we have this personal anecdote.

A couple of years ago, your author won a “Top Shot” contest at this location.

All told, the entire number of contestants was somewhere around thirty. At least two, were former or active military.

From my recollection, not one of them had what’s termed a 1911. That’s what I brought … along with one spare magazine that I carried in my pocket.

I did not have all the accoutrement gear they had; the khakis, the BDU’s, the boots … none of that.

I was in shorts and an Oxford-type shirt.

I did bring my Bianchi holster that I bought in 1984. So, I had that going for me. 🙂

Remember this?

Yes, it’s just a movie but it gets a point across. Proficiency equates to performance and that equates to survival.

If you have read this far, it’s likely you’re in the crowd that’s likely to survive or at least not go down without giving it your best.

Winning the contest proved that looks don’t amount for much when in the clutch.

What’s going on in one’s head along with the ability to carry it out, is the deciding factor.

Stay Tuned

Note:  Posts on this site are for education purposes only.  They provide one firm’s insight on the markets.  Not investment advice.  See additional disclaimer here.

The Danger Point®, trade mark: No. 6,505,279

Exxon: Higher, Still ?

Major Resistance At XOM: 69 – 70

XOM’s the largest cap in the sector. We’ll use it as the proxy.

Last update has us exiting a short via DUG (not advice, not a recommendation) and standing aside for now.

It’s no secret the overall markets are insane … possibly in some kind of massive blow-off, FOMO top.

At the same time, they look like they’re ‘thinning-out’; that is, only a few are participating in the upward launch.

It’s a bearish warning

Thinning-out, tends to happen at the end or near the end of bull markets.

Looking For The Short

The big money’s made on the downside with down moves being two or three times faster.

The Daily closing chart of XOM above shows it’ still grinding itself higher.

Trend lines below say the upside may be reaching a limit:

If we zoom-in, it looks like there’s significant resistance at the 69 – 70 area for XOM … if it gets that far.

Looking For The News

With the current instabilities, world events, food supply, energy supply, earthquakes, volcanoes, we could get some kind of upset to launch the oil sector higher.

It may not happen.

If it does, that could be the time to re-enter short (not advice, not a recommendation).

Stay Tuned

Charts by StockCharts

Note:  Posts on this site are for education purposes only.  They provide one firm’s insight on the markets.  Not investment advice.  See additional disclaimer here.

The Danger Point®, trade mark: No. 6,505,279

Update: Exit DUG

DUG Pressing The Lows … Standing Aside

Although this site is not a ‘service’, it is in good taste to be forthcoming on our market moves.

As said yesterday, there’s a lot of froth at the top. We’re certainly not going to hold a losing position into the weekend.

Exit was performed on DUG as shown.

Analysis to follow

Stay Tuned

Charts by StockCharts

Note:  Posts on this site are for education purposes only.  They provide one firm’s insight on the markets.  Not investment advice.  See additional disclaimer here.

The Danger Point®, trade mark: No. 6,505,279

Oil: Froth At The Top

XOP Down, XOM Up

Oil sector proxy XOP, posted outside-down (key reversal) while Exxon (XOM) closed higher.

If we’re in the middle of a reversal, this is normal.

Parts of the sector are already heading lower while typically, the larger caps are the last to complete the change.

This interview with Carter Worth, even though it’s short at only two-minutes thirty seconds, paints not-so-good picture.

He says in a typical scenario that’s repeated twice since the late April ’20 lows, oil has declined by 16% – 20%.

When asked how the equities would do, he hesitates, then says ‘It’s not worth the risk [to be long]’.

It’s a polite way to say they’re likely to get whacked.

Moderna (MRNA)

By now, everybody’s heard the news on Moderna.

Trouble for Moderna was spotted a while back and discussed in this post … along with a prediction that class-action may be forthcoming.

Our stopwatch is still ticking.

Positions

The account positions are short Oil & Gas XOP, using DUG as the vehicle (not advice, not a recommendation).

So far, its been a lot of banging around without much progress either way. However, at this point, a new low for DUG, below today’s low would signal trouble for the short side.

Stay Tuned

Note:  Posts on this site are for education purposes only.  They provide one firm’s insight on the markets.  Not investment advice.  See additional disclaimer here.

The Danger Point®, trade mark: No. 6,505,279

Exxon Breaks Trendline

Sector Reversal Case Builds

While the overall markets move higher, XOP continues lower and Exxon (XOM) just broke its trend-line to the downside.

XOM is the largest cap in the Oil & Gas Exploration Sector.

We’re using XOP as the proxy and DUG for leveraged inverse.

Over the next day or so, we could get an underside test of the break. However, it was not really dramatic.

With all eyes on other markets like S&P, Dow, Q’s and so on, XOM may just decide to drift on lower …

Positioning:

At this point, there’s nothing that says to cover shorts by exiting DUG (not advice, not a recommendation).

The trade is progressing. So, we’re going to leave it alone.

Stay Tuned

Charts by StockCharts

Note:  Posts on this site are for education purposes only.  They provide one firm’s insight on the markets.  Not investment advice.  See additional disclaimer here.

The Danger Point®, trade mark: No. 6,505,279

‘Stealth’ Reversal, Oil

XOP Lower Open, Signals Weakness

Nobody’s Looking

A higher XOP open would have probably been a short set-up (DUG) failure.

However, that’s not what happened.

The open was lower but then price action went on to post a new daily high above yesterday’s.

At this juncture, the short set-up is still valid (not advice, not a recommendation).

How can a new daily high be acceptable for a short position?

Repeating Set-Up:

Back in August this post was created to help document a market behavior that’s probably been repeating since the beginning.

My former mentor, David Weis used to call it ‘Spring to Up-thrust’, using Wyckoff’s terminology.

The fact the set-up’s been repeating for decades, if not a century or more, is definitive proof traditional valuations and fundamentals have nothing to do with actual price movement.

That’s a topic for another time.

XOP Analysis:

We’ll start with an un-marked XOP daily chart:

It doesn’t look like much is going on. So, let’s zoom into the far right side using the 15-minute, below:

Ok, what am I supposed to see?

Marking up the chart, we have the following:

Once we have the correct annotations, it’s obvious XOP just posted a ‘Spring to Up-thrust’.

True, it’s on a minor time frame like the 15-minute; however, it does give a clue XOP, could be in for a more significant and longer-term reversal (not advice, not a recommendation).

Positioning:

If XOP is somehow able to post another new daily high during this session or subsequent, most likely it would be time to exit our short position (via DUG, not advice, not a recommendation).

For now, the expectation’s for continued oscillation below today’s high … while XOP figures out if that’s all there is for the up-side.

Stay Tuned

Note:  Posts on this site are for education purposes only.  They provide one firm’s insight on the markets.  Not investment advice.  See additional disclaimer here.

The Danger Point®, trade mark: No. 6,505,279

Oil Sector Tests Reversal

Deep Test For XOP

XOP is either in a deep test at the Fibonacci 76.4%, retrace level (distance between black lines), or it’s getting ready to post new recovery highs.

Volume was moderate with no overt indication either way.

A higher open at the next session would most likely indicate trouble for a short position (not advice, not a recommendation).

However, one has to realize we’re at extremes in price and most likely sentiment as well.

Looking at the weekly gives a better perspective:

Positioning:

We’re keeping the finger close to the sell button (for inverse DUG) but are not convinced the short set-up has been invalidated (not advice, not a recommendation).

Price action’s at a confluence of trend lines and resistance. Some type of trend confusion is to be expected.

Stay Tuned

Charts by StockCharts

Note:  Posts on this site are for education purposes only.  They provide one firm’s insight on the markets.  Not investment advice.  See additional disclaimer here.

The Danger Point®, trade mark: No. 6,505,279