Gold Output Miniscule, On World Stage

A military coup in Niger results in gold shipment suspension.
Correspondingly, the mining sector along with gold and silver, are higher.
The real question is, will gold, silver, and the miners continue upward or is this just an excuse to force out the weak (short-positioned) hands?
If we look at the facts, such as Niger’s gold output compared to the rest of the world, it’s miniscule; hardly a blip and production is decreasing.
Add in, the mining sector has not been in a bull market for years, and we’ll surmise, the current move higher has low probability of continuing (not advice, not a recommendation).
For today’s session (as of 3:11 p.m., EST), price action has effectively been slammed into resistance as shown.
Junior Gold Miners GDXJ, Daily
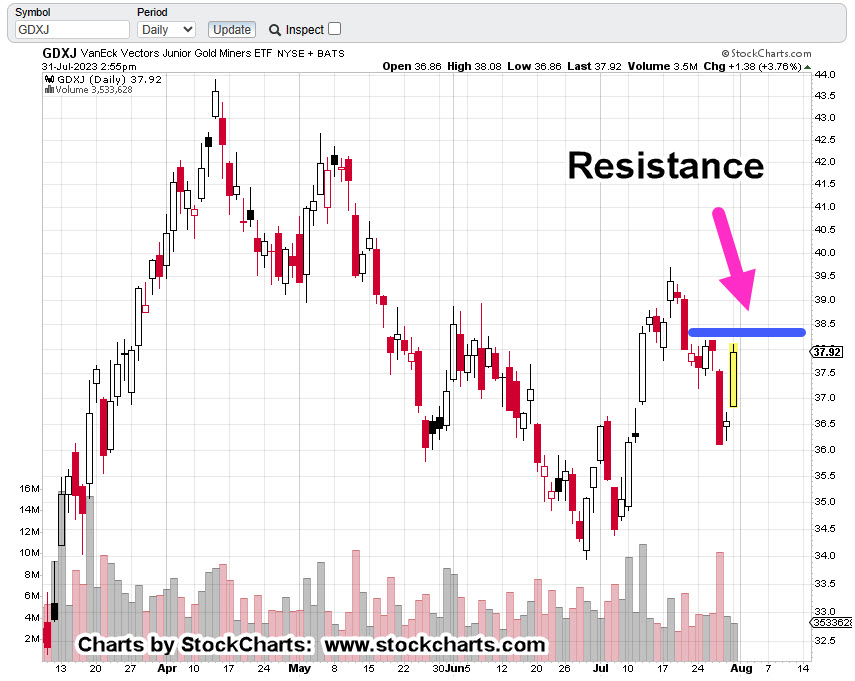
For positioning short (via JDST) this is potentially a low-risk area (not advice, not a recommendation).
There would need to be continued demand for a move higher past the resistance area (blue line).
Stay Tuned
Charts by StockCharts
Note: Posts on this site are for education purposes only. They provide one firm’s insight on the markets. Not investment advice. See additional disclaimer here.
The Danger Point®, trade mark: No. 6,505,279