Note: Posts on this site are for education purposes only. They provide one firm’s insight on the markets. Not investment advice. See additional disclaimer here.
Since the A.I. money’s already been made on the upside, it could be time for the bears to set the hook on the shakeout, driving the Semiconductor sector farther down.
This just out from the Mises Institute; author Justin Murray argues, A.I. is essentially an expensive hype, that’s run its course.
With that, we’re not going to belabor whether A.I., is a bubble, a scam, a grift, or not.
No, we’ll let the price action itself make the case. 🙂
It’s hard to argue with the reality of the chart
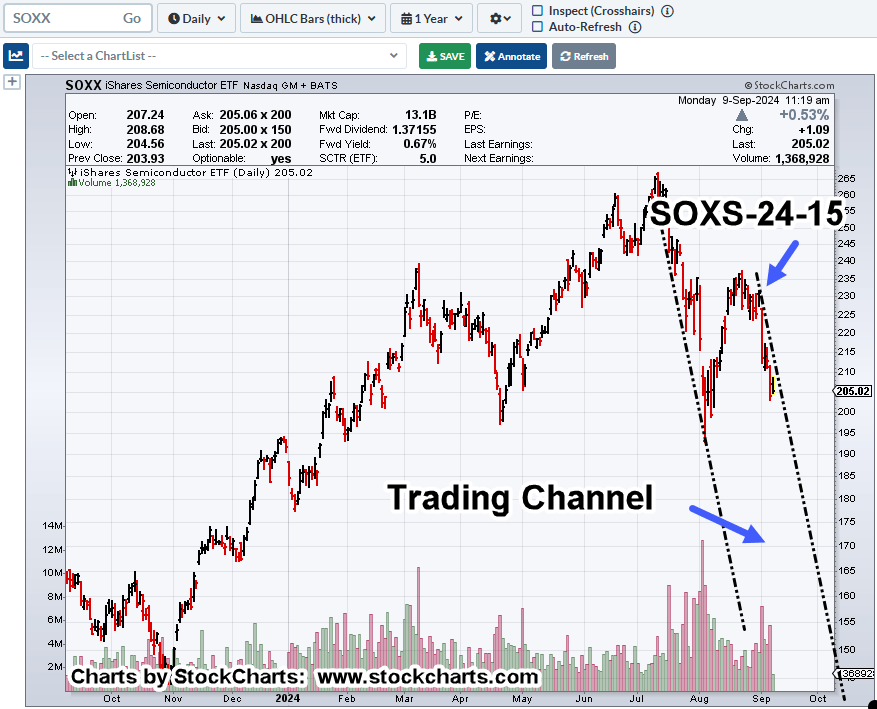
Semiconductors, SOXX, Daily
If the trading channel remains in effect, we can see the downside potential is enormous (not advice, not a recommendation).
The arrow shows the entry location of the current, active short: SOXS-24-15.
Since that initial entry and with nearly each price rebound, the short size has been increased (not advice, not a recommendation).
Stops Are Tight
It’s important to note, as of this post (11:38 a.m., EST), the SOXX has not (yet) made a new daily low.
In the markets anything can happen. We could always get an upside reversal.
However, from a seasonality standpoint, September is typically the worst (downside) month of the year.
Note: Posts on this site are for education purposes only. They provide one firm’s insight on the markets. Not investment advice. See additional disclaimer here.
Note: Posts on this site are for education purposes only. They provide one firm’s insight on the markets. Not investment advice. See additional disclaimer here.
Those who ‘drank the Kool-Aide’ about silver being bolstered to astronomical heights because, you know, ‘solar energy’, must be a little upset by now.
Just like the fabled ‘interest rate cut’, it’s not happening.
Although for interest rates, we’re just shy of two weeks away to find out; meanwhile, since the last report, the bond market has been bid up again, pushing rates down (again), so, we’ll see.
Back to silver.
We have yet another so-called ‘green energy’ company going bankrupt. That’s not so much news, except for this statement from the report (paraphrasing):
‘Solar demand has declined across the entire industry’
Um, it’s called an economic depression (not advice, not a recommendation).
While we’re talking collapse, let’s just throw in the Chat GPT (Artificial Intelligence) collapse as well, link here.
With all of that as the backdrop, let’s see what silver is up to these days.
Silver, SLV ETF, Weekly
A terminating wedge with an MACD crossover.
We’re at the spot with price could go either way. There has been no wedge breakout to the upside, or down.
If we do get an upside breakout, the position of the MACD is set-up for a potential bearish divergence.
Covered many times on this site; the possibility that precious metals could move higher as a result of the miners imploding.
Adding to that idea are the components of tracking SILJ, silver miner EFT. How many of these outfits have an actual P/E?
PAAS does not, HL … no, CDE … no, NEXA … no, GORO … no, and on it goes.
Note: Posts on this site are for education purposes only. They provide one firm’s insight on the markets. Not investment advice. See additional disclaimer here.
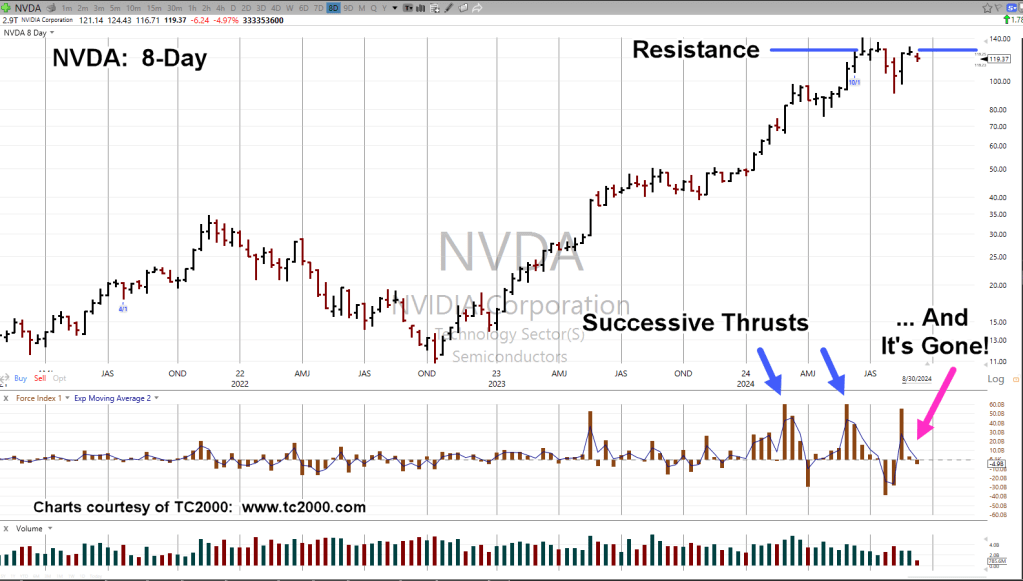
Just like the image at left, Nvidia looks like it’s ‘strapped in’, for the ride down (not advice, not a recommendation).
The upside doesn’t last forever and neither does the downside … unless of course, you go bankrupt. 🙂
With that, let’s see where Nvidia may be going.
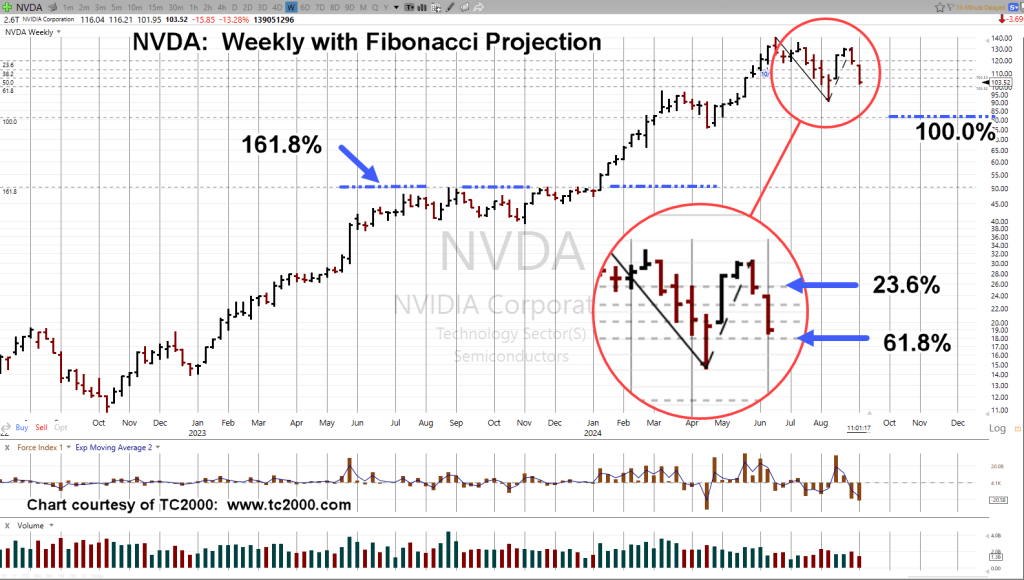
Note: Recall, the potential for a top, was identified two weeks ahead of time, then confirmed.
Nvidia NVDA, Weekly
We’ll cut straight to the chase and show how price action is ‘respecting’ the Fibonacci projections (thus far).
With price action in the SOXX, confirming yesterday’s trendline ‘artistic license‘ post, at this point, it appears the downside for the sector is well underway (not advice, not a recommendation).
Note: Posts on this site are for education purposes only. They provide one firm’s insight on the markets. Not investment advice. See additional disclaimer here.
Back in the day, Robert Prechter Jr., said it himself (paraphrasing):
‘You can reap a windfall, just by monitoring a trendline’
Of course, the hard part is identifying the trendline … if there even is one.
Implied with that, already being in position to take advantage of that trendline.
Building The Trade
Positioning short in the SOXX (via SOXS) has been a process of iteration; from SOXS-24-12, until now, SOXS-24-15 (not advice, not a recommendation).
All of those trades have been documented on this site.
Note: Enter the trade number (or, copy-paste) into the search window and then click on the sidebar to get chronology of all posts related to that trade.
With the SOXX, opening down, yet again, one has to ask; is there a trendline and if so, where is it?
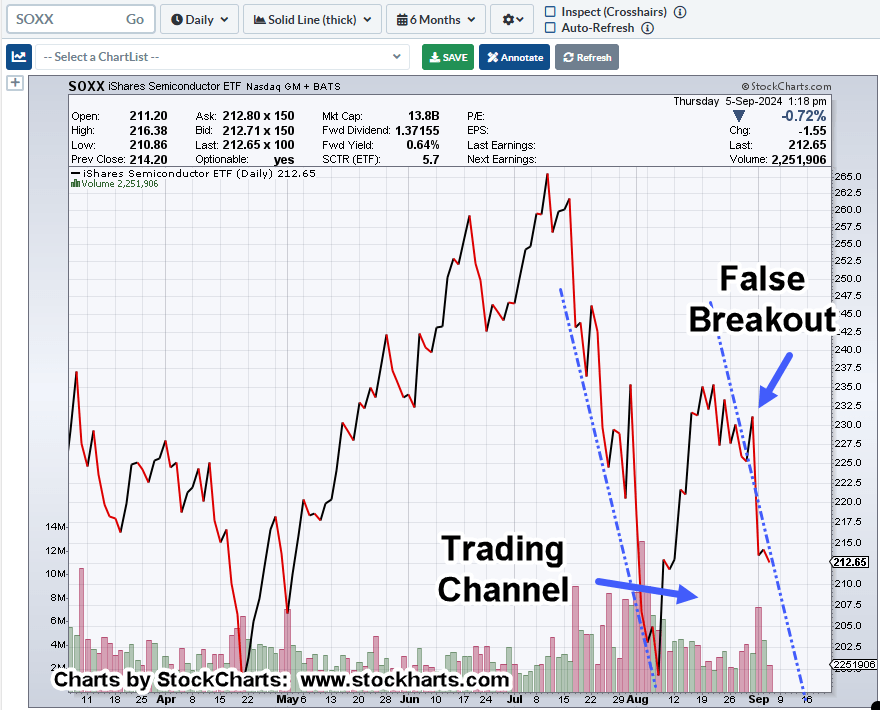
Semiconductors, SOXX, Daily Close
I’m taking artistic license to draw where I perceive is the current right-side trendline.
Also note, this update is being released with about 90-minutes left in the session.
The closing price is yet unknown.
Going forward, price action itself will either confirm or negate the right side.
Positioning
As shown on the chart, the current (active) short trade, via SOXS, was opened last Friday at the ‘False Breakout’ (not advice, not a recommendation).
With price action continuing lower, it would be nice for this position to become a boring series of actions; moving the stop until the trend break and/or exit.
All the while, keep in mind, we don’t know what our ‘October Surprise’ is going to be … yet.
Note: Posts on this site are for education purposes only. They provide one firm’s insight on the markets. Not investment advice. See additional disclaimer here.
Those ready (positioning) for this potential historic reversal in the major indices, are at long last getting the sense, ‘The jig is up’.
As Dr. Elder has said, ‘the markets will hypnotize you’. They will lull you to sleep and then reverse with a vengeance.
So, it may be with our example of the day, Merck (MRK).
No-Brainer … To Brain-Dead
Back in the day when posting on SeekingAlpha, Merck was a no-brainer amongst the grifter crowd.
Since fundamentals don’t move markets, and Merck continued to grind higher week after week, month after month, one could publish any amount of ‘research’ and look like a genius.
Oh, how times have changed.
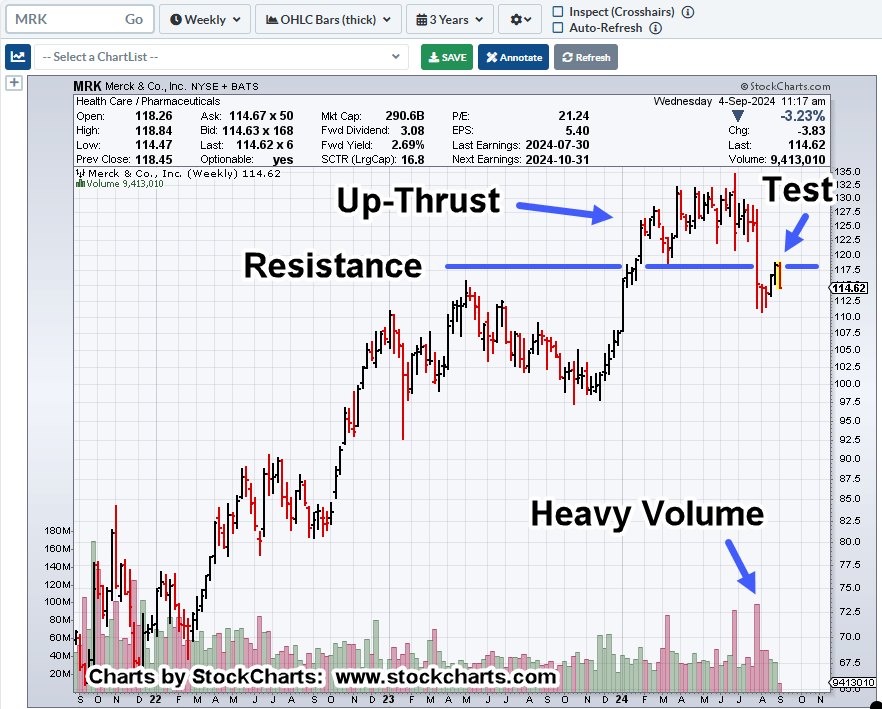
As we’ll see below, Merck has been in a massive topping pattern, or Wyckoff Up-Thrust.
Merck, MRK, Weekly
There’s a lot going on with this chart.
It’s been about seven-months of grinding at the highs, only to break down on heavy volume the week of August 6th.
Then, it was five weeks of ratcheting higher in a test, reversing this week.
Note the testing action was in response to the wide high-volume bar.
As David Weis said in his video, wide high-volume bars tend to be tested; here we see evidence of that action.
As always, anything can happen and Merck could levitate higher. However, we can see just from the chart alone, that prospect looks like a low probability (not advice, not a recommendation)
Note: Posts on this site are for education purposes only. They provide one firm’s insight on the markets. Not investment advice. See additional disclaimer here.
Market reversals tend to occur just before, during, or just after a holiday week.
Is that where we are now?
Semiconductors (SOXX), and it’s chief cook and bottle washer, Artificial Intelligence (NVDA), may have already decided the next direction … down.
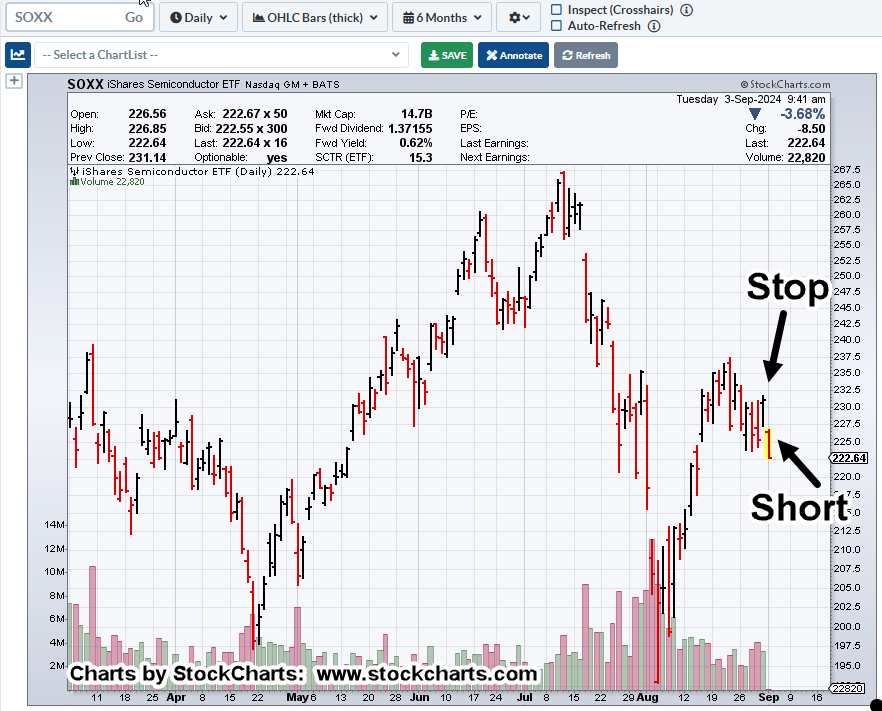
Semiconductors, SOXX, Daily
It’s just after the open and this is where we are.
“What do you see?”
Marking up the chart, we have a sell-short indicator (not advice, not a recommendation) right along with a hard stop location (as shown).
From yesterday’s update, those that watched the presentation by Robert Prechter Jr., were challenged with the idea, we’re in the largest bubble ever or at least since the 1720s South Sea Bubble (not advice, not a recommendation).
Positioning
In the sidebar, we can already see a short position was opened during last Friday’s session: SOXS-24-15 (not advice, not a recommendation).
Everyone has their own style and for me, I detest ‘chasing’ the market.
I’d rather make several attempts, get stopped out, then enter again, than watch the opportunity take off because I was too afraid to pull the trigger.
It’s only 20-minutes after the open and we can see the SOXX, is down hard.
Note: Posts on this site are for education purposes only. They provide one firm’s insight on the markets. Not investment advice. See additional disclaimer here.
Things just aren’t working out for the silver bulls.
The metal is down yet another 1% in today’s session.
Not only that as we’ll see below, but we could also be in a downward trading channel as well.
Talk about a ‘hyperinflation breakout’ has all but disappeared and we’re back to the (very lame, by now) excuse that it’s all because of those evil ‘manipulators’.
Leaving delusion behind, back to reality, price action itself, this site’s been consistent for over five months.
That is, silver’s exhibiting characteristics of a downside reversal or sideways congestion (not advice, not a recommendation).
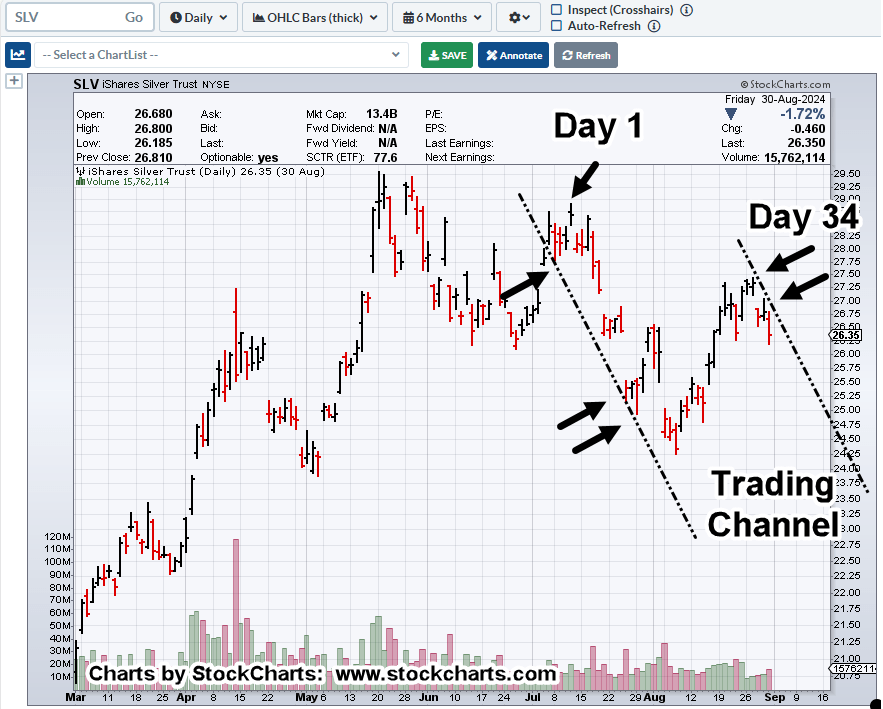
Silver SLV, Daily
From the chart above, we can see the right-side being confirmed over the past four or five sessions (black arrow contact points).
Also noted, there’s a Fibonacci time correlation between the intermediate high on July 11th and the right-side channel line contact on August 27th.
July 11th, was also the SOXX top.
About two decades ago, Prechter first proposed, ‘It’s all the same market’; meaning, that it’s the liquidity in the system that’s moving prices.
As that ‘liquidity’ dries up with more demand for cash (fiat, or not), the expectation is for the market indices to respond to that demand (not advice, not a recommendation).
Note: Posts on this site are for education purposes only. They provide one firm’s insight on the markets. Not investment advice. See additional disclaimer here.
Note: Posts on this site are for education purposes only. They provide one firm’s insight on the markets. Not investment advice. See additional disclaimer here.