That’s two times in a row, Carvana hit a target area (presented on this site) in the after-hours session.
The last time was here, CVNA printed 310, in the after-hours on February 19th.
Then, just hours ago, price action thrust higher into the zone in this post, printed at 243.6, then collapsed.
We never got to ‘Day 34’.
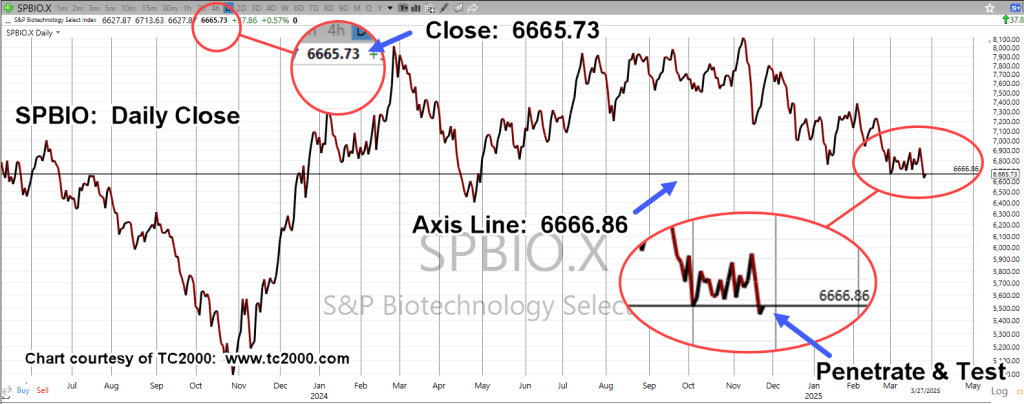
However, the real story may be in biotech XBI, with huge swings in both directions; currently (as of 6:35 p.m., EST) trading below today’s regular session low.
Note: Posts on this site are for education purposes only. They provide one firm’s insight on the markets. Not investment advice. See additional disclaimer here.
If the trendline is in-effect, meaning the market’s hanging in mid-air in a false breakout, getting back into that trend may result in some dramatic downside action.
Well, we got the dramatic downside.
Biotech XBI, collapsed nearly -11%, and 3X Inverse Fund LABD, is up +38%, and climbing.
As Wyckoff said a century ago:
‘Someone always knows something … and that ‘something’, shows up on the tape.’
It turns out in this case, showing up on the tape, was this, and this.
Biotech XBI, Daily
The chart from the week-ago post, has been updated.
As is typical, the ‘reason’ for last week’s price action comes out later, after the fact.
Positioning
At this point, trade LABD-25-05, is being maintained (not advice, not a recommendation).
Note: Posts on this site are for education purposes only. They provide one firm’s insight on the markets. Not investment advice. See additional disclaimer here.
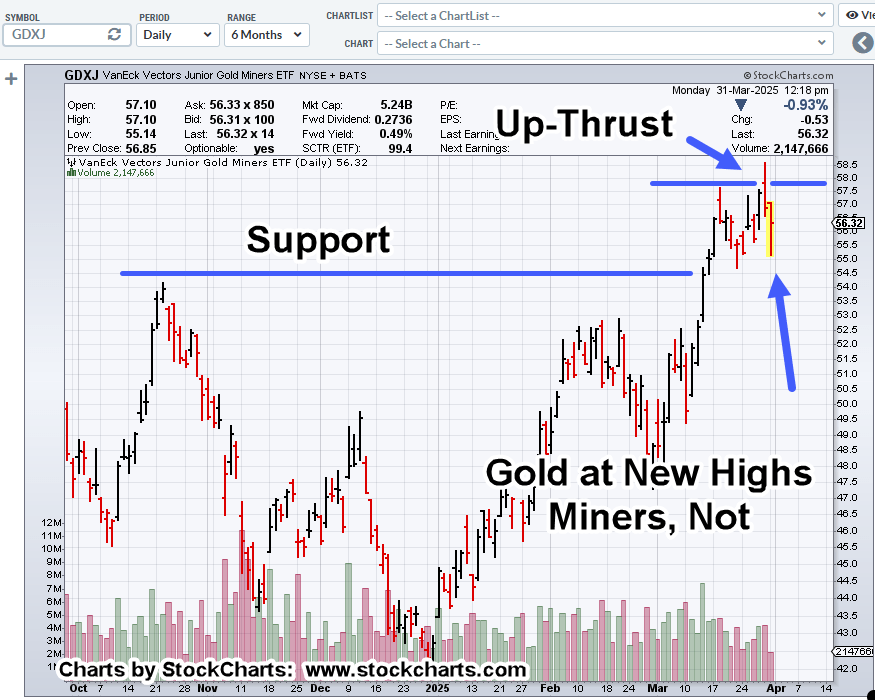
Sometimes, the question is not ‘what’s happening’, but ‘what’s not happening’.
In today’s case, we have gold (GLD) at new highs and the miners, not.
Not only are they not following gold higher, for the Juniors GDXJ, and the ‘Silvers’ SILJ, they both posted a new weekly low.
Junior Miners, GDXJ, Daily
Last Friday was a reversal bar.
Today (so far) we have gold at new all-time highs and the miners lagging (not advice, not a recommendation).
As of this post (12:54 p.m., EST), GDXJ, has moved up to test Friday’s low.
While price action retraces to test, it’s closing the gap on the amount of risk for a short position.
With that in mind, a direct short of GDXJ, has been opened (GDXJ-25-01) with the stop at (or to be) the session high (not advice, not a recommendation).
Note: As a result of the gold hysteria, YouTube grifting, book writing, podcast interviews, dollar collapse, and ‘It’s all coming down’ mania, instant gratification on this position is not expected. 🙂
Note: Posts on this site are for education purposes only. They provide one firm’s insight on the markets. Not investment advice. See additional disclaimer here.
Note: Posts on this site are for education purposes only. They provide one firm’s insight on the markets. Not investment advice. See additional disclaimer here.
The Good: Only the Senior Miners, GDX, have managed to claw their way past the highs set nearly five years ago in August of 2020.
The Bad: Junior Miners GDXJ, remain below that August ’20, level.
The Ugly: Silver Miners SILJ, are the worst, having their peak a bit later in February of 2021; they remain over -35%, below their highs.
The Market Rolls Over
Yesterday, Friday, was a down day for the Dow, S&P, The Qs, Transports, Airlines, Semis, nearly everyone.
For some of these indices, their all-time highs were posted months, if not years ago.
There may be some (bidding) ‘defensive’ action with gold (GLD) continuing higher; as said in earlier posts, the rest of the monetary metals are far below their highs.
Let’s look at the weakest; the silver miners, as they are likely going to be the ones most affected by an economic decline (not advice, not a recommendation).
Silver Miners, SILJ, Daily
We’re at an interesting spot.
Friday was a down day that pushed below existing support, shown in zoom area.
We have simultaneous action.
Once resistance was penetrated on March 18th, it could not hold. After eight trading days, on Friday, it posted lower on heavy volume.
However, we can see that SILJ, is now in (a minor) Wyckoff ‘spring’ position. So, the question is, what happens next?
Note: Posts on this site are for education purposes only. They provide one firm’s insight on the markets. Not investment advice. See additional disclaimer here.
Even as price reached its after-hours high of 310, on February 19th, and posted down ever since, short interest continues to decline.
As BigCharts reports, short-interest is now at 6.5%.
First, it was 33% short, then it dropped to 10%, then 7.8%, and now 6.5%, all the while, it looks like we’ve passed the top (not advice, not a recommendation).
The last update showed a trading channel that has since been negated. So, what’s price action doing now?
Carvana CVNA, Daily
As of this post (10:47 a.m., EST) price action has yet to define another channel … if there is one.
What we do have, is a Fibonacci time sequence in effect thus far.
At this juncture, we’re far away from the magenta (target) oval and Fibonacci Day 34.
However, as outlined by Car Questions Answered, this time of the year, typically has tax refund purchasing.
Note: Posts on this site are for education purposes only. They provide one firm’s insight on the markets. Not investment advice. See additional disclaimer here.
Note: Posts on this site are for education purposes only. They provide one firm’s insight on the markets. Not investment advice. See additional disclaimer here.
Note: Posts on this site are for education purposes only. They provide one firm’s insight on the markets. Not investment advice. See additional disclaimer here.
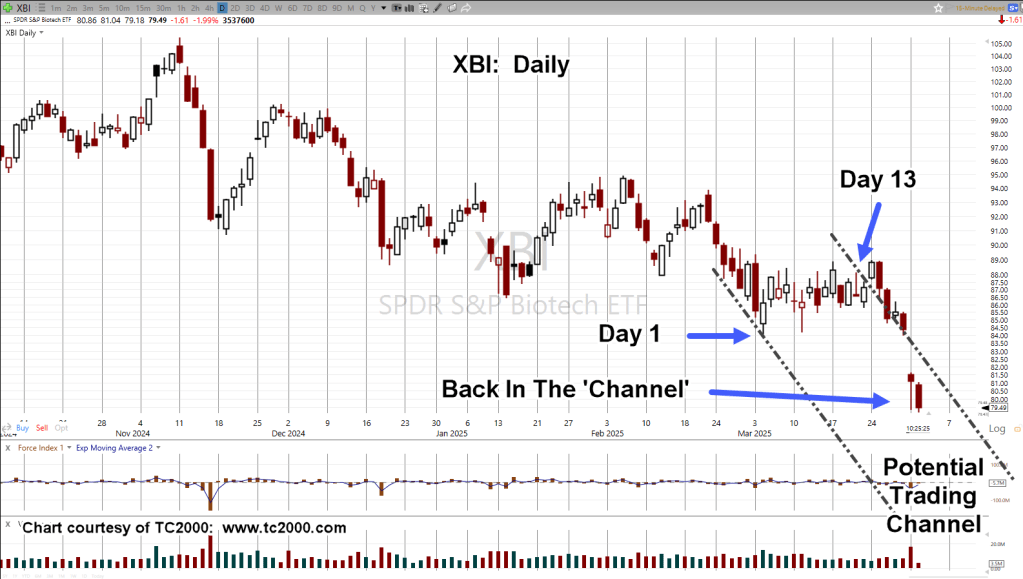
The markets don’t like uncertainly and that’s just what we have with biotech.
As the chart shows, the question becomes; is it a trend breakout, a breakout and test or a breakout, test, then possible failure?
This interview with Ed Dowd just days ago, paints a bearish picture for the overall markets.
If so, and we apply that scenario to biotech, the odds don’t seem to favor the upside (not advice, not a recommendation).
With that, let’s get to the action.
Biotech XBI, Daily
Last Friday, the 21st, was Fibonacci Day 89, from the November 11th, 2024, highs.
If the trendline is in-effect, meaning the market’s hanging in mid-air in a false breakout, getting back into that trend may result in some dramatic downside action.
On the bullish side, if it’s an upside breakout, ‘normal’ behavior is for a ‘test’ of the trendline.
Either way, both scenarios favor more downside (not advice, not a recommendation).
Note: Posts on this site are for education purposes only. They provide one firm’s insight on the markets. Not investment advice. See additional disclaimer here.
Note: Posts on this site are for education purposes only. They provide one firm’s insight on the markets. Not investment advice. See additional disclaimer here.