Going back to this post, one reason given for continued lower prices in Nat-Gas, was the high price of oil: with Nat-Gas being a by-product of oil production.
Since that post, oil prices (USO) have dropped, and Nat-gas prices are on the rise.
Natural Gas UNG, Daily
The two dashed black lines are trend and channel.
There’s also a ‘W’ bottom formed; if broken to the upside, targets the ‘Measured Move’ as shown (not advice, not a recommendation).
Note: Posts on this site are for education purposes only. They provide one firm’s insight on the markets. Not investment advice. See additional disclaimer here.
Note: Posts on this site are for education purposes only. They provide one firm’s insight on the markets. Not investment advice. See additional disclaimer here.
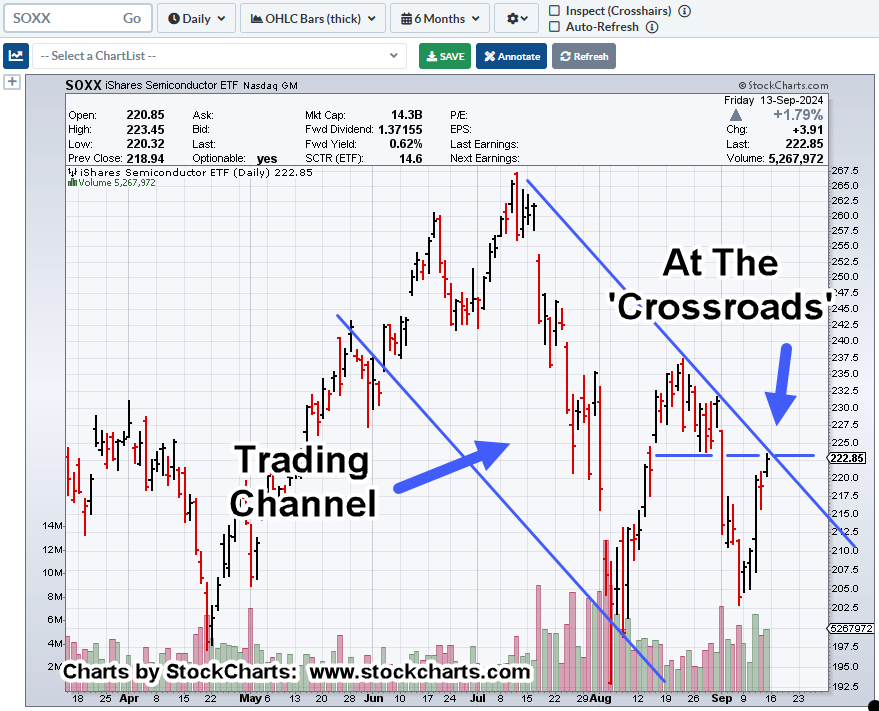
Shown in the chart below and similar to Nvidia (yesterday), the SOXX, is also at a potential inflection point (not advice, not a recommendation).
Maybe, it’s time to cue up the blues music; it could be an appropriate moniker for the road ahead.
Semiconductors SOXX, Daily
“What do you see?”
Below, what the market is saying about itself.
If this chart is in-effect, that is, if the market’s ‘respecting’ the trendlines and trading channel, we’re at the spot where one could ask, ‘Where to from here?’
As always, anything can happen and we could somehow, magically, power on higher; probabilities suggest not (not advice, not a recommendation).
Contra Indicators
If indeed, this past week was the infection point for Nvidia and Semiconductors as a whole, the euphoric ‘technology‘ conference, might go down as the most significant contra-indicator of the A.I., bubble (not advice, not a recommendation).
Let’s not forget, those in the know are cashing-out like there’s no tomorrow.
Note: Posts on this site are for education purposes only. They provide one firm’s insight on the markets. Not investment advice. See additional disclaimer here.
Scuttlebutt from the Goldman Sachs technology conference, with chief cook and bottle washer Nvidia, had at least one journalist (do we still have those?) breathless, ecstatic (paraphrasing):
‘Never has there been so much euphoria’.
These links show how Fibonacci influenced potential, and then confirmation, of the all-time top and reversal.
As we’ll see below, price action continues with Fibonacci.
Nvidia NVDA, Weekly
This week, is ‘Week 13’, from the all-time high.
Fibonacci correlations continue on the daily.
Nvidia NVDA, Daily
So far as of 1:53 p.m., EST, it’s an inside day for NVDA, with yesterday as the potential ‘short squeeze’, retrace high.
Yesterday was also a Fibonacci 5-days, from the most recent low (Day 55).
Retrace High
As is typically the case, the crowd is still euphoric (maybe even more so) long after the high.
This is typical ‘bubble’ behavior … the party goes on (even harder) as the ship goes down (not advice, not a recommendation).
Note: Posts on this site are for education purposes only. They provide one firm’s insight on the markets. Not investment advice. See additional disclaimer here.
It said that demand had evaporated as seen by Force Index (thrust energy).
Nvidia went on to plunge over 15% before yesterday’s (what must have been a) short squeeze.
Coupled with that, was short trade (SOXS-24-15) in the Semiconductor Index (not advice, not a recommendation).
Yesterday, pre-market action (being short) for SOXX, did not look right; that position was exited just after the open.
Net profit for SOXS-24-15, was about +23.25%.
The whole scenario shows the importance of having the price action itself dictate the trading action.
The squeeze ‘excuse’ was the CEO of Nvidia giving a speech, then going off to sign women’s breasts … I’m not making this up.
All of which brings us to the chart.
We’re keeping the same Fibonacci 8-Day timeframe as the previous update.
Nvidia NVDA, 8-Day
There’s a lot going in with this chart.
First: Price action has become wide and unstable.
Second: The completed 8-Day, bar posted the deepest downside thrust energy ever.
Positioning
Once again, everyone has their own method and style.
With that, understanding where we could be in this market environment, i.e., the throws of reversal, another (tentative) short was opened in the SOXX (not advice, not a recommendation).
The stop on this trade (SOXS-24-16) is very tight … to be set near the (SOXS) lows of the session.
Note: Posts on this site are for education purposes only. They provide one firm’s insight on the markets. Not investment advice. See additional disclaimer here.
Anyone with two piston-rings rubbing together knows, the car industry is in chaos if not full-blown collapse, links here, here, and here.
We also ‘know’ that Carvana’s financial results have reached the realm of ‘interesting‘.
The last update on Carvana proposed that price action might continue on to a 50% retrace.
So far, it’s not happening.
In fact, it looks like CVNA, has decided to roll-over.
Carvana CVNA, Weekly
Price action has formed a terminating wedge, currently testing the bottom … potentially near a breakout to the downside (not advice, not a recommendation).
It’s about ten minutes after the open; CVNA is trading down 2.14-pts @ 128.58, hovering around the bottom wedge line.
Because CVNA, has such an ‘interesting’ business model, if and when we get a surprise, price action could move faster than anyone thought possible (not advice, not a recommendation).
Note: Posts on this site are for education purposes only. They provide one firm’s insight on the markets. Not investment advice. See additional disclaimer here.
Note: Posts on this site are for education purposes only. They provide one firm’s insight on the markets. Not investment advice. See additional disclaimer here.
Since the A.I. money’s already been made on the upside, it could be time for the bears to set the hook on the shakeout, driving the Semiconductor sector farther down.
This just out from the Mises Institute; author Justin Murray argues, A.I. is essentially an expensive hype, that’s run its course.
With that, we’re not going to belabor whether A.I., is a bubble, a scam, a grift, or not.
No, we’ll let the price action itself make the case. 🙂
It’s hard to argue with the reality of the chart
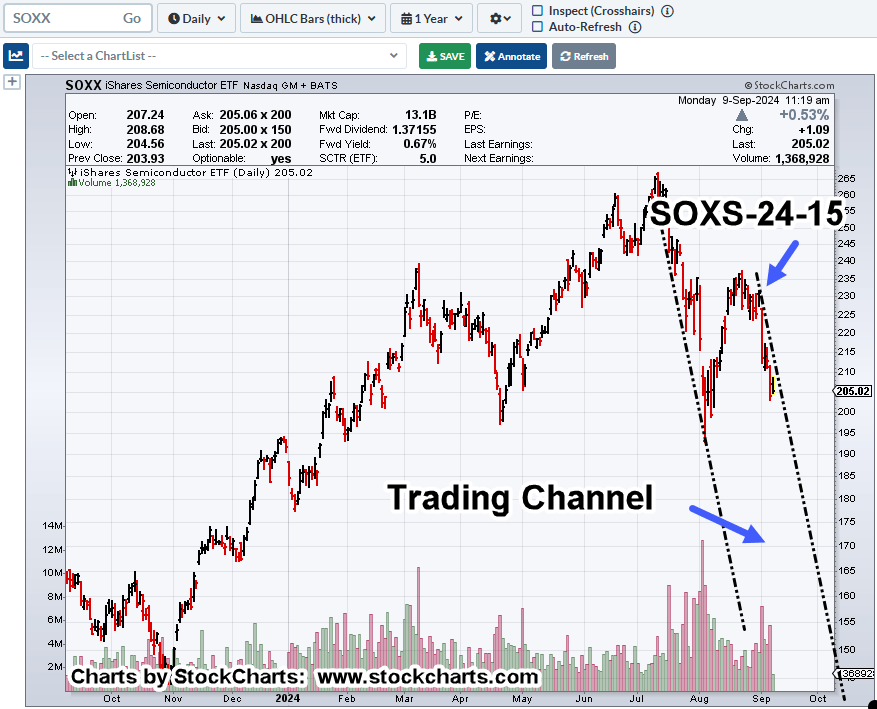
Semiconductors, SOXX, Daily
If the trading channel remains in effect, we can see the downside potential is enormous (not advice, not a recommendation).
The arrow shows the entry location of the current, active short: SOXS-24-15.
Since that initial entry and with nearly each price rebound, the short size has been increased (not advice, not a recommendation).
Stops Are Tight
It’s important to note, as of this post (11:38 a.m., EST), the SOXX has not (yet) made a new daily low.
In the markets anything can happen. We could always get an upside reversal.
However, from a seasonality standpoint, September is typically the worst (downside) month of the year.
Note: Posts on this site are for education purposes only. They provide one firm’s insight on the markets. Not investment advice. See additional disclaimer here.
Note: Posts on this site are for education purposes only. They provide one firm’s insight on the markets. Not investment advice. See additional disclaimer here.
Those who ‘drank the Kool-Aide’ about silver being bolstered to astronomical heights because, you know, ‘solar energy’, must be a little upset by now.
Just like the fabled ‘interest rate cut’, it’s not happening.
Although for interest rates, we’re just shy of two weeks away to find out; meanwhile, since the last report, the bond market has been bid up again, pushing rates down (again), so, we’ll see.
Back to silver.
We have yet another so-called ‘green energy’ company going bankrupt. That’s not so much news, except for this statement from the report (paraphrasing):
‘Solar demand has declined across the entire industry’
Um, it’s called an economic depression (not advice, not a recommendation).
While we’re talking collapse, let’s just throw in the Chat GPT (Artificial Intelligence) collapse as well, link here.
With all of that as the backdrop, let’s see what silver is up to these days.
Silver, SLV ETF, Weekly
A terminating wedge with an MACD crossover.
We’re at the spot with price could go either way. There has been no wedge breakout to the upside, or down.
If we do get an upside breakout, the position of the MACD is set-up for a potential bearish divergence.
Covered many times on this site; the possibility that precious metals could move higher as a result of the miners imploding.
Adding to that idea are the components of tracking SILJ, silver miner EFT. How many of these outfits have an actual P/E?
PAAS does not, HL … no, CDE … no, NEXA … no, GORO … no, and on it goes.
Note: Posts on this site are for education purposes only. They provide one firm’s insight on the markets. Not investment advice. See additional disclaimer here.