Note: Posts on this site are for education purposes only. They provide one firm’s insight on the markets. Not investment advice. See additional disclaimer here.
Looks like the silver wipeout took more than a few by surprise.
However, that’s not the real story.
Some of the comments on various YouTube ‘analysis’ sites are to the effect:
I don’t know what to believe. I don’t know what’s real.
The inference is, that silver ‘should’ have gone higher.
There was supposed to be some kind of massive breakout as we head into hyperinflation, right?
Track Record, vs. ‘Should’
Part of the reason for posts on this site is to establish a track record.
The silver analysis over the past four months is the best recent example.
That assessment never wavered; price action in SLV, is consistent with either an outright reversal, or sideways congestion (not advice, not a recommendation).
It is not consistent with a hyperinflation breakout.
Longtime visitors to this site would have least known that ‘something’s up’ with silver.
Its behavior does not fit the narrative.
Anything Can Happen
As always, the market can reverse and do something unexpected.
Price action could change character.
If so, the objective is to identify that change early, then assess opportunities (if any).
Note: Posts on this site are for education purposes only. They provide one firm’s insight on the markets. Not investment advice. See additional disclaimer here.
Especially shocking after having been subjected to non-stop delusion (now going on four months), and being ‘certain’ precious metals were headed higher.
Enough already.
Silver (SLV) is currently trading down a whopping -4.7%, in the pre-market session. Gold (GLD) is lower by about -1.2%.
Silver analysis has been consistent; SLV, price action itself, indicates a top and reversal or at best, sideways congestion (not advice, not a recommendation)
If one wants to review, starting back in April, we have:
Now, this update essentially completes the process.
Silver, SLV, is about to open well below resistance as shown in the ‘Stalls-Out, update.
The Battle Against ‘Tik-Tok’ Brain
Fewer and fewer have a brain … like this (warning, profanity).
This guy sounds very much like the one in the ‘About‘ section. 🙂
Housekeeping: UNG, JDST
As can be inferred, a short trade via JDST, has already been opened: JDST-24-05.
Depending on today’s action, the stop listed is likely to be moved higher (not advice, not a recommendation).
Nat-Gas (UNG), on the other hand, is not behaving as expected.
The initial position UNG-24-11, was reduced by 80%, as a result of yesterday’s action. It’s likely that position will be closed out completely during this session (if not already).
Note: Posts on this site are for education purposes only. They provide one firm’s insight on the markets. Not investment advice. See additional disclaimer here.
Note: Posts on this site are for education purposes only. They provide one firm’s insight on the markets. Not investment advice. See additional disclaimer here.
Note: Posts on this site are for education purposes only. They provide one firm’s insight on the markets. Not investment advice. See additional disclaimer here.
Price action detailed below, shows upside reversal (not advice, not a recommendation).
It’s been a while since the last update on Nat-Gas, UNG.
Since then, price action sliced through support (shown in the update), posting new lows.
However, over the past week, the character has changed.
Natural Gas, UNG, 3-Day
Today is ‘Day 3’, for the chart’s price bar; tomorrow’s action begins a new ‘3-Day’ bar.
At this juncture, the prior three-day move to new (daily) lows has been negated with today’s action.
If positioning long, the obvious stop level would be the low of the current three day bar at UNG 13.89 (not advice, not a recommendation).
Anything Can Happen
The past two weeks has shown us, in no uncertain terms, that anything can happen.
So, it is with the markets.
Nat-Gas has been bouncing around historical lows for some time; plenty of time to wear out any (remaining) bulls.
SOXX Housekeeping
While under no obligation to discuss open (or closed) trades, as a courtesy, today’s price action forced closure of SOXX short trade; SOXS-24-12
Total profit on the trade, having twelve separate entries and one exit (today) was just over 19%.
We’re potentially at the top of the largest mania in history save the South Sea, expecting things to go in a straight line is (apparently) not realistic. 🙂
Note: Posts on this site are for education purposes only. They provide one firm’s insight on the markets. Not investment advice. See additional disclaimer here.
For the next three-months, until the end of October, the (net) seasonality of the markets is down.
That’s not all.
According to this link, we have a bevy of technical and fundamentals suggesting the overall direction of the markets is to lower levels (not advice, not a recommendation).
Lower is good … at least if one is positioned short.
With that, we’ll look at the semiconductors, SOXX, to see how seasonality might help on a (potential) short position.
Semiconductors SOXX, Daily
If the channel remains intact, we’re still at the beginning.
Of course, the very next session can completely blow this analysis apart. That’s the way of the markets.
For now, however, we do have a channel, we do have the above-mentioned seasonality; probability and pressure is to the downside (not advice, not a recommendation).
Turkey & Position
For those familiar with ‘Reminiscences‘, and ‘Turkey’, a.k.a. Mr. Partridge, we should all know the importance of maintaining position.
The objective, therefore, is to attempt to maintain a short position (via SOXS, or other short) as long as possible, given the trading channel and bearish bias (not advice, not a recommendation).
Simple But Not Easy
One of the very first things the Online Trading Academy (Dallas) told their class back in the day, working the markets with a profitable plan of action should be ‘simple’.
They also said, the problem is, it’s not easy.
Here’s just one unrelated example of a simple job (i.e. ‘protection’) that’s obviously, not easy.
Note: Posts on this site are for education purposes only. They provide one firm’s insight on the markets. Not investment advice. See additional disclaimer here.
When the ‘forecasts’ don’t work out, the complaining comes out.
As Dr. Elder said (paraphrasing), ‘Mistakes in the market are to be expected. Repeating mistakes is a sign of neurosis’.
Typical responses from a YouTube site, forever expecting the ‘hyperinflation’ launch, the usual suspects:
Silver is beyond pathetic
Uggggh premature [launch] AGAIN!
… negative sentiment … a little overdone
Actually, if we’re in a full-blown economic depression, negative sentiment has not even started (not advice, not a recommendation).
Silver, along with copper (and lumber) are good indicators for the health of the economy. So far, lumber has crashed outright; down ~70% from its 2021, peak.
For copper bellwether, Freeport McMoRan (FCX),it has not looked back since this report.
Let’s move on to silver. What’s the market telling us about the next likely direction?
Silver SLV, Weekly Close
As Yogi Berra said … ‘It’s Deja Vu all over again’ 🙂
The last time there was a similar upside volume crescendo, it marked the pivot point for a 30%, decline.
That decline took two-years to (fully) recover. Hardly ‘hyperinflation’.
Now, we’re at The Danger Point®, anything can happen.
If it’s another downside pivot, just the looks suggest a deeper decline than last time.
If, however, this time really is different, one would expect the upside to get started … and soon.
Note: Posts on this site are for education purposes only. They provide one firm’s insight on the markets. Not investment advice. See additional disclaimer here.
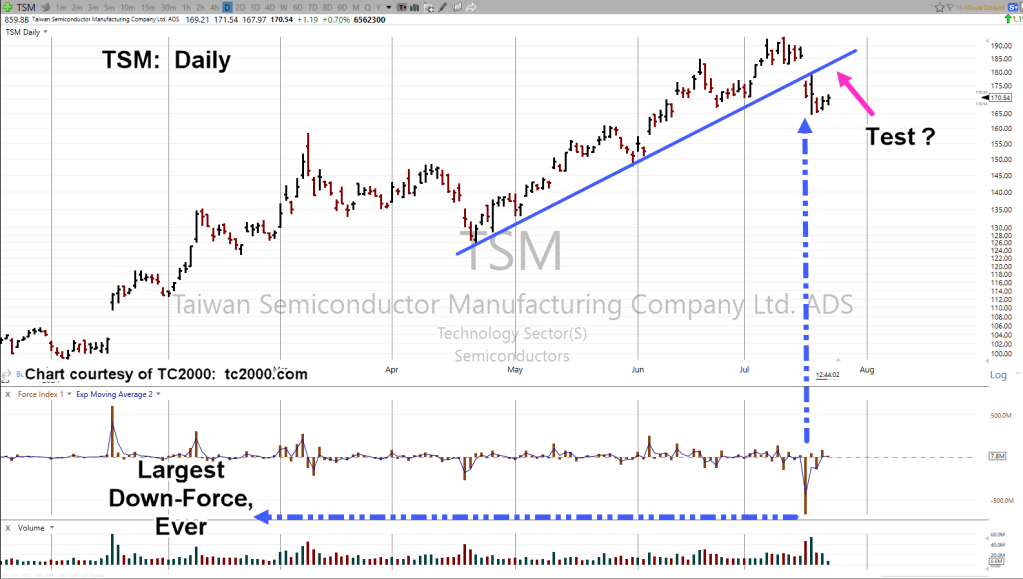
Taiwan Semi (TSM) is the primary reason with its own trading down over -5%,.
If this really is the top of the A.I. bubble, the potential (now apparent) reversal was covered well in advance, here, here, and here.
If this is not the top and there’s more to go, the SOXX would need to retrace significantly, find support and thrust energy to mount another rally (not advice, not a recommendation).
Note: MACD indicators are bearish divergent on both daily and weekly.
Making It Up, As We Go
Of course, the press has to make up a reason for the pre-market rout. So, for today, we have this and this.
Tomorrow is a whole ‘nother story, literally 🙂
Semiconductor SOXX, Weekly
The blue arrow notes only one other time (in history) in the SOXX, where downward thrust exceeded that of week ending, April 19th.
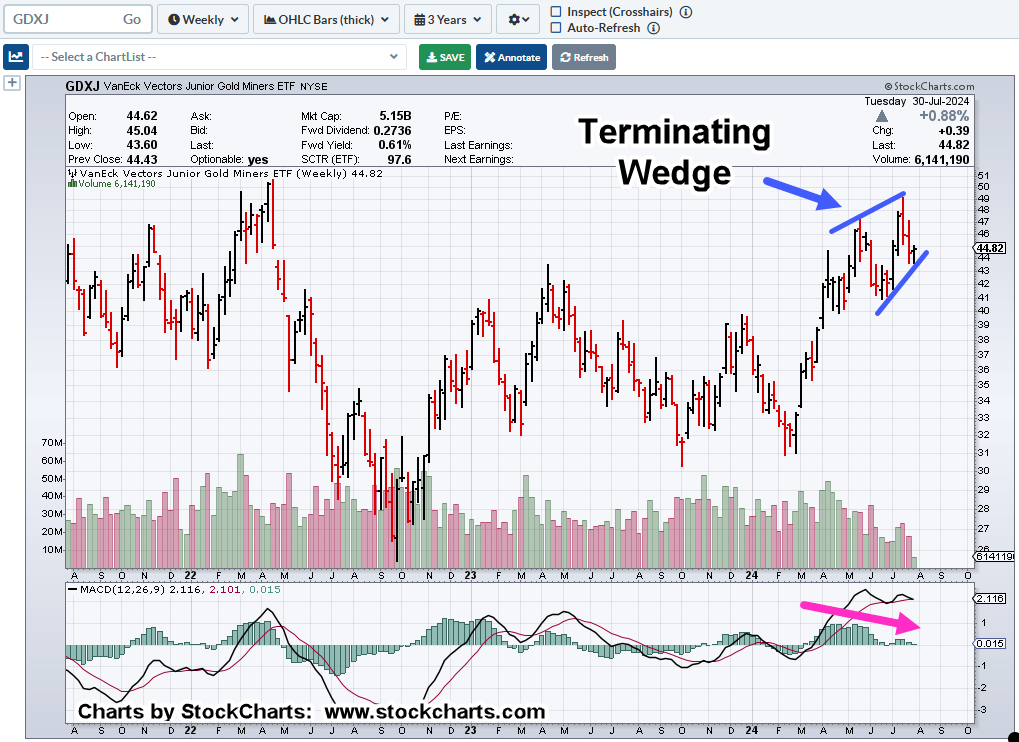
Otherwise, we have the usual suspects: Terminating wedge, dissipating energy, Fibonacci correlations for chief cook and bottle washer Nvidia, link here.
Note: Posts on this site are for education purposes only. They provide one firm’s insight on the markets. Not investment advice. See additional disclaimer here.
From an engineering standpoint, the SOXX, has met the requirements for a Wyckoff up-thrust (not advice, not a recommendation).
First: Price action posted an outside-down reversal (last Thursday), on increased volume and closed below established resistance.
Second: That reversal was then tested (on Friday) and did so, on contracting volume.
Third: MACD, divergences on Weekly and Daily timeframes; although near-term weekly has yet to tick lower but still (diverging) below the highs of this past March.
Intuitively, you can feel that something’s up. The A.I. pump-n-dump set-up may have run its course.
Note: Posts on this site are for education purposes only. They provide one firm’s insight on the markets. Not investment advice. See additional disclaimer here.