‘Spring’ Position
DoorDash, has been traded once to the short side this year: DASH-26-01.
That trade was closed out (covered) on January 12th, profit of 7.58%.
Note, from the link above, after January 7th, and the ‘test’, price action began an immediate decline, to now.
An error on the trade, was not maintaining the position, and closing out this past Friday 🙂
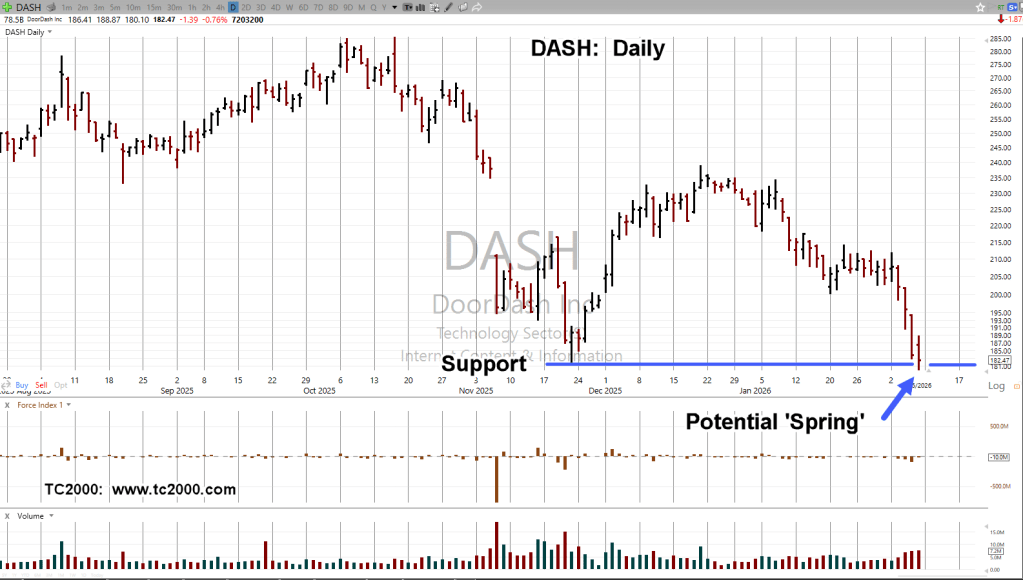
At this point, we’ve penetrated support, now in Wyckoff ‘spring’ position.
Spring position does not guarantee a rally. It just means the market may attempt to move higher and take out any shorts late to the party (not advice, not a recommendation).
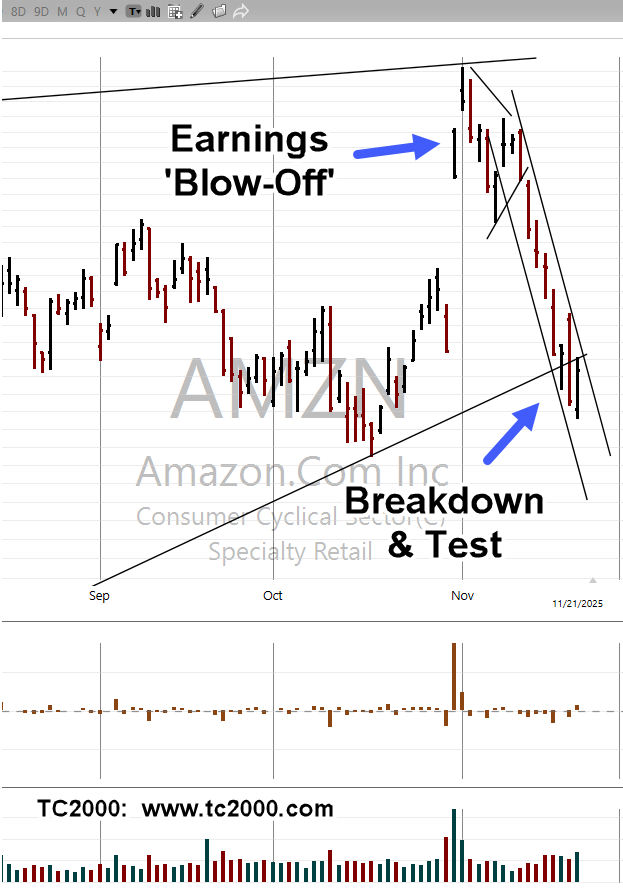
DoorDash DASH, Daily
Earnings release, February 18th, after the close.
As we’ve seen with the Amazon and O’Reilly collapse, Ball Corp., CorPay Inc., DaVita HealthCare launch (and others), response to earnings are all over the map.
There’s no telling what’s going to happen with earnings and DASH (not advice, not a recommendation).
Stay Tuned
Charts by StockCharts
Note: Posts on this site are for education purposes only. They provide one firm’s insight on the markets. Not investment advice. See additional disclaimer here.
The Danger Point®, trade mark: No. 6,505,279