Note: Posts on this site are for education purposes only. They provide one firm’s insight on the markets. Not investment advice. See additional disclaimer here.
Note: Posts on this site are for education purposes only. They provide one firm’s insight on the markets. Not investment advice. See additional disclaimer here.
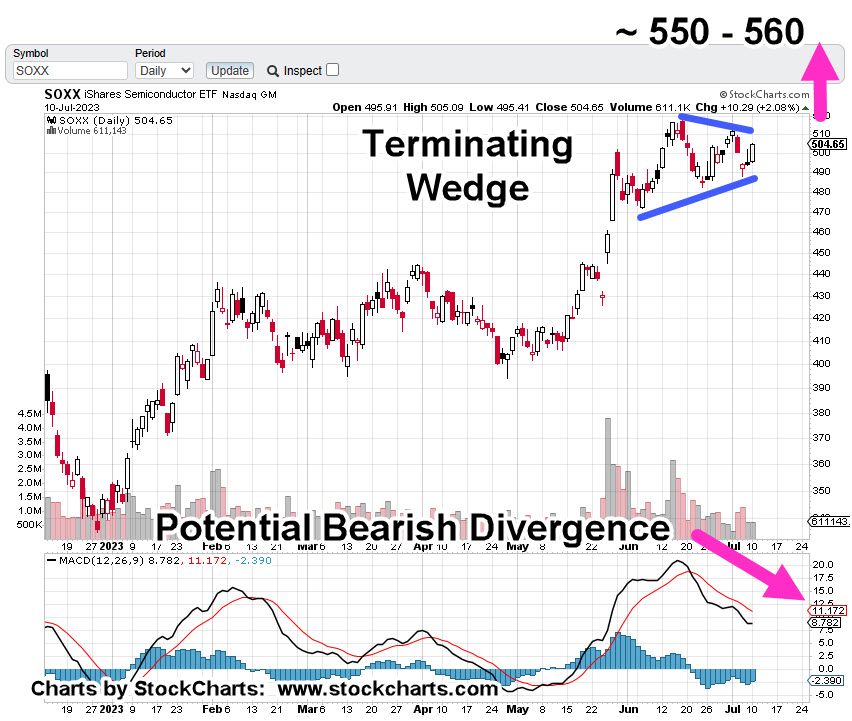
The prior analysis of biotech SPBIO, had expectations for price action to rise into the 6,400 area: the location of the 200-Day Moving Average.
It did that, and more …
Back in late April, SPBIO, was in a Fibonacci time sequence. Shown below, that time structure may still be intact.
But First … The List
Note: This is not “The List“, as has been compiled (still on-going), covering the horrors of this sector but rather a list of reasons why SPBIO, is likely to head lower from here.
Here it is, not in any particular order:
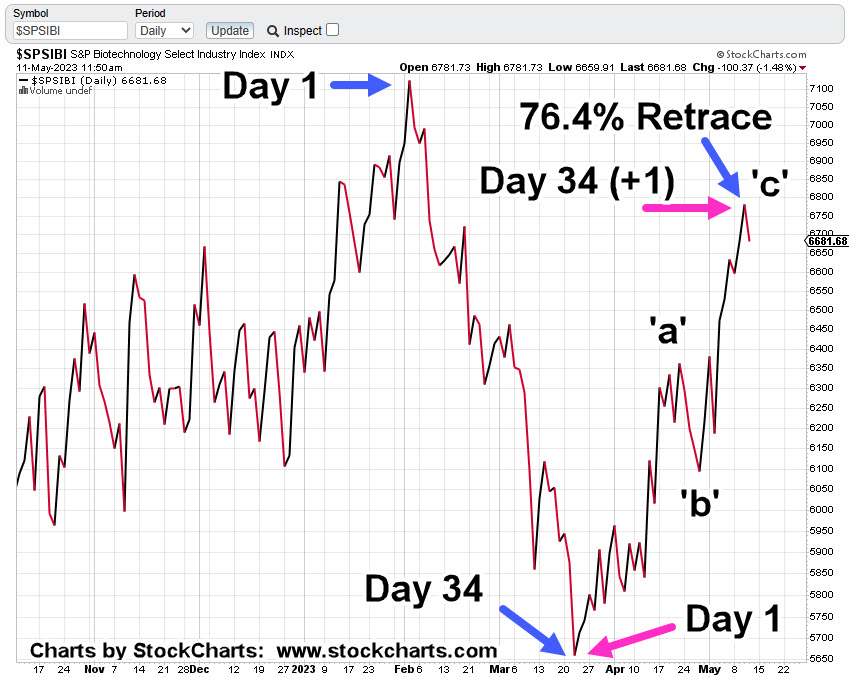
Price action has reached a Fibonacci 76.4%, level
From the March 24th low, price action has retraced upward in an ‘a-b-c’ corrective move, with wave ‘a’ distance equal to wave ‘c’. Note: Equal distance ‘a’ and ‘c’, on a print basis.
At the last session, as the action pushed to a new daily high, there was ‘evidence of a struggle’ during the session to either reverse lower or move higher. Action was undecided and closed slightly below the open.
Looking at the first chart below, the daily close for the past three-years has the trend decidedly down; this sector is the weakest of all the major indices.
On the chart below, there’s a series of lower highs, lower lows that have oscillated into a massive bearish wedge.
Yesterday (Wednesday) was a Fibonacci 34 days (-1), from the print lows set on March 24th. That day was also a Fibonacci 34 days (+1), from the closing low set on March 22nd. We’re still posting a Fibonacci Time correlation.
From the highs set on February 2nd, to the lows on March 24th and then to the highs set yesterday May 10th, is symmetrical; separated by a Fibonacci 8-weeks lower and then Fibonacci 8-weeks higher.
Fundamentally, this sector is a disaster. None of the top ten equities have a P/E. All are losing money.
No P/E and operating at a loss; interest rates rising, credit standards being tightened. How are these outfits going to secure more Venture Capital (or any additional funding via stock/debt) in that environment; implosion is dead-ahead (not advice, not a recommendation).
Bank failures continue … at some point (as with the rest of us) one of these banks may be the line of credit for company payroll. Not all banks went bust in The Great Depression but just enough to halt payroll for some key industries. That event helped topple the economy.
The list goes on but that’s enough to make the point.
Now, on to the charts.
Biotech SPBIO, Daily Close
Moving closer in, to show the Fibonacci retrace, the Fibonacci time and the ‘a-b-c’ structure.
As of this post (12:25 p.m., EST) price action continues its downside reversal.
Because the retrace level (76.4%) is the highest noted by Fibonacci, we can expect some amount of upward testing if there’s going to be a sustained downside.
Anything can happen. However, with the above list compiled for both technical and fundamental conditions, probabilities point lower (not advice, not a recommendation).
Note: Posts on this site are for education purposes only. They provide one firm’s insight on the markets. Not investment advice. See additional disclaimer here.
Note: Posts on this site are for education purposes only. They provide one firm’s insight on the markets. Not investment advice. See additional disclaimer here.
One report covering the historic narrowing of the market is here.
Never before seen narrow breadth: What does it mean?
It means the market’s ‘keeping up appearances’ while the foundation’s been removed.
That way, the professionals can get out the door; sell or sell-short, funnel capital to the only three tickers left (AAPL, AMZN, MSFT), while the public looks at the SPY, and says ‘Where’s the collapse?’
Let the crowd focus on the S&P … probably the most computer controlled, AI driven, Machiavellian manipulated market in the world … but hey, I’ve got my i-phone trading app and I’m going to ‘Put it to the man’.
Meanwhile, downside leader biotech, inches lower.
Biotech SPBIO, Daily
Let’s review where we are with SPBIO, with the full understanding that anything can happen.
For now, we’re heading lower (not advice, not a recommendation).
It’s obvious. Biotech’s following a Fibonacci time sequence.
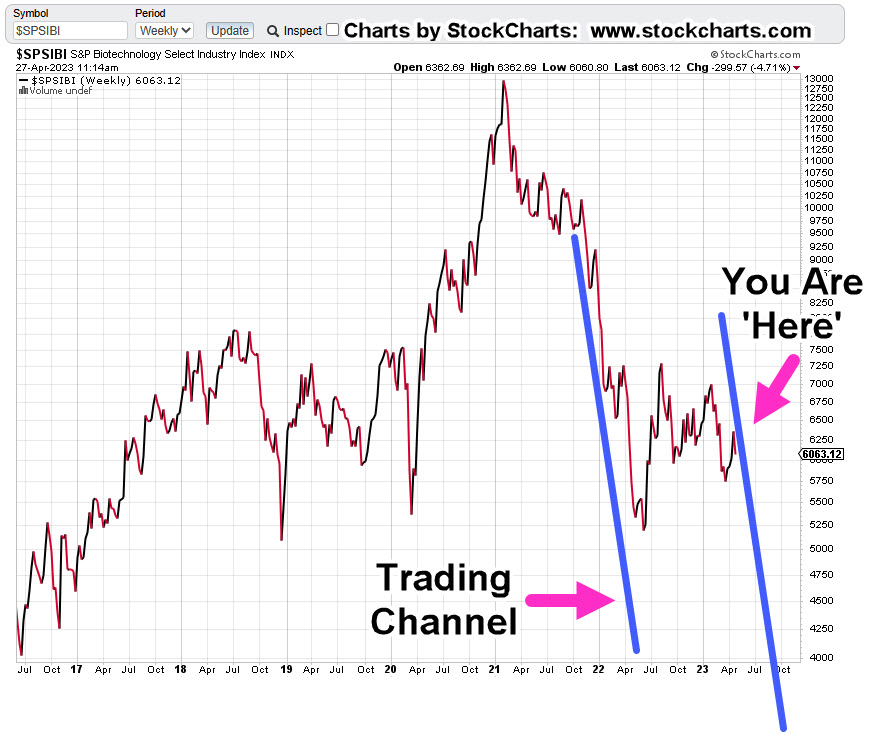
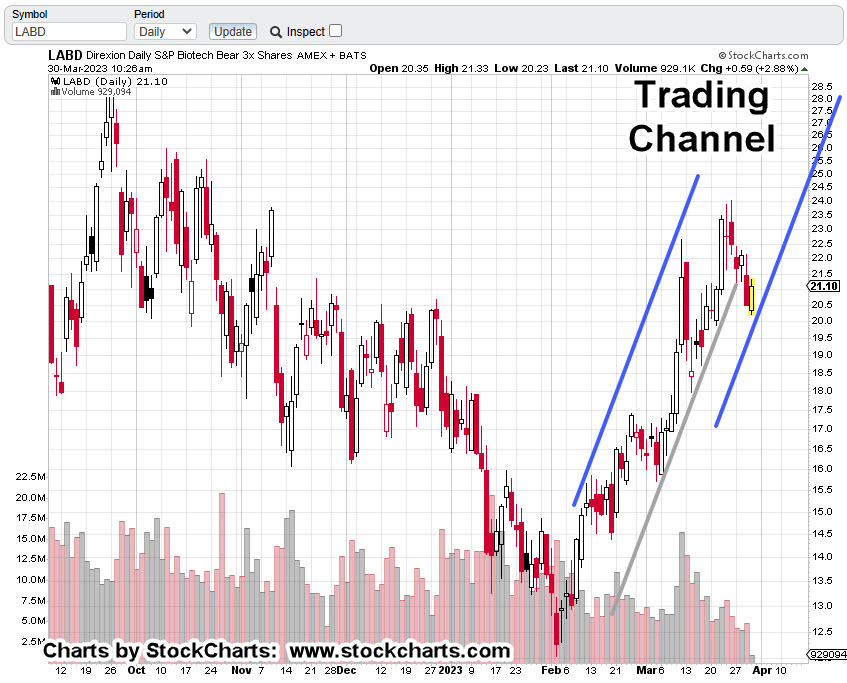
Let’s pull out to the larger weekly chart and see something really scary.
Biotech SPBIO, Weekly Close
If we really are at the right side of the trading channel, it’s not looking good for the bulls.
Of course, it all makes sense.
The market’s at record breadth divergence. Banks are collapsing, Ukraine (fabricated, or not) coupled with trade wars, the consumer’s tapped-out (credit at maximum) and on it goes.
Positioning
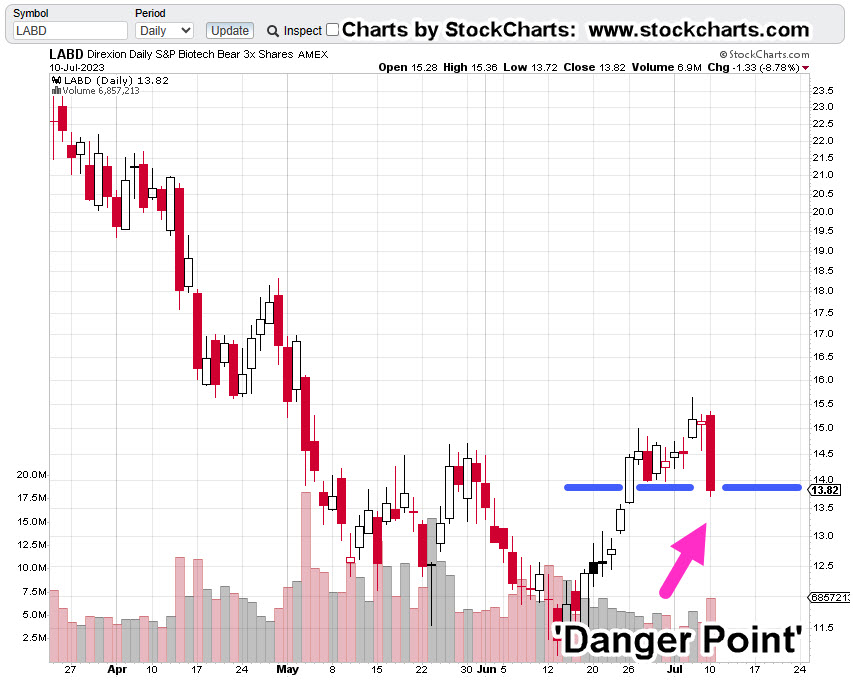
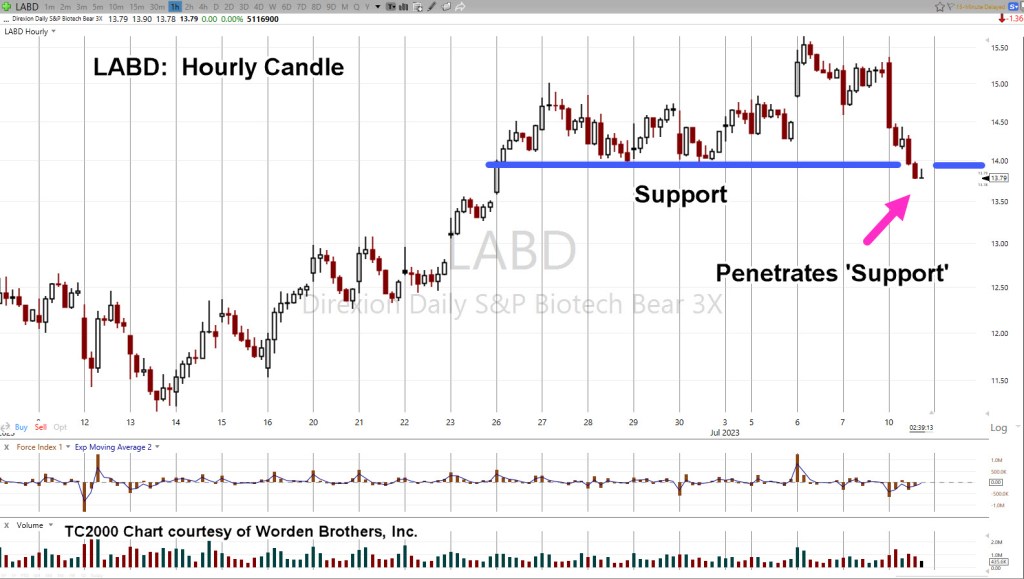
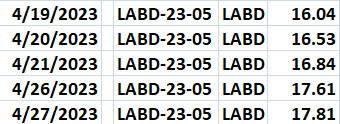
Early this session, the short position in biotech (via LABD) was increased (not advice, not a recommendation).
The table below shows the trading (entry) activity during the on-going reversal (not advice, not a recommendation).
Hard Stop: 16.79
The notation ‘LABD-23-05’, indicates this is the fifth trading campaign (or trade series) in LABD for the year.
Note: Posts on this site are for education purposes only. They provide one firm’s insight on the markets. Not investment advice. See additional disclaimer here.
It’s interesting, but then again not, how this sector (biotech, SPBIO) gets absolutely no mention in the mainstream or on YouTube.
It made all-time highs and reversed down long before the rest of the indices (except the miners); why is it not the focus of financial and technical discussions?
We’ll leave that as an open question for now and move on to the technical condition; that is, the downside pivot may be at hand.
The last update finished with this (emphasis added):
“Taking it all in aggregate, we’re obviously at an extreme and either going to reverse from here or launch into a sustained continuing directional move.“
Well, reversal it is.
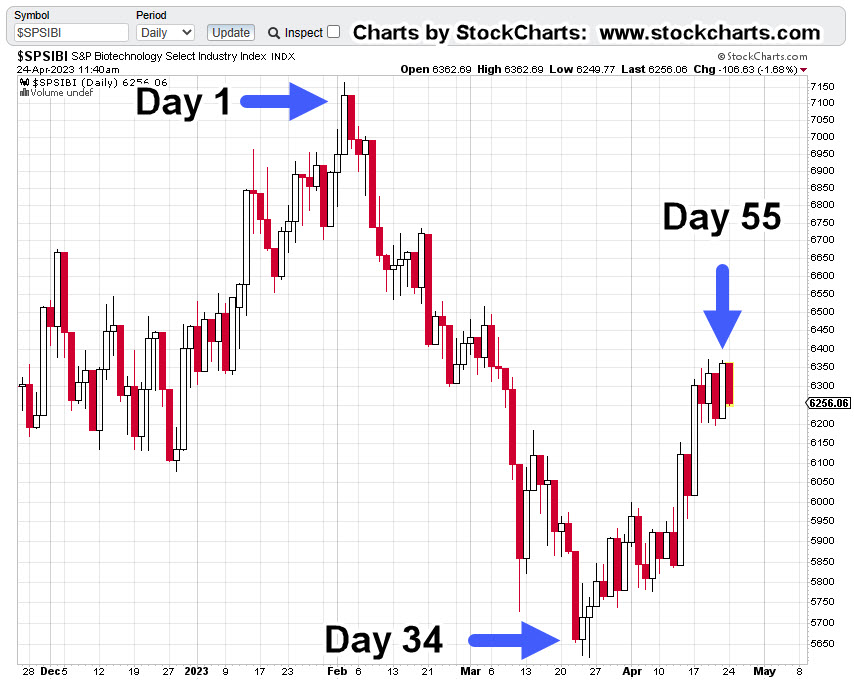
This update will be brief, showing the current state of SPBIO (as of 11:57 a.m., EST) and the Fibonacci time correlation from the February 2nd top.
Biotech SPBIO, Daily
For the engineers out there, the ‘exactness’ (i.e., posting extremes to the day) is not important.
What is important is to recognize the structure.
That is at this point, price action’s adhering to a Fibonacci time sequence.
Good News, Bad News
The good news is, anyone short this sector (via LABD) is now green for the day (not advice, not a recommendation).
The bad news is, this market may once again be the downside leader. We’ve already done the work on projecting target areas.
If those projections come to pass, it’s going to be a very different world. At that point, this sector may actually be the topic of mainstream and YouTube discussions.
Note: Posts on this site are for education purposes only. They provide one firm’s insight on the markets. Not investment advice. See additional disclaimer here.
We’re about to find out if Biotech’s in a new bull market or at the retrace extreme, ready for reversal.
The last update gave us the big picture on the index; a massive H&S pattern, five years in the making.
A potential trendline was shown on the daily chart of inverse fund LABD. That trend was subsequently negated by price action just hours later.
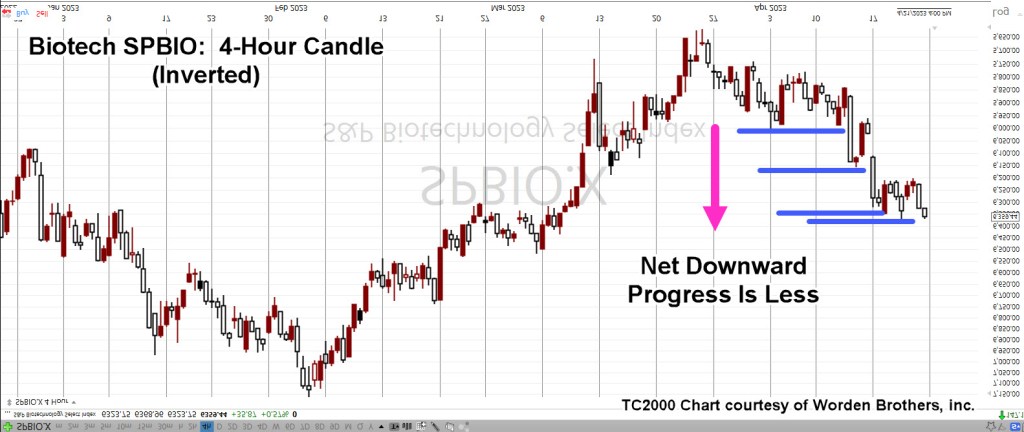
Let’s look at SPBIO, more specifically, the 4-Hour Chart.
To mimic price action of leveraged inverse LABD, we’ll invert the SPBIO.
The reason for inverting, not using LABD, is that leveraged funds have a downward bias which distorts the actual data.
Biotech SPBIO, 4-Hour, Inverted
The chart highlights Point No. 1 and Point No. 2. These areas are identified as a reminder; the prior set-up and reversal was identified, to-the-day.
There’s no guarantee the same performance will be repeated, i.e., spotting the next reversal.
The chart below, shows why we’re at The Danger Point®
Wyckoff discussed a phenomenon he called ‘shortening of the thrust’. When price action’s ready to reverse, the directional thrusts become shorter.
We’ll zoom-in on the recent action to show that Friday’s session failed to post a new daily low (high for non-inverted).
Now new low, may be the reversal nuance or not … we’ll find out at the next open (not advice, not a recommendation).
Not shown on the chart, price action’s retraced a Fibonacci 50%, of the entire move from the set-up and reversal of February 2nd, and 3rd.
Summary
Taking it all in aggregate, we’re obviously at an extreme and either going to reverse from here or launch into a sustained continuing directional move.
Note: Posts on this site are for education purposes only. They provide one firm’s insight on the markets. Not investment advice. See additional disclaimer here.
CDC Director Admits Vaccines Do Not Prevent COVID Transmission, Blames “Evolution Of Science”
Throw in a banking crisis or two, credit tightening, supply disruptions and this sector may collapse under the weight of that all by itself (not advice, not a recommendation).
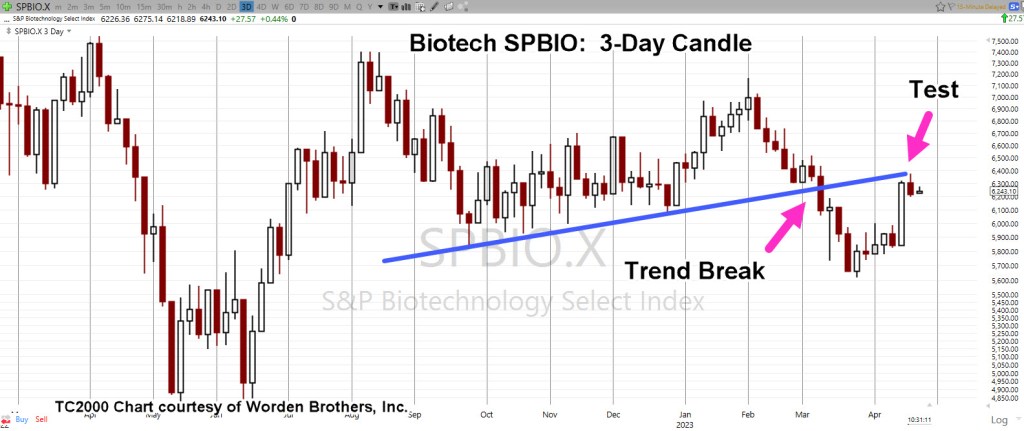
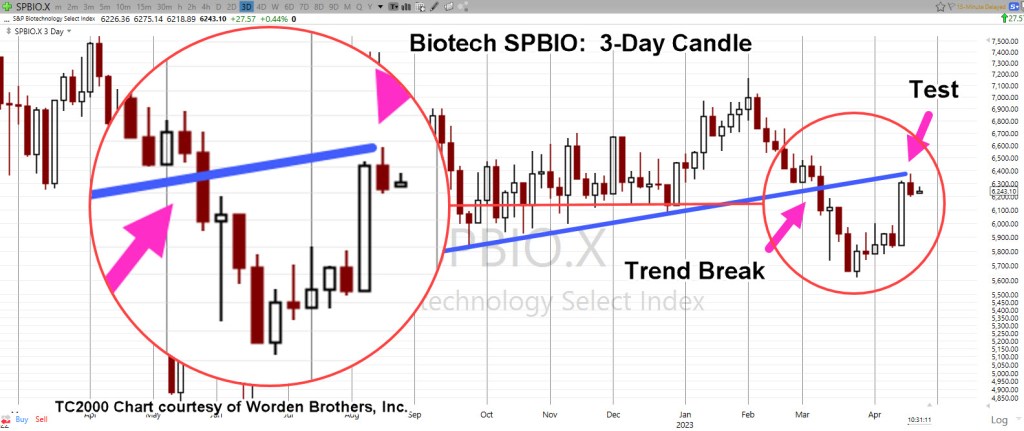
Moving closer in, on a 3-Day chart we see the break and test more clearly.
Biotech SPBIO, 3-Day
We’ll zoom-in on the trend break.
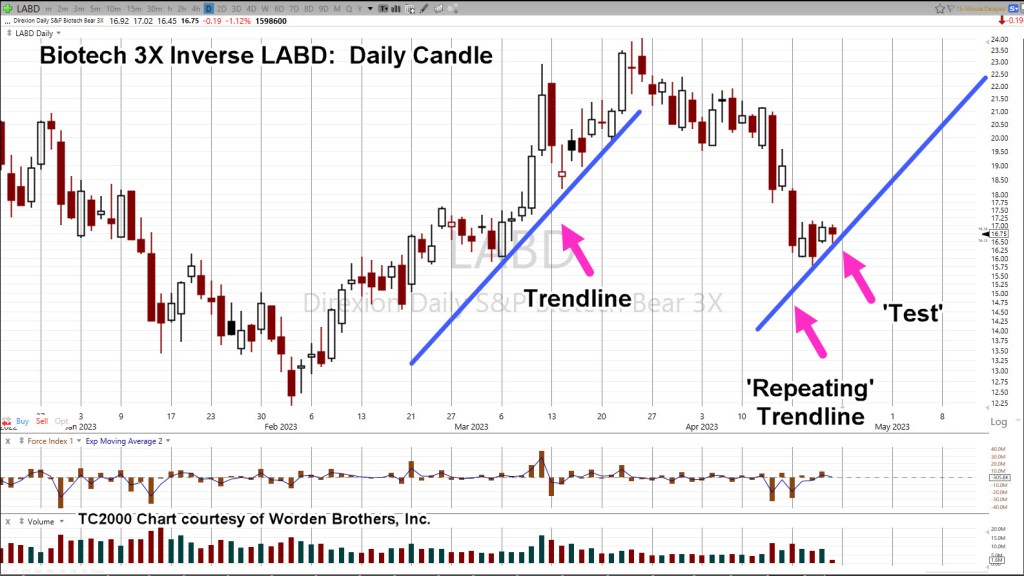
Lastly, going to the 3X Leveraged Inverse Fund LABD, on the daily timeframe, it shows a repeating trendline that may be in confirmation during this session (currently, 11:15 a.m. EST).
Biotech Leveraged Inverse LABD, Daily
It’s still early in the session and anything can happen.
This is where the risk is least (not advice, not a recommendation).
Note: Posts on this site are for education purposes only. They provide one firm’s insight on the markets. Not investment advice. See additional disclaimer here.
The biotech sector’s (upside) correction is complete.
If that’s correct, it’s likely to get very serious to the downside (not advice, not a recommendation).
A massive list of fundamentals, i.e., ‘side effects’, have been documented on this sector’s reprehensible behavior (saying it politely) over the past three years.
‘The List’
From here on out, we’ll call the linked information that follows, ‘The List’. So, we have The Biotech List, linked here, here, and here.
In the past few days we can add more items to the list, here, here and here.
When The Money Runs Out …
Now, it looks like the money (and ‘patient’) spigot is running dry as reported here.
So, let’s see how that’s working itself out for chief cook and bottle washer; biotech, SPBIO.
As usual, we’re looking at 3X, leveraged inverse fund LABD.
SPBIO, Leveraged Inverse LABD, Daily
Sharp reversal to the upside.
We’re nearing the end of today’s session (2:55 p.m., EST) and price action has been relentless.
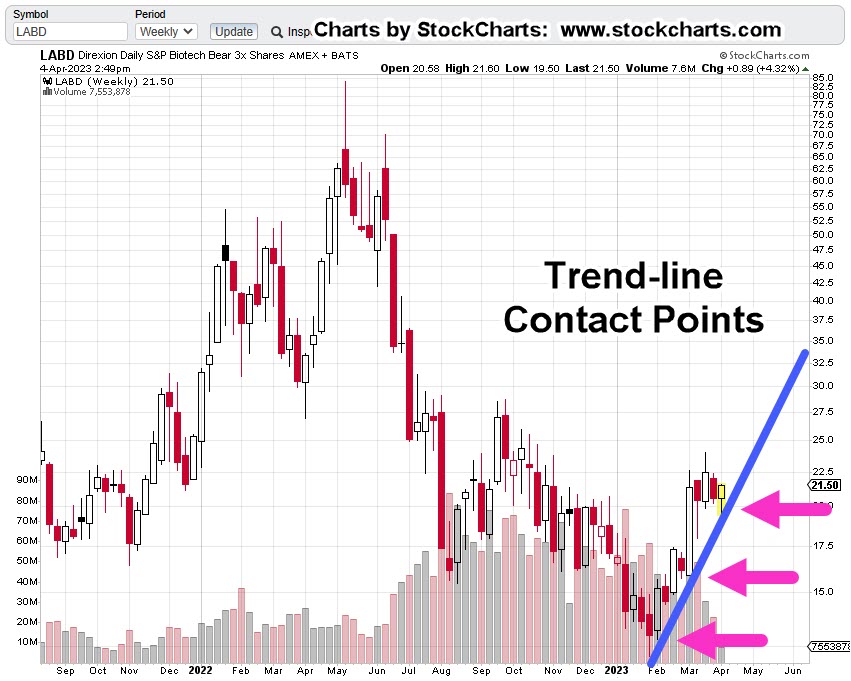
Looking at the weekly chart of LABD, we see the trendline being confirmed.
Biotech Leveraged Inverse LABD, Weekly
A reasonable expectation for the next session(s) is some type of back testing of today’s action … although it’s not required.
Positioning
Yesterday’s downside LABD, action forced the complete exit of the main position that was (in-part) established during the downside thrust on February 2nd.
Overall profit gain on the series, was just over + 44%.
So, we had partial exit with +37%, main exit with +44%.
Later in the session yesterday, it became obvious the downside correction (from March 24th) may be nearing completion; the main position was re-established @ LABD 20.27 (not advice, not a recommendation).
Today’s action puts that entry well in the green.
If this really is the next leg lower (higher for LABD), the expectation is for significantly increased volatility.
Note: Posts on this site are for education purposes only. They provide one firm’s insight on the markets. Not investment advice. See additional disclaimer here.
This time, instead of, The subprime crisis is contained”, we have, ‘The banking crisis is over’.
Back then, as the market crashed into ’09, and then forced (manipulated) higher into 2010 and later, you intuitively knew the next time, there’s no saving it (not advice, not a recommendation).
So, here we are … at the ‘next time’.
However, this time around, it’s different … very different.
Coming out nearly every day, is the massive driver to the downside: Biotech. The updated list on that sector is provided at the end of this post.
For this update, we’re looking at the technical condition and more specifically, biotech leveraged inverse fund LABD.
Biotech Leveraged Inverse LABD, Daily
We’re early in the session (11:03, a.m., EST) and we can see a reversal (if it holds) developing.
Today, is also Fibonacci Day 5, from the high set last Friday, the 24th.
Since today may be a pivot to the upside (biotech index lower), a potential continuation channel line is drawn in the chart below.
As mentioned in the last update, a retrace was probable and hence taking profits with a partial exit.
During the past four trading days, that position has been re-established at lower prices (not advice, not a recommendation).
Insurmountable Fundamentals.
At some point unknown to us, the fundamentals will come into play.
The conditions are insurmountable … they can’t be ignored.
Said many times, this is the driving factor for the market(s) on a go-forward basis (not advice, not a recommendation).
Latest on The Biotech List
We’re going to start first with an article that surmises, the blow-up has already happened. That article is here. The report starts off with profanity; be advised.
Then, the biotech list; growing without bound:
Risk Of Cardiac Death Tripled For Young Women Following AstraZeneca COVID-19 Vaccination: Study
Bombshell Vax Analysis Finds $147 Billion In Economic Damage, Tens Of Millions Injured Or Disabled
CDC Found COVID-19 Vaccine Safety Signals Months Earlier Than Previously Known, Files Show
Three Years To Slow The Spread: COVID Hysteria & The Creation Of A Never-Ending Crisis
Biden Signs Bill To Declassify COVID Origins Intel
“I Couldn’t Remain Silent”: Physician Assistant Fired For Reporting COVID-19 Vaccine Adverse Events To VAERS
A Haunting Anniversary – ’15 Days To Slow The Spread’
Note: Posts on this site are for education purposes only. They provide one firm’s insight on the markets. Not investment advice. See additional disclaimer here.