At The Extreme

We’re about to find out if Biotech’s in a new bull market or at the retrace extreme, ready for reversal.
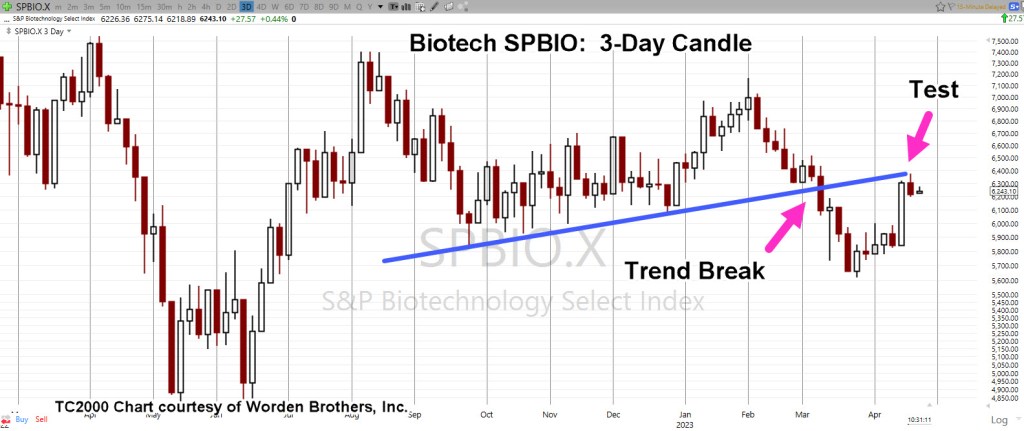
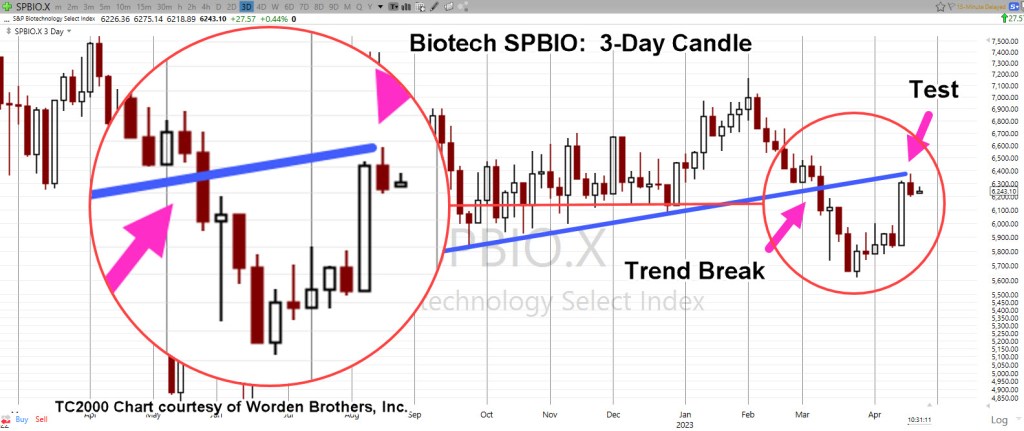
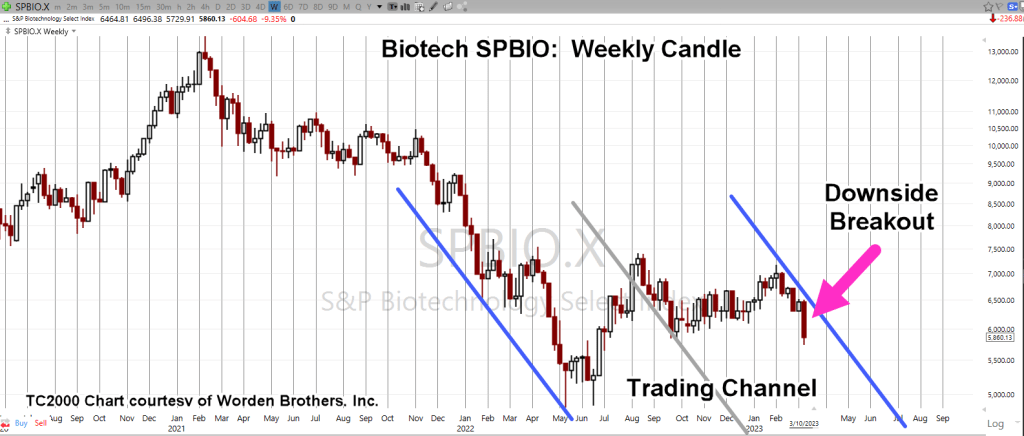
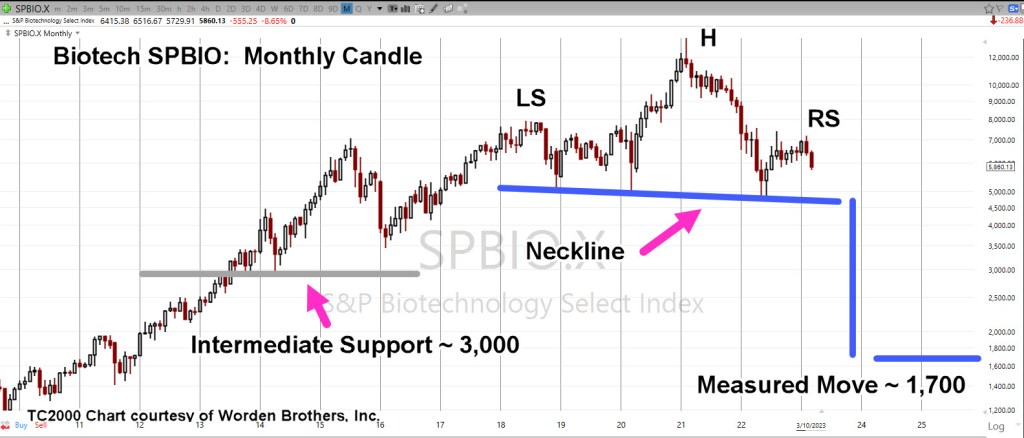
The last update gave us the big picture on the index; a massive H&S pattern, five years in the making.
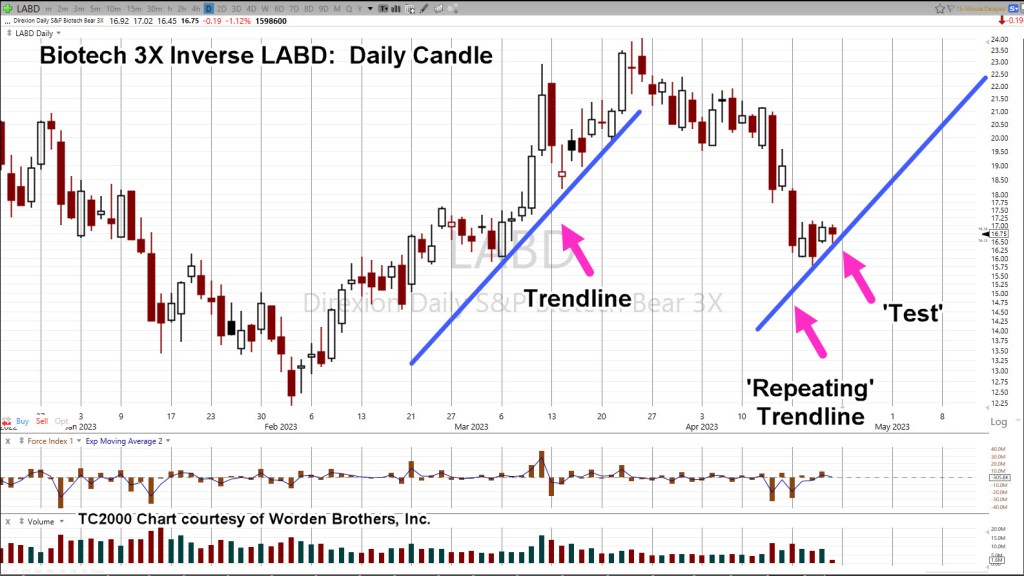
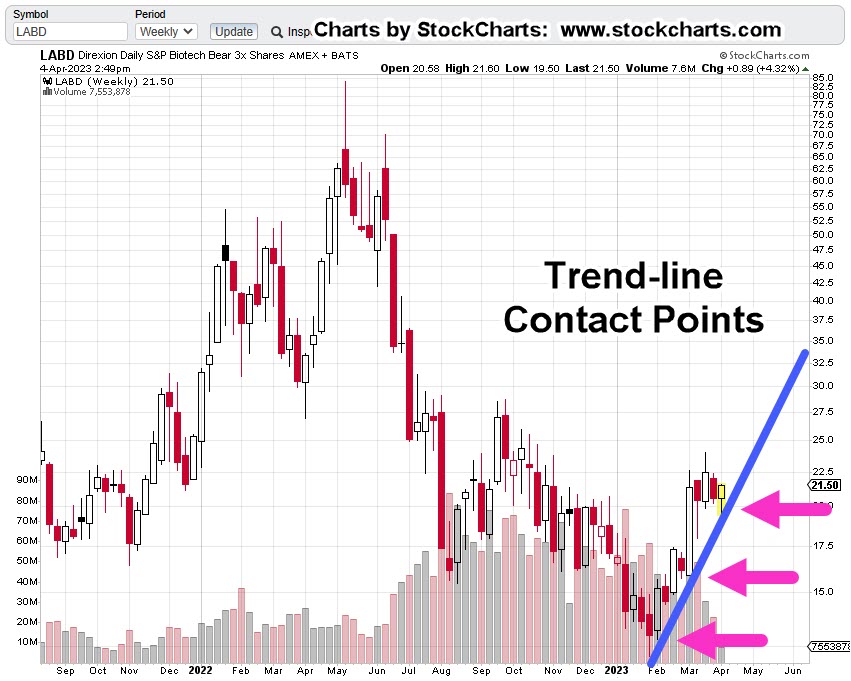
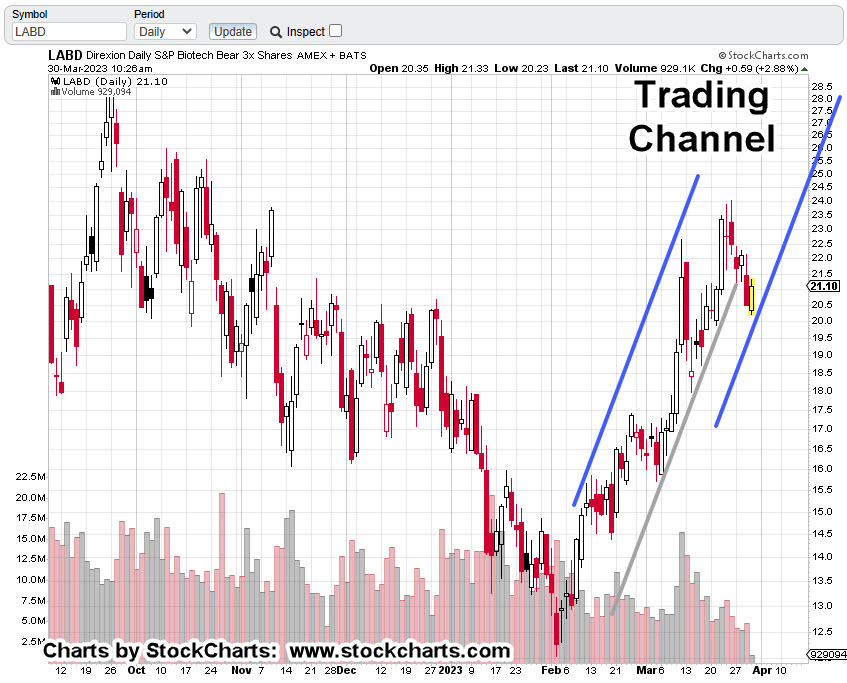
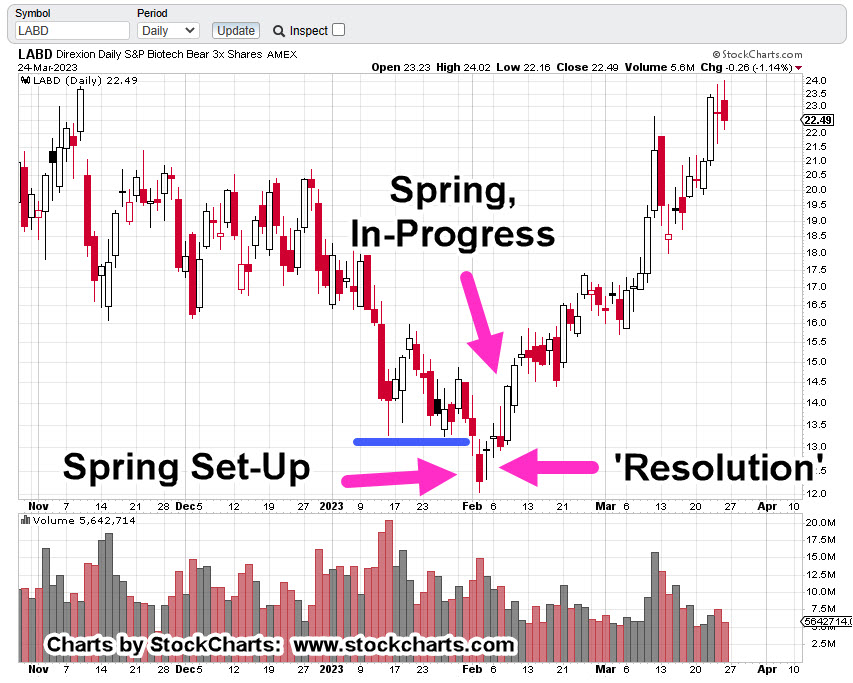
A potential trendline was shown on the daily chart of inverse fund LABD. That trend was subsequently negated by price action just hours later.
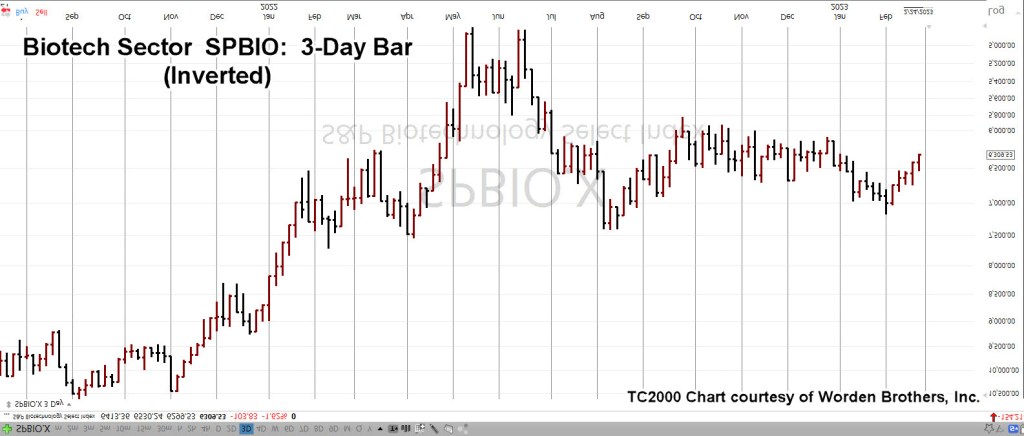
Let’s look at SPBIO, more specifically, the 4-Hour Chart.
To mimic price action of leveraged inverse LABD, we’ll invert the SPBIO.
The reason for inverting, not using LABD, is that leveraged funds have a downward bias which distorts the actual data.
Biotech SPBIO, 4-Hour, Inverted
The chart highlights Point No. 1 and Point No. 2. These areas are identified as a reminder; the prior set-up and reversal was identified, to-the-day.

There’s no guarantee the same performance will be repeated, i.e., spotting the next reversal.
The chart below, shows why we’re at The Danger Point®
Wyckoff discussed a phenomenon he called ‘shortening of the thrust’. When price action’s ready to reverse, the directional thrusts become shorter.
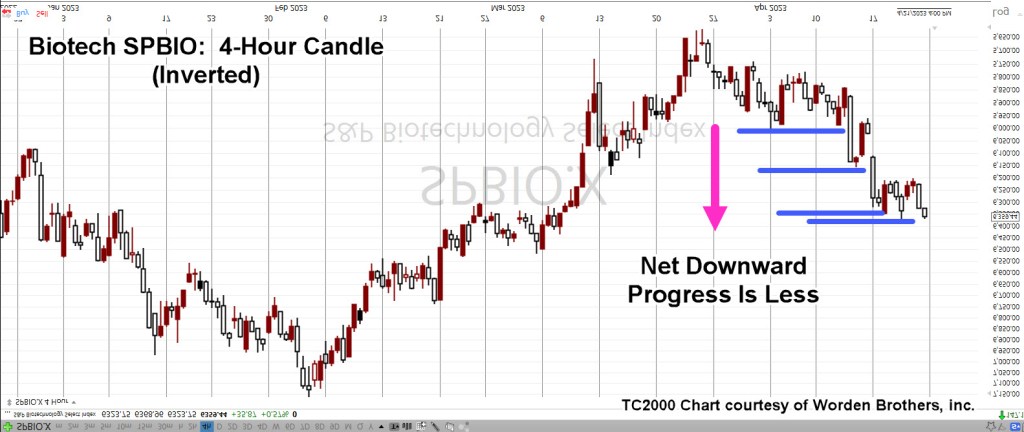
We’ll zoom-in on the recent action to show that Friday’s session failed to post a new daily low (high for non-inverted).

Now new low, may be the reversal nuance or not … we’ll find out at the next open (not advice, not a recommendation).
Not shown on the chart, price action’s retraced a Fibonacci 50%, of the entire move from the set-up and reversal of February 2nd, and 3rd.
Summary
Taking it all in aggregate, we’re obviously at an extreme and either going to reverse from here or launch into a sustained continuing directional move.
Stay Tuned
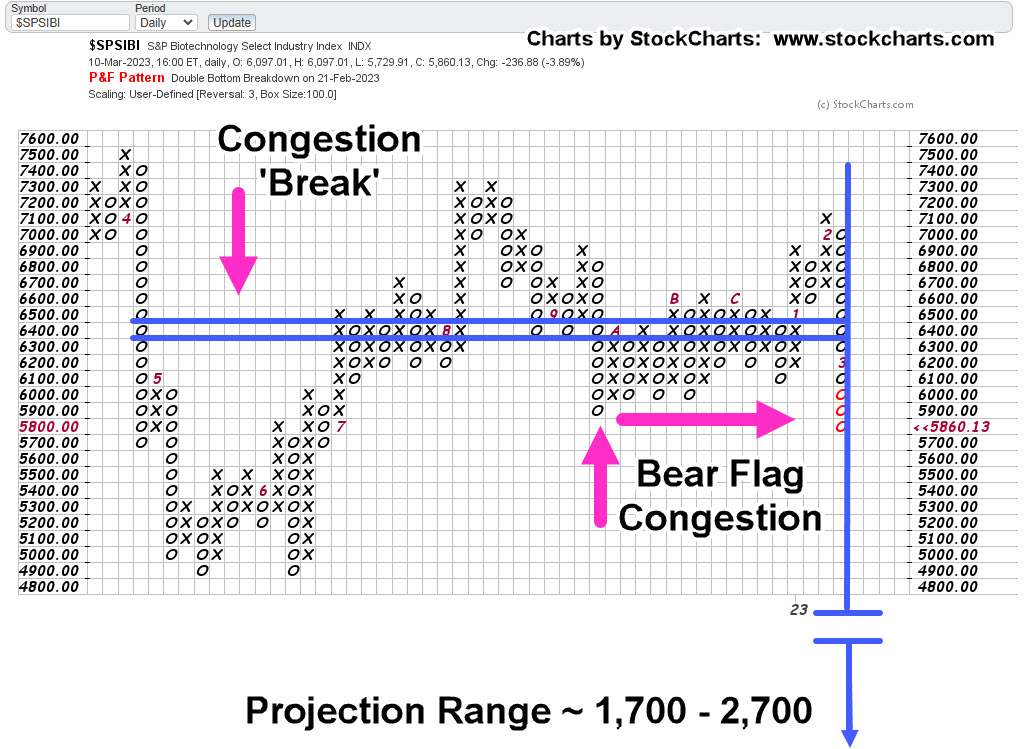
Charts by StockCharts
Note: Posts on this site are for education purposes only. They provide one firm’s insight on the markets. Not investment advice. See additional disclaimer here.
The Danger Point®, trade mark: No. 6,505,279