Biotech … Bear Flag Breakout

A Long Way Down

On February 3rd, also represented as; 2/3/23, it all changed.

That was the day the ‘toxic train‘ derailed in East Palestine, Ohio.

It was also the day biotech sector SPBIO, reversed to the downside.

The biotech reversal was identified to the day with the following quote:

” … today’s action is consistent with resolution of the five-months of congestion …”

Biotech had been in a congestion zone, a bear flag, for an incredible five-months. There’s no other pattern like on the chart of SPBIO (ticker, $SPSIBI, on StockCharts).

The analysis stated that if or when this sector breaks to the downside, the extended period of congestion suggests a long, sustained, move lower (not advice, not a recommendation).

So, here we are.

Now, the downside reversal is obvious. Then again, it’s likely we’re still very early in the move as we’ll see below.

Projection Methods

We’re going to use two projection methods:

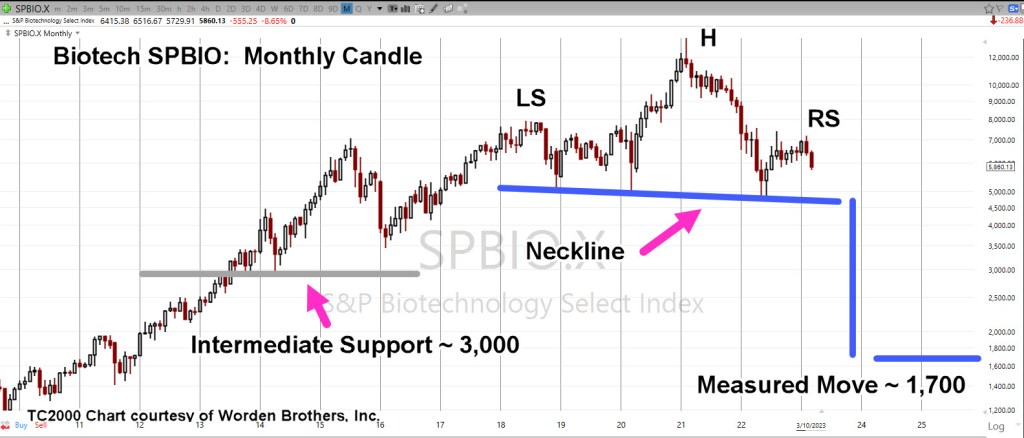
First: The standard classical chart which identifies a potential Head & Shoulders pattern.

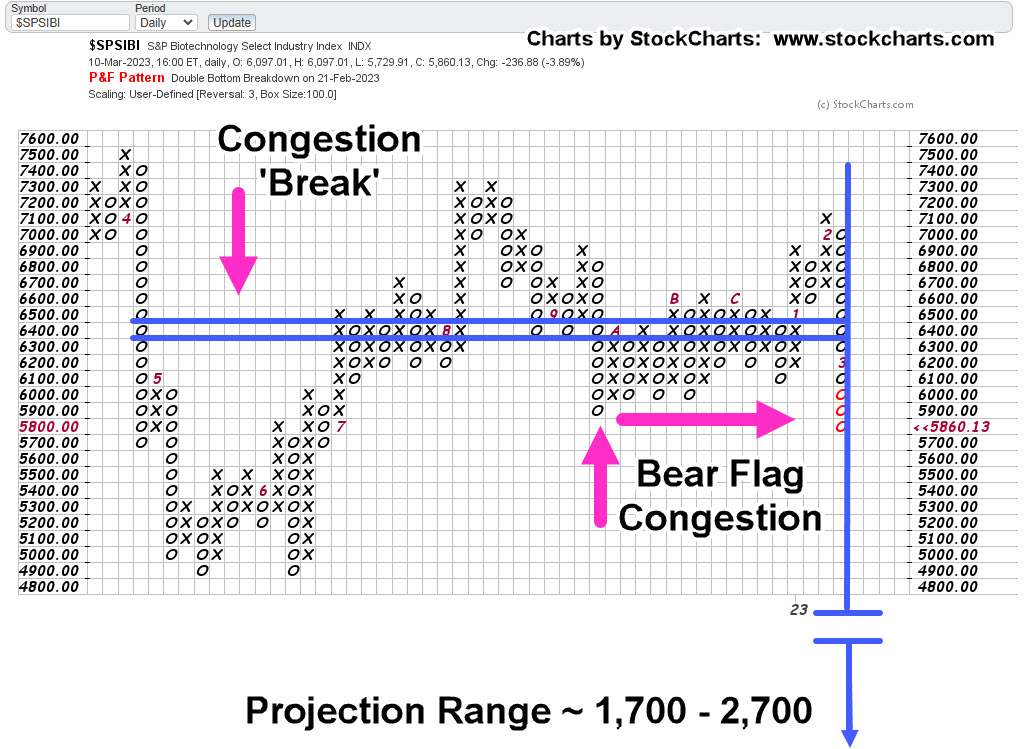
Second: The century old technique of ‘counting’ via Point & Figure (P&F).

Biotech SPBIO, Weekly (Classical)

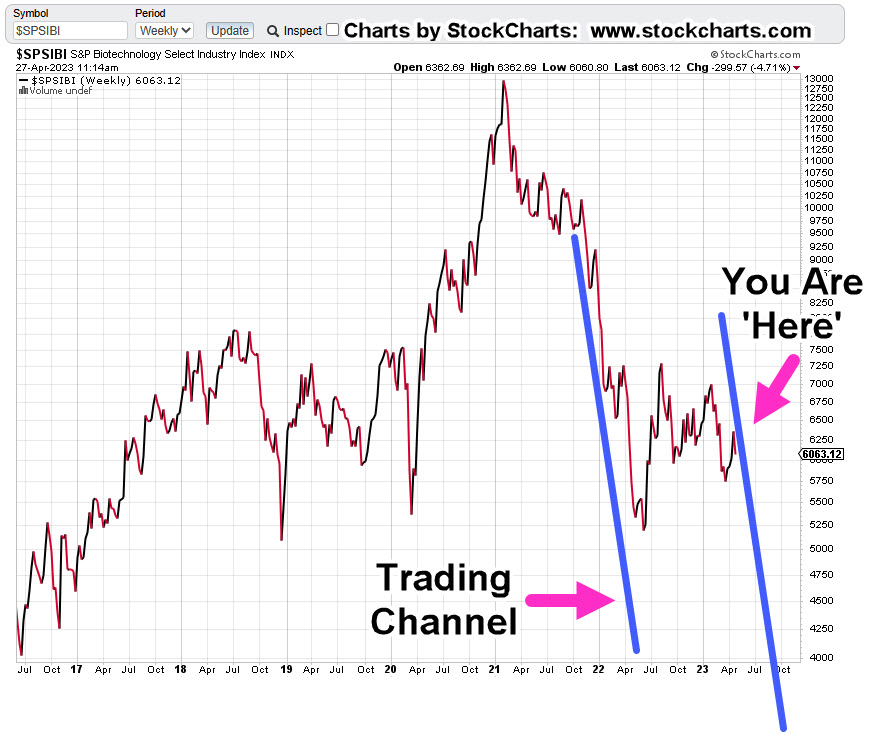
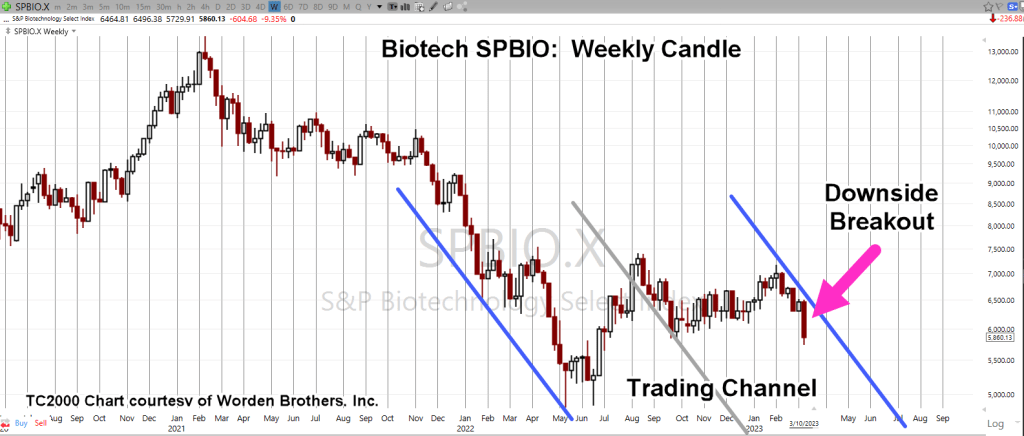
Two charts are in classical format. The first shows the trading channel that spans 39-weeks from week 5/13/22, to week 2/3/23.

Note: Let’s not miss the symbolism (also, here and here): May 13th, 2022, was Friday. Then we have 2/3/23.

“For we wrestle not … “

The second chart is a compressed view.

Note the “3,000-level”, discussed in the P&F section.

Biotech SPBIO, Monthly

If the H&S pattern is in-effect and the neckline is broken, we have a measured move projection to the vicinity of SPBIO ~ 1,700 (not advice, not a recommendation).

Now, on to the P&F.

The ‘P&F’ chart has been used as a forecast tool for over one-hundred years.

The idea is to ‘count’ the number of congestion points and then project that congestion either higher or lower.

In our case of a breakdown, the projection is lower.

Biotech SPBIO ($SPSIBI), Daily P&F

The P&F chart comes up with roughly the same lower projection; approximately 1,700 (not advice, not a recommendation).

Looking at the P&F, we can see a steady amount of congestion with few breaks, that is, until we get to the left-most area.

There, we have a break of twelve boxes.

In classical P&F terms, that break of 12, indicates the SPBIO may ultimately reach the 1,700 level, but price action could be choppy after the initial count.

That initial count equates to around 3,000 for SPBIO, which just so happens to be an intermediate support level as shown on the Monthly chart.

Stay Tuned

Charts by StockCharts

Note:  Posts on this site are for education purposes only.  They provide one firm’s insight on the markets.  Not investment advice.  See additional disclaimer here.

The Danger Point®, trade mark: No. 6,505,279

Biotech … Breakdown, Breakout

‘The Court Jester’

Court jesters reveal truths like no other.

How appropriate then, that someone who typically plays the ‘village idiot’ comes out with the truth.

Whether the ‘false narrative’ is finally crumbling or not, is not directly related to analyzing price action.

It does, however, provide the backdrop.

The ‘Big Reveal’

The last update in biotech had this to say (emphasis added):

If this is the big reversal and biotech is the downside leader, unfortunately, that could mean a planned ‘reveal’ by the mainstream media.

What wasn’t known, was just exactly how the truth would come out. Now, we know.

All of which, brings us to the topic at hand: Biotech SPBIO.

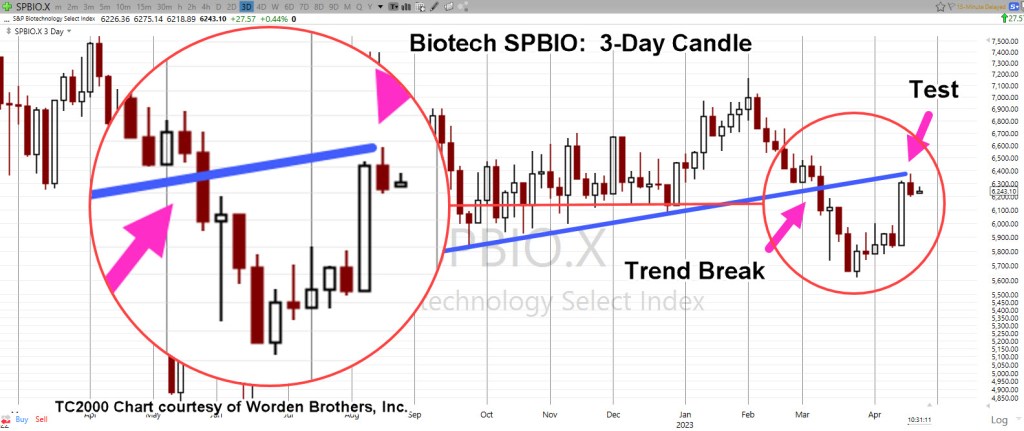
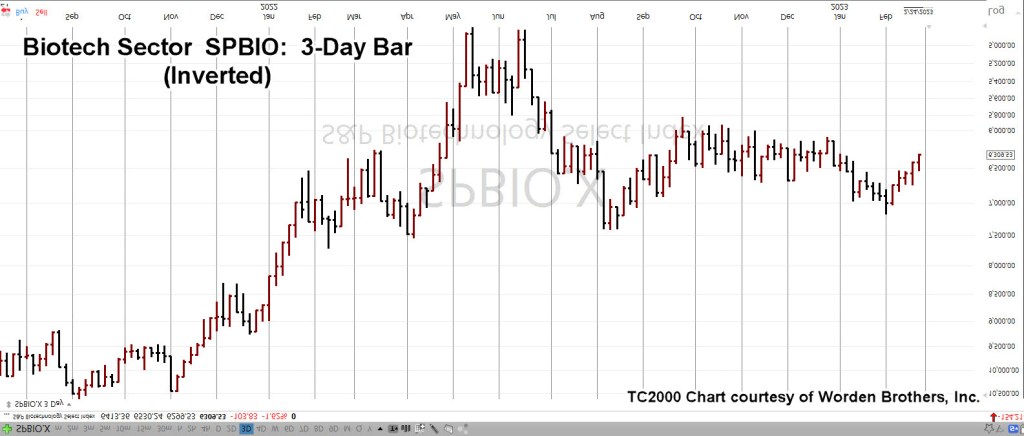
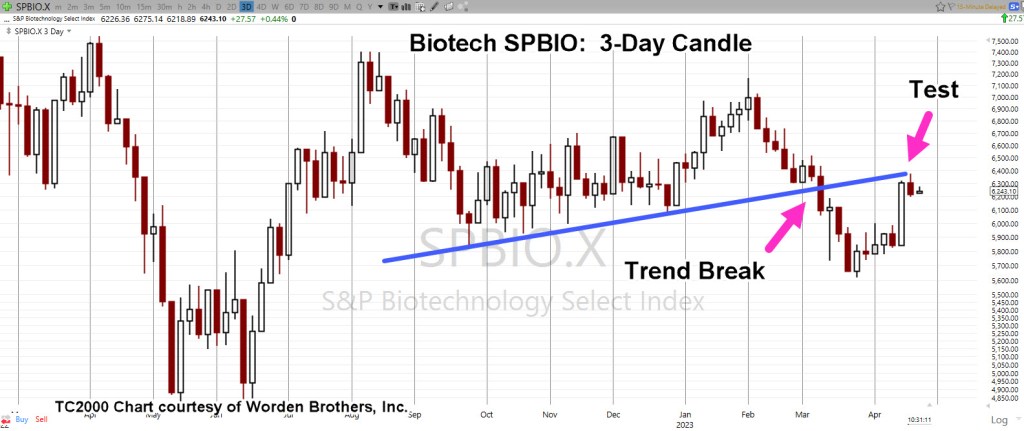
It turns out, SPBIO, is trading most consistently, on a three-day pattern.

Biotech SPBIO, 3-Day

In Wyckoff terms, the market itself defines what timeframes and what support/resistance levels are important.

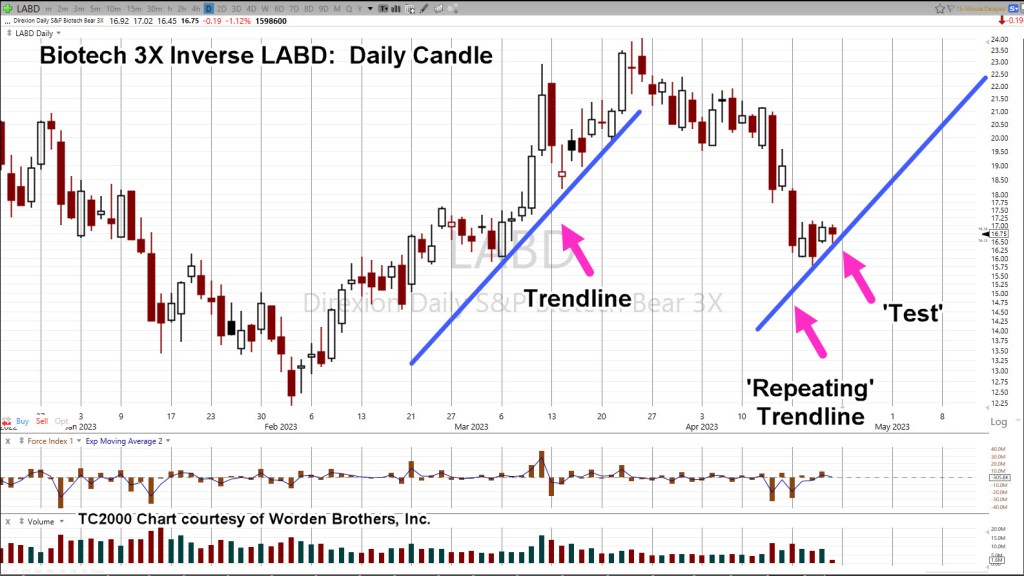
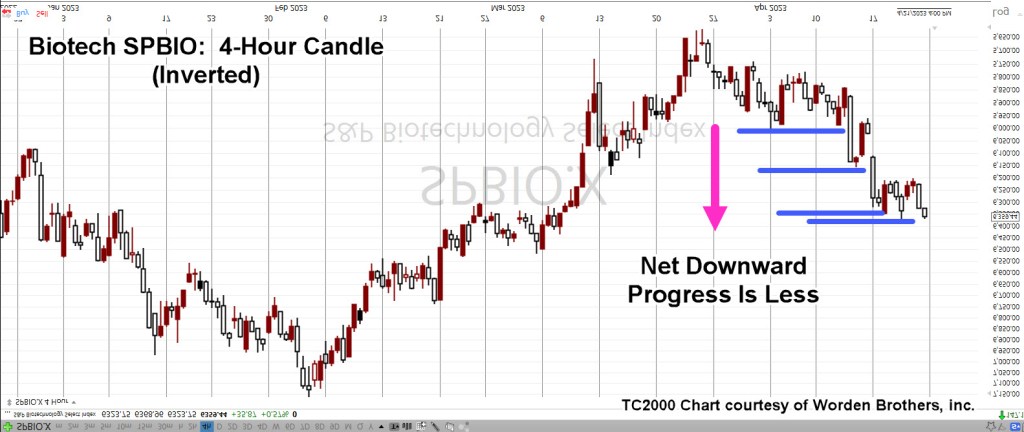
Next up, we’re going to invert the chart to mimic the price action observed on the leveraged inverse fund LABD.

Biotech SPBIO, 3-Day, Inverted

And now, the characteristics of this sector the market itself, has revealed.

At this juncture, SPBIO, trades in a sequence of 3-Days after which, if there’s a directional move, continues on for nine consecutive bars.

After nine-bars, price action typically enters a correction for an undetermined amount of time.

After the correction’s compete the market has (in the past) continued on a directional move for another nine-bars.

Then & Now

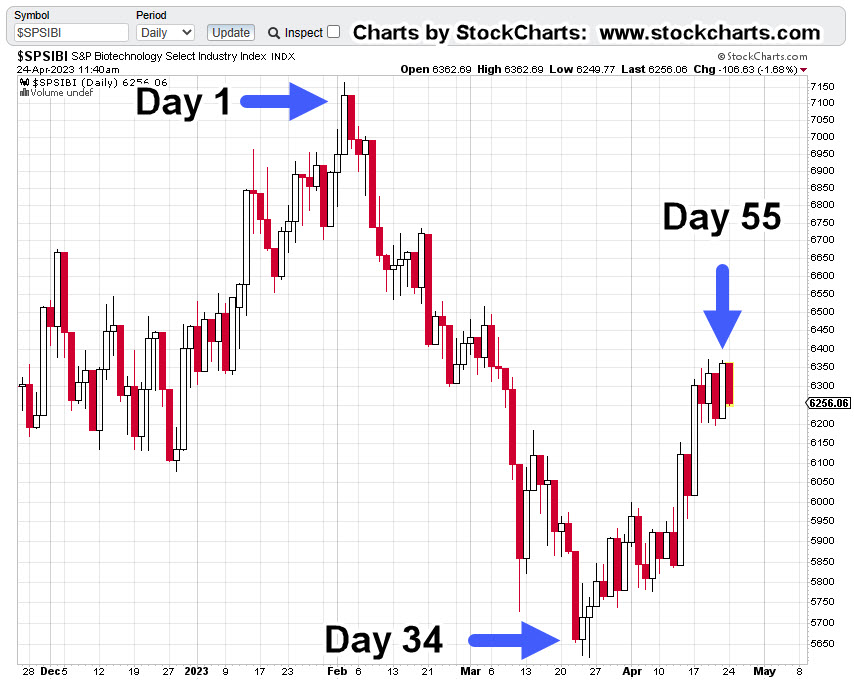
We’re currently in a directional move that’s five ‘3-Day Bars’ in thus far.

If the market adheres to its prior behavior(s), we have at least four more ‘three-days’ to go (not advice, not a recommendation).

Note, the current reversal was identified to the day, with this update:

“However, today’s action is consistent with resolution of the five-months of congestion (not advice, not a recommendation).”

The fact the congestion period for SPBIO has taken so long to (apparently) resolve itself, has produced the potential for price action to go farther, last longer than anyone would normally expect.

That move if it happens, connects well with the introduction at the top of this post; a large part of the public has been informed in no uncertain terms, it was all a lie.

The needle, and the damage done.

Stay Tuned

Charts by StockCharts

Note:  Posts on this site are for education purposes only.  They provide one firm’s insight on the markets.  Not investment advice.  See additional disclaimer here.

The Danger Point®, trade mark: No. 6,505,279
Short Covering, Into The Close ?

Watch For The Weakest

With today’s heavy downward action, as we head into the close, any number of scenarios could play out.

Work has already been done on INTC, KMX, MRNA, Biotech Leveraged Inverse LABD, and others.

With such a decisive push lower, there could be some kind of short covering late in the session.

For example, as of this post 2:15 p.m. EST, KMX (detailed below) appears to be coming off the day’s lows.

CarMax Weakness

The daily chart has KMX, right a the bottom of a trading channel.

Price action may continue to rebound from this area heading into the close or not.

If there’s a rebound, naturally Put options will begin to decay in value … a desired outcome if one is looking to enter short (at the cheapest price possible).

The bottom of the channel line could be all there is for this week or we could be heading to much lower levels.

It’s up to the trader/speculator to decide (not advice, not a recommendation)

Stay Tuned

Charts by StockCharts

Note:  Posts on this site are for education purposes only.  They provide one firm’s insight on the markets.  Not investment advice.  See additional disclaimer here.

The Danger Point®, trade mark: No. 6,505,279

The Moderna Scenario(s)

Potential Moves … Potential Actions

In the markets, anything can happen.

With that understood, we’ll present three potential scenarios for Moderna (MRNA) price action for the upcoming days, or week(s).

When we last left our chief cook and spike-protein injector, price action was in a downtrend but also in Wyckoff spring position; indicating at least a chance for upside.

As with the CarMax (KMX) analysis, still playing out with Scenario No. 2, and/or No. 3, at this link as the forecasted price action, we’ll show potential Scenario No. 1 – No. 3, for MRNA, below.

Moderna MRNA, Daily, Forecasted Action

Scenario No. 1

Upside wedge breakout

Scenario No. 2

Downside wedge breakout with no test

And now, the most probable, ‘If there’s a downside breakout.

From a short-dated options standpoint, Scenario No. 3, is the most desirable (not advice, not a recommendation).

If there’s a downside breakout with no test, there’s always the possibility at some point, there will be a test, which in turn completely wipes out any potential gain in the (put) trade; time would run out and the option expires.

Re-Visiting, Elder

Recall, in the example that Dr. Elder gave, he bought OEX Put Options at 3/8-ths, back in the day when the markets traded in fractions.

Three-eighths is 0.375, which gives a target value on which option to select (not advice, not a recommendation).

To get to that small of a fraction, the option’s either way out of the money, short on time, or both.

Stay Tuned

Charts by StockCharts

Note:  Posts on this site are for education purposes only.  They provide one firm’s insight on the markets.  Not investment advice.  See additional disclaimer here.

The Danger Point®, trade mark: No. 6,505,279

Moderna … Options Strategy

Trend Contact … Then, Pivot Down

With a potential right-side trend (and channel) contact confirmed; shown below at – 86% annualized, odds are now favorable for a Put strategy.

In addition to the technical factors discussed, listed at the bottom of this post are no fewer than 22-links to the current fundamental state of biotech and their ‘handiwork’.

The weekly chart of MRNA, has a Wyckoff Up-Thrust and a test, confirmed by the downside pivot.

Moderna MRNA, Weekly

Notice the reversal action took place at a very weak Fibonacci 23.6% retrace.

The two blue lines on the daily chart (below) are exactly parallel.

The grey lines are parallel to the blue lines and intended to show MRNA, exhibits a repeating (downtrend) pattern.

Moderna MRNA, Daily

The expanded version on the daily has support being penetrated (horizontal blue line) and then ‘spring’ action last Friday as a result.

Of course, it’s ‘what happens next’, that’s the question.

In a prefect scenario, price action would thrust lower for a day or several days and then come back up to test the underside of resistance.

Elder Option Strategy

This strategy is taken from Elder’s book ‘Come Into My Trading Room’, and seeks to use as short-dated options as possible.

Doing so, requires the discipline to wait sufficient amount of time for price action to get into position and for option time value to bleed-off.

Potential Upside

Since we’re already in spring position and price action moved off the lows on Friday, MRNA could continue the upside right back to, or past the downtrend line.

However, with massive (undeniable) fundamentals building buy the day, and MRNA being mentioned specifically in at least one link below, probabilities favor the downside.

Supporting Links For The Bearish Stance

Florida Surgeon General Warns Life-Threatening VAERS Reports Up 4,400 Percent Since COVID-19 Vaccine Rollout

US Says Government, Not Moderna, Should Face COVID-19 Vaccine Lawsuit

New Medical Codes For COVID Vaccination Status Raise Concerns Among Experts

Watch: Rand Paul Grills School Of Nursing Head On Student COVID Vaccine Mandate

US Navy Lifts COVID Vaccine Mandate For Sailor Deployment

Mainstream Media Continues To Push False ‘COVID Heart’ Narrative To Explain Excess Deaths

NFL Players’ Association Urged To Screen for Heart Issues Over Vaccine Side Effects

WHO Suddenly Shelves Plans For Second Phase Investigation Into Origins Of COVID-19: Report

Watch: CDC Director Suggests It Will Never Change Child-Masking Policy

Rand Paul Introduces Bill To Halt Funding For Hospitals Denying Care To The Unvaxxed

Welfare State Weakens… 30 Million Americans Are About To Lose ‘COVID’ Food Stamp Handouts

IMF Says World Needs To Prepare For The “Unthinkable” After COVID, War In Ukraine

COVID Emergency, Climate Emergency: Same Thing

Novavax To Sell US Government 1.5 Million More Doses Of COVID-19 Vaccine

“World’s First” Unvaccinated Dating Service Launches In Hawaii

Living The Lie

‘COVID-Curing’ Sorrento Therapeutics Plunges After Filing For Chapter 11 Bankruptcy Protection

What Can We Learn From The Biggest Lies People Believed About COVID?

Censorship Operations: COVID, War, And More…

CDC Director Defends Mask Mandates After New Study Shows Masking Has Little Effect

Bivalent COVID Vaccines Perform Worse Against Variant Now Dominant In United States: Studies

COVID NEWS COMPILATION WITH NUMBER 33

Stay Tuned

Charts by StockCharts

Note:  Posts on this site are for education purposes only.  They provide one firm’s insight on the markets.  Not investment advice.  See additional disclaimer here.

The Danger Point®, trade mark: No. 6,505,279
Biotech Bobsled, Starts … Down

Slowly, At First

Of all the major indices for today’s (Wednesday) session, biotech’s SPBIO, Leveraged Inverse Fund LABD, had one of, if not the largest gain @ +10.48%.

The last update identified two sectors to watch for short positioning: Real Estate IYR, and Biotech SPBIO; Short positioning via leveraged inverse funds DRV, and LABD, respectively (not advice, not a recommendation).

Since that post, DRV is up + 1.74%, and LABD is up + 8.58%, both measured on a close basis.

The ‘Big Reveal’

Remember: When price action turns south, that’s when the bad news comes out.

If this is the big reversal and biotech is the downside leader, unfortunately, that could mean a planned ‘reveal’ by the mainstream media.

Anyone going to alternative sites such as BitChute, ZeroHedge, Rumble, know full well what’s happening.

Maybe we’ll have another distraction like the 100-th (at last estimate) food processing plant fire or even something totally retro, like a balloon flying across … oh, wait. 🙂

Biotech SPBIO, Leveraged Inverse LABD

We’ll get straight to the point as prior updates have built a substantial case for a long term, significant reversal.

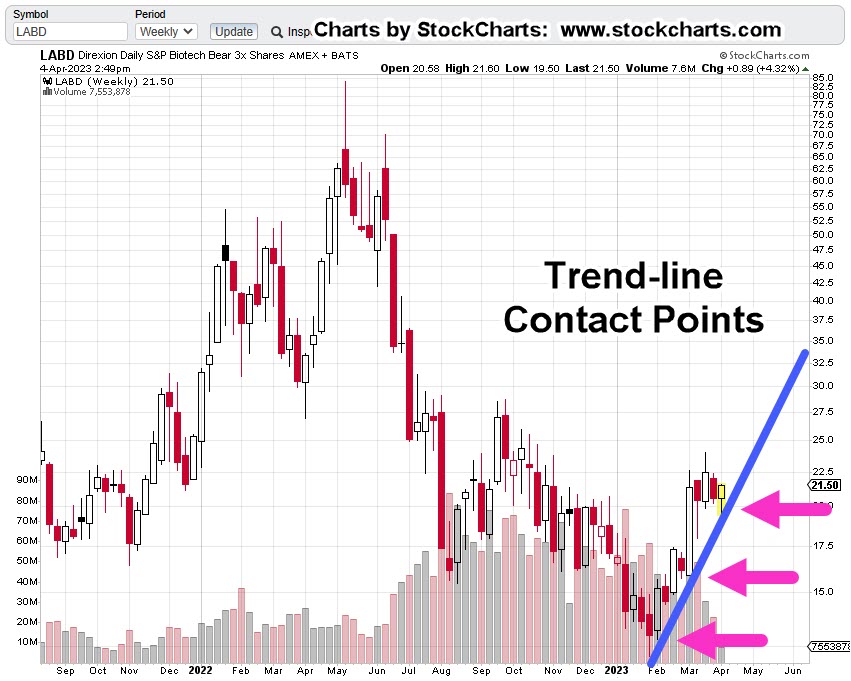
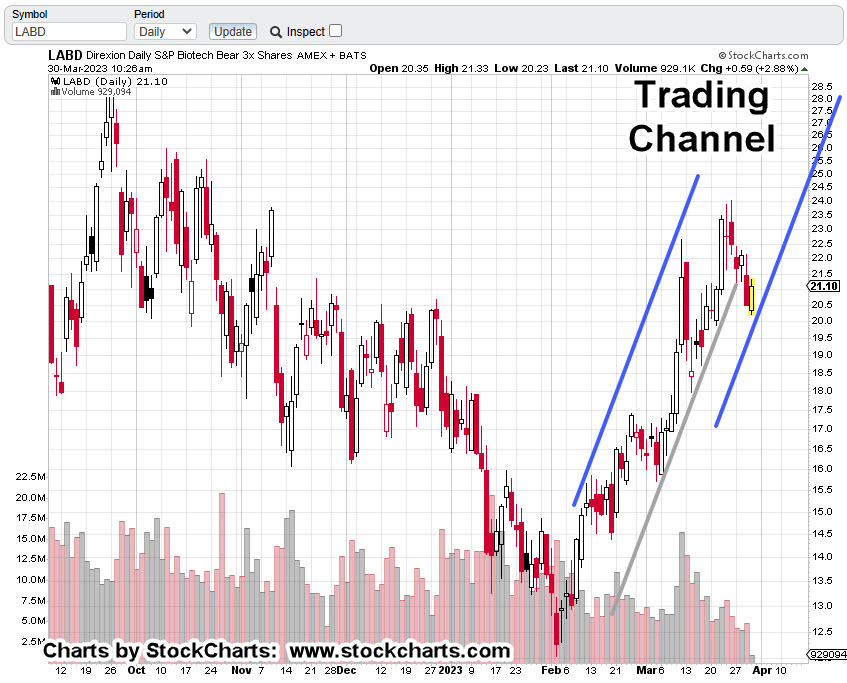
Recall, LABD is the leveraged inverse of SPBIO. The daily chart shows the current set-up.

This site does not provide investment advice.

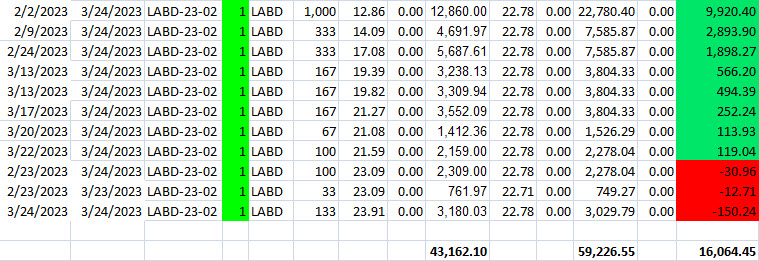
With that said, one could infer from this prior post (at the bottom), a position in LABD had already been established and included a hard-stop.

That was indeed the case.

Next Steps

There’s no guarantee on how far or how long a directional move will go.

However, for SPBIO, one can observe since the February 2021, reversal from all-time highs, a sustained, directional move typically lasts 4 – 6 weeks.

The next update will show the best chart timeframe (multiple days) that resulted in capturing the majority of the directional moves since the February 2021-high.

Stay Tuned

Charts by StockCharts

Note:  Posts on this site are for education purposes only.  They provide one firm’s insight on the markets.  Not investment advice.  See additional disclaimer here.

The Danger Point®, trade mark: No. 6,505,279

The Moderna ‘Channel’ … Redux

… And The Weekly, ‘Summary & Strategy’

The last update about our chief cook and bottle washer of gene ‘modification’ had this to say about price action.

“We’re about forty minutes into the session; Moderna (MRNA) has just confirmed the up-thrust reversal discussed in the last update“.

From that point Moderna (MRNA) declined for seven weeks for a total of around – 31.5%.

However, that’s not the most important part.

In that update, a trading channel was shown which at the time, was declining at – 93.7%, on an annualized basis.

Well, the channel is back.

Only this time, probabilities and price action have come together to set up for a potential sustained decline.

Moderna MRNA, Weekly

Above, we have a Wyckoff ‘Up-Thrust’ and a test that has since turned lower.

Next, we have a series of repeating trend or channel lines.

Additional data has modified the downward slope to be declining at approximately – 90%, annualized.

From a fundamental standpoint, the data set is enormous on the events of the past three years.

At some point that data could provide a huge tailwind for downside action.

For now however, let’s stick with what price action is telling us and go to the Summary & Strategy

Summary & Strategy

The past week has identified two areas of position or trade execution and two areas for possible short-term options execution (not advice, not a recommendation):

Position or Trade: Real Estate IYR, and Biotech SPBIO

Options: Carmax KMX, and Moderna MRNA

As a reminder, most if not all trade analysis is for the short side (not advice, not a recommendation).

Final Thoughts

Since we have possibly the largest bull trap in market history with huge numbers of VIX Call options, the following week may be subdued by going modestly up, sideways or down, slowly.

With that said, options positioning (if any) could be slated for the week of 2/17/23.

As always, price action is the final arbiter.

Stay Tuned

Charts by StockCharts

Note:  Posts on this site are for education purposes only.  They provide one firm’s insight on the markets.  Not investment advice.  See additional disclaimer here.

The Danger Point®, trade mark: No. 6,505,279

Biggest Bull Trap, in History ?

Slow Descent, At First … Then, Mass Sell-Off ?

The large number of VIX (volatility) Calls, tells us, not to expect an immediate sharp move lower.

Those Calls will likely need to be bled-off in value, before we get a significant downward spike … if there is one.

Market Summary, Watch List

Over the past week, there are two markets that are being monitored for short position entry: Real Estate and Biotech; IYR, and SPBIO, respectively.

After nearly five months of price action whipsaw and congestion, biotech appears to be in a nascent downside reversal. Real estate looks to have reversed today (not advice, not a recommendation).

Biotech has been the weakest (technically) of all the major indices (except miners, GDX and GDXJ).

We’re going to look at the daily chart of SPBIO, to see the opportunity and the risk.

Biotech SPBIO, Daily Close

Since late September last year, there has been sideways-to-up, price action congestion.

Price action today, appears to have resolved into a nascent reversal.

We’re going to invert the chart to mimic the leveraged inverse fund LABD, showing the opportunity and the risk.

SPBIO, Daily Close (Inverted)

The prior two days of Fed induced bullish short-covering hysteria, have resulted in a decisive penetration of the support level, as shown.

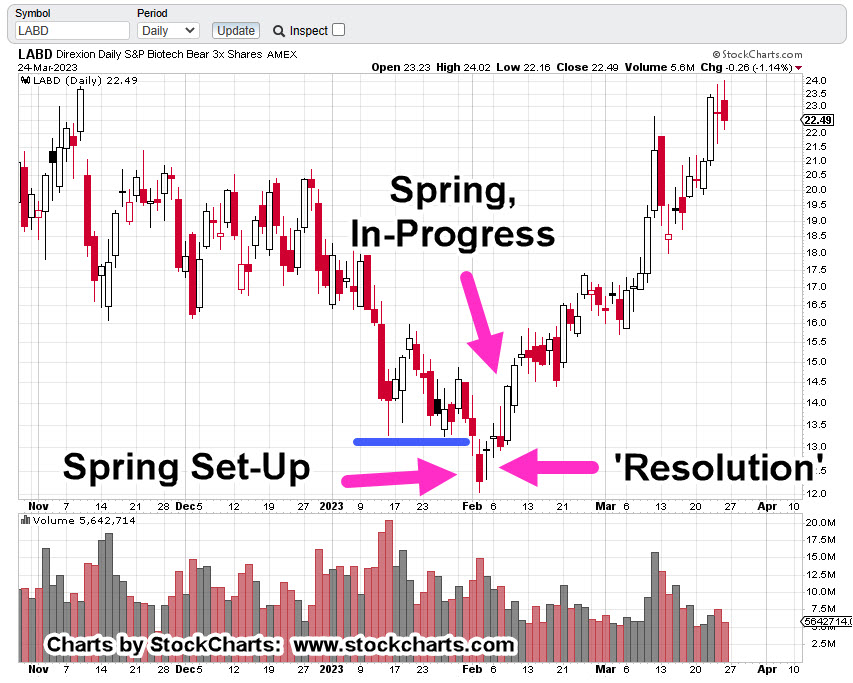
By definition, this puts us in Wyckoff ‘Spring Position’; be on guard for a potential reversal.

Positioning

There have been many false starts to this sector’s reversal as evidenced by previous posts.

However, today’s action is consistent with resolution of the five-months of congestion (not advice, not a recommendation).

Every trading/speculator has their own style and this site does not give financial advice.

With that said, a (highly leveraged) short entry via LABD, would have a hard stop at today’s low.

At present (2:15 p.m., EST) and entry at LABD 12.91 would have a stop at 12.45, yielding a ‘risk’ of 0.46-pts.

Stay Tuned

Charts by StockCharts

Note:  Posts on this site are for education purposes only.  They provide one firm’s insight on the markets.  Not investment advice.  See additional disclaimer here.

The Danger Point®, trade mark: No. 6,505,279

Et Tu, Biotech ?

Biotech SPBIO Joins The Ranks In ‘Danger’

The clock is ticking for biotech in so many ways. Now, one more event.

Shown below is an inverted chart of biotech sector SPBIO.

While all the major indices have posted a bear market rally above their 200-Week moving average (except the miners), the SPBIO, has remained firmly below those levels.

Now, today, we have a decisive penetration of resistance as shown on the daily below.

The chart has been inverted to mimic the 3X Leveraged Inverse Fund LABD.

So, ‘resistance’ now becomes ‘support’ on the inverted chart.

Biotech SPBIO, Daily (Inverted)

We’ve penetrated ‘support’. Therefore, we’re in Wyckoff ‘Spring Position’, ready for reversal.

Even as this post is being created (2:25 p.m., EST), LABD is coming off its lows; currently trading at LABD: 12.61

A push back above support (approx. LABD 14.00 area), would indicate the spring reversal, is underway (not advice, not a recommendation).

Stay Tuned

Charts by StockCharts

Note:  Posts on this site are for education purposes only.  They provide one firm’s insight on the markets.  Not investment advice.  See additional disclaimer here.

The Danger Point®, trade mark: No. 6,505,279
Biotech … Breakout or Breakdown

The Usual Suspects

During the past three months, biotech index SPBIO, has been oscillating, coiling like a spring; preparing for a dramatic move.

Then yesterday (Thursday), there’s an upside launch.

We now have price action instability; either the bulls or the bears are in control.

At this point, we don’t know who has the upper hand.

However, based on the list of recent news items below, it does not look good for the bulls.

Biotech’s Frankenstein

Within the past few days, we have this:

Deadline Passes For Pfizer To Submit Results Of Post-Vaccination Heart Inflammation Study To US Regulators

FDA Deviated From Normal Process In Pfizer Vaccine Approval, Documents Show

Former Employees Sue ESPN After Being Fired For COVID Vaccine Refusal

Lead Author Of Research On Pfizer And Moderna Trials Warns COVID Vaccinations Must Be Stopped

Pentagon Drops COVID-19 Vaccine Mandate For Troops

Let’s see if the market’s ready to hand it to this sector. What’s the price action telling us.

Biotech SPBIO, Weekly

The weekly chart shows the potetial breakout.

However, since we’re looking at this from a ‘going short’ perspective (not advice, not a recommendation), the chart following this one is inverted.

When we invert the chart, it takes on a whole different look.

Biotech SPBIO, Weekly (Inverted)

If price action’s spent over three months getting where support has been penetrated only to have it fail into a reversal, the ensuing move has massive potential.

In Wyckoff terms, it’s cause and effect.

The ’cause’ has been three months of congestion. The ‘effect’ is a potential long duration, or wide volatility move.

Before The Open

It’s twenty minutes before the open and 3X leveraged inverse fund LABD, is trading higher by about +3.5%.

This is normal behavior whether we have a reversal or not.

One last check of ZeroHedge, before releasing this post turns up this:

Senator Questions CDC On Why It Claimed No ‘Unexpected Safety Signals’ For COVID Vaccines

The ‘monster’ continues to grow.

Stay Tuned

Charts by StockCharts

Note:  Posts on this site are for education purposes only.  They provide one firm’s insight on the markets.  Not investment advice.  See additional disclaimer here.

The Danger Point®, trade mark: No. 6,505,279