Pre-market action has all major indexes trading lower; SPY, DIA, QQQ, SOXX and IWM; all down.
Real estate, IYR has no real pre-market volume (20-shares) so its open is unknown. However, inverse fund DRV, does have volume (3,700 shares) and its action is up about 4%.
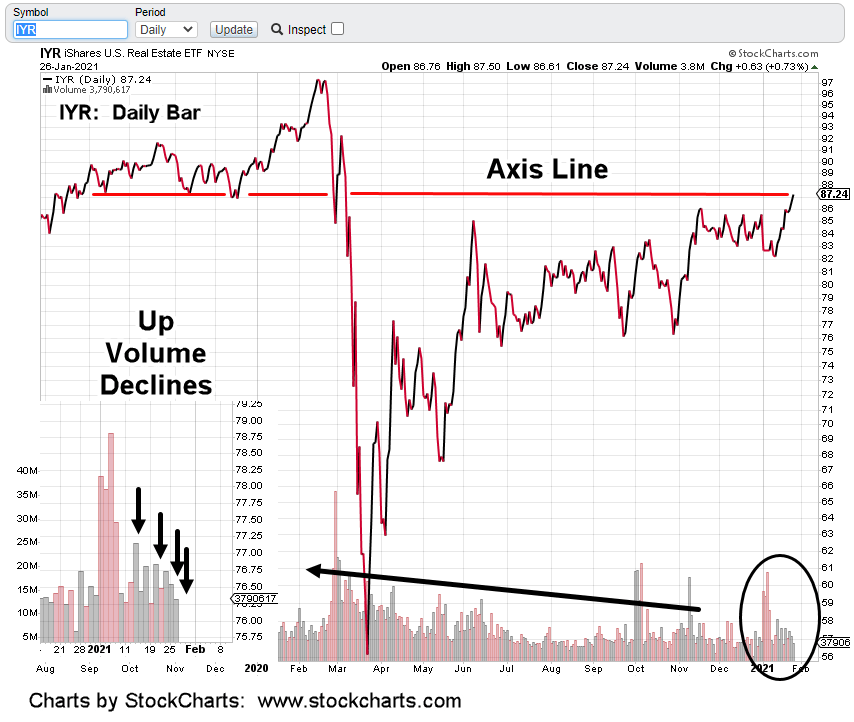
The daily close chart of IYR (above), has price action contacting an established axis line.
That was yesterday. Over the past two-weeks, as price ratcheted higher volume has declined (circled area enlarged).
That decline indicates lack of commitment at these levels.
Yesterday’s close also put IYR firmly in up-thrust position (ready for reversal).
Over the past week, short positions were opened using DRV (not advice, not a recommendation)
Average price of the short equates to DRV @ 9.92; not far from current pre-market trading.
If IYR posts a new daily low (below 86.62), it’s another data point the anticipated reversal may be at hand.
The rising action has changed the P&F forecast reported a few days back. Updates will be forthcoming.
If this is the start of a sustained reversal, the plan is to build the short position as price action dictates.
The downside of the entire market (S&P, Dow, etc.) is immense. Commercial real estate is especially vulnerable. Price action itself tells us that.
Note: Posts on this site are for education purposes only. They provide one firm’s insight on the markets. Not investment advice. See additional disclaimer here.
Note: Posts on this site are for education purposes only. They provide one firm’s insight on the markets. Not investment advice. See additional disclaimer here.
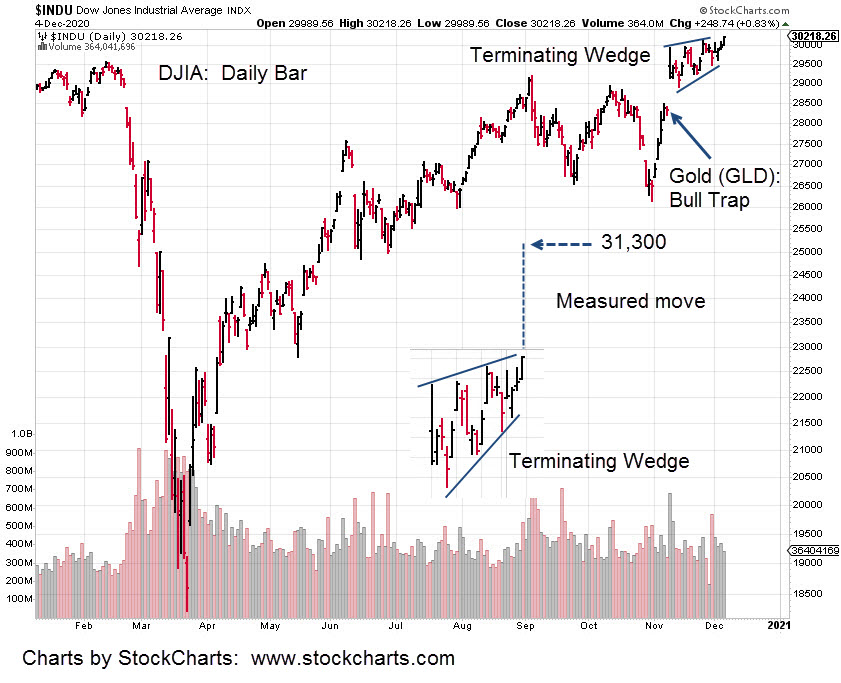
The Dow can either reverse right here or breakout higher from its wedge.
Since the trend is already up, a breakout to the upside is more likely. Such a move brings in a forecast to around 31,300.
The daily chart below has the last part of the wedge expanded and posted at the bottom of the chart.
Important to note is the location of the Gold (GLD) bull trap.
Recall, the firm went heavily short (via JDST) on that Friday and had to wait over the weekend to find out if the analysis was correct.
This excerpt (emphasis added) is from the November 7th, update. It was a Saturday; we’re already short and waiting.
“No doubt, there are a lot of well respected traders, analysts, YouTuber’s that are on the bullish side of the market. Here are just some examples, here, here, and here.
So, at this juncture, this firm is taking the opposite side of the trade with its re-established position in JDST.”
The following Monday in the early morning hours, gold prices collapsed. The bulls were trapped.
As the market opened with gold down hard, the Dow and S&P both spiked up in what’s now a terminal wedge.
‘Terminal’, because this type of price action typically comes at the end of a sustained move … up or down.
At this juncture, the firm is positioned short gold (via DUST) with a tight stop (not advice, not a recommendation).
The stops (two trading accounts short) are not mental, out of the market but are actual open GTC stop orders.
That way if there’s an internet upset or power grid problem, the in-the-market stops will provide some amount of protection.
All of the above may be an excellent analysis of current conditions.
However, behind the scenes, the macro or the real agenda, is deadly serious.
The ‘plan’ all along is to destroy (and subjugate) the middle class. That’s been in the works for decades. Neo Feudalism.
ShadowStats reports here, real unemployment spiked to 35% early in the year and has come down to just over 25% now.
That level is still above 1930s, depression-era numbers and we’re just at the first wave of middle class destruction.
Throw in more economic turmoil and a stock market crash. Then we have ‘fait accompli’. Only a tiny remnant could be left unscathed.
Note the picture at the top: The haves and have-nots.
From The Money GPS: ‘The chasm in-between the haves and the have-nots, grows every single day’
Self employment is the key. It’s not a guarantee but it does offer flexibility and most importantly it may offer some extra time.
The above statements may seem harsh (possibly outlandish) to those not yet awake.
To help in that area, two links are provided here and here. See for yourself whether or not we’re at a critical juncture.
Based on yesterday’s analysis, the expectation is for gold and the miners (GDX) to continue lower.
If they do and the markets (Dow, S&P) continue higher, it’s just one more indication the time for reversal is near.
Note: Posts on this site are for education purposes only. They provide one firm’s insight on the markets. Not investment advice. See additional disclaimer here.
“If the market (S&P, Dow, NASDAQ) opens lower tomorrow, Friday and continues decisively lower, we might add Tuesday, November 24th, 2020, as another empirical data-point for Holiday Turns.”
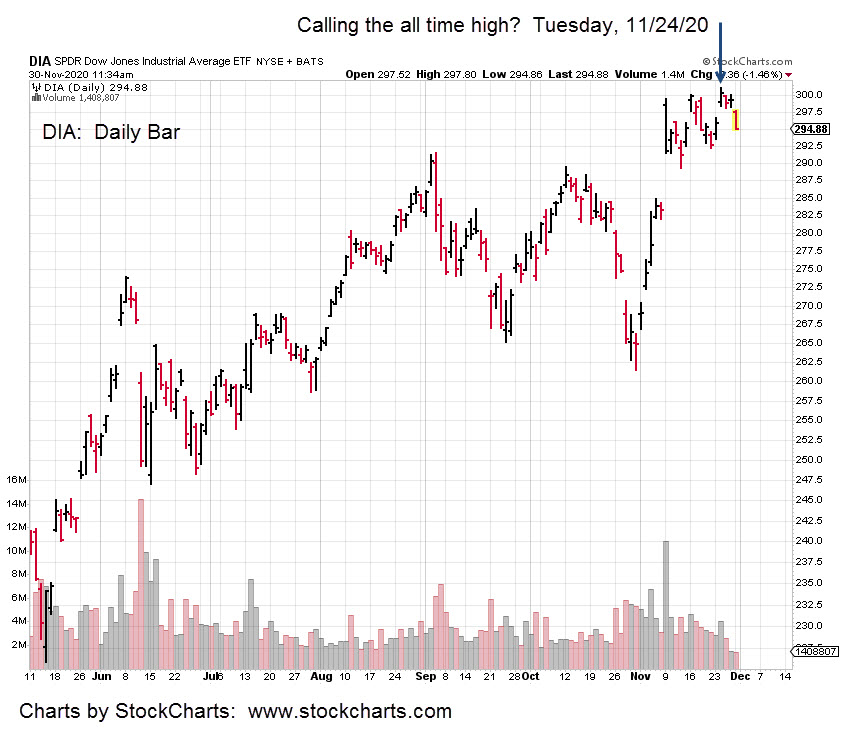
Well, it looks like the market waited one additional day to make its turn. For the Dow 30, last Tuesday the 24th, was indeed a high.
We’ll see how far this one goes. It’s a high but whether or not it’s THE high is not known.
Given the market conditions being reported on this site, long positions look tenuous indeed (not advice, not a recommendation).
The ever helpful, knowledgeable financial media says ‘it’s the best month since 1987’. No elaboration on that one is necessary.
The takeaway is, understanding that market pivots tend to occur during a holiday week … when no one is looking.
In other markets, gold (GLD) continues lower and is attempting to take the miners (GDX) down as well; currently oscillating near unchanged.
Biotech pushes into its breakout but at this juncture (11:53 a.m. EST), it looks weak and may not have energy to get to a new all time high.
It should be obvious the manipulators are hard at it … attempting to get the sector (IBB) to move high enough for gains on the long side, then turn around and establish low risk short positions.
Wyckoff noted that under such conditions (exit longs, enter shorts), daily volume will be two-to-three times greater than typical.
Chart of DIA is below … showing reversal since last Tuedsay, the 24th.
Note: Posts on this site are for education purposes only. They provide one firm’s insight on the markets. Not investment advice. See additional disclaimer here.
Market tops and reversals tend to occur just before, during, or just after a holiday week.
Will this market be any different?
Empirical data collected over the years (linked here) shows a tendency of the markets to reverse during holidays.
The most famous reversal was September 3rd, 1929. That was the day after the Labor Day Weekend.
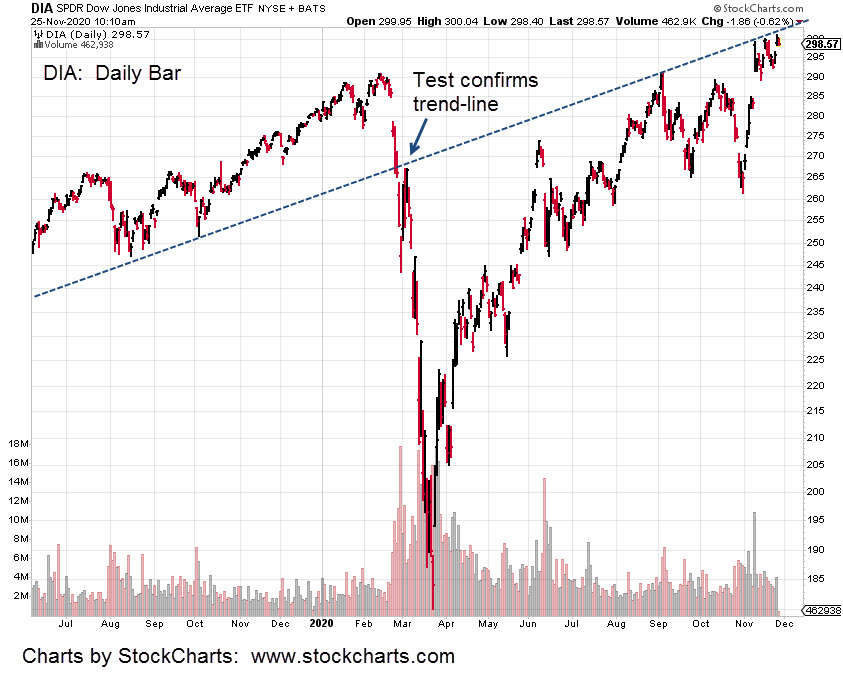
Yesterday, the Dow 30, made a new all time high. Looking at the chart (expandable version here), it’s in a very narrow range and hitting the underside of a long-term trend line.
This is a low risk area. A DXD (2X inverse fund) push past 13.22, could be considered an entry signal; stop at DXD 12.96 (not advice, not a recommendation).
There’s bound to be a lot of chop if and when this market reverses; the firm is leaving this one alone … for now.
Reversal chop was clearly seen on the GDX. It banged around for months before getting into position for a decisive move lower.
Trading inverse funds (for best profit) requires a steady, sustained directional move.
Those moves typically do not appear right at a reversal transition.
If this is it … if this week is the high and reversal for the S&P, Dow and NASDAQ, then it’s likely the market will chop and set up conditions before a sustained move lower.
Note: Posts on this site are for education purposes only. They provide one firm’s insight on the markets. Not investment advice. See additional disclaimer here.
In the past three days, bonds (TLT) penetrated support and stopped dead.
Anytime a market penetrates support or resistance and halts, it’s an indication that something’s up.
Either the market‘s absorbing transactions at that level to continue on, or it’s a reversal about to happen.
With all that’s known on the short position by the speculators as well as another Van Metre report, bank lending standards, probabilities point toward bond reversal.
The dollar is already reversing higher. Gold has been viciously slammed lower and the overall market’s hovering at all time highs.
The Dow edged lower at the last session. This session in the pre-market (9:01 a.m., EST) it’s lower again at -1.94 points or -0.66%.
If the Dow (DIA) gets below the 290- area, it’s below resistance and another move higher may be difficult indeed.
We’re short the sector via DXD (not advice, not a recommendation). A new daily low for DIA will allow our position’s stop to be moved to DXD 13.49.
Note: Posts on this site are for education purposes only. They provide one firm’s insight on the markets. Not investment advice. See additional disclaimer here.
Note: Posts on this site are for education purposes only. They provide one firm’s insight on the markets. Not investment advice. See additional disclaimer here.
Was that it?. Did we see the all time high in the markets, Monday?
The short answer of course, it’s not known.
The longer answer is, to go short the market at this point (Monday’s session) was a low risk entry; not advice, not a recommendation.
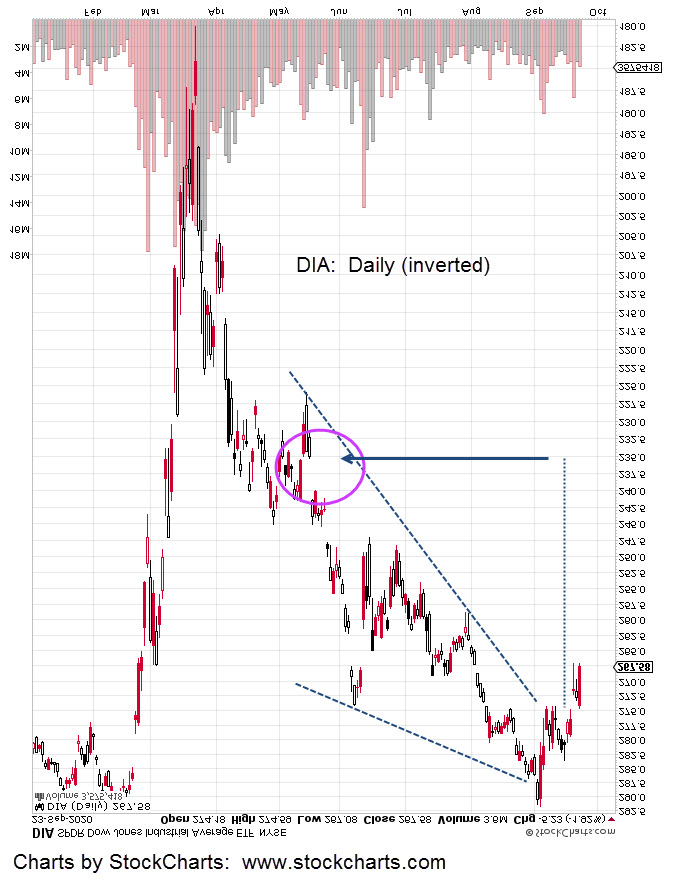
The inverse chart of the Dow, DXD (above) shows our initial entry. We’re green at the end of the day and have hard stop, GTC, at 13.32.
Tomorrow’s open could be a gap-lower for the Dow, that spends the rest of the session attempting to retrace higher. If so and depending on the behavior of that price action, it may provide an opportunity to add to the position.
Separately, the gold and related GDXJ, JDST had such sharp moves during Monday’s session that JDST was exited completely and yielded a gain of about 12%.
Gold is likely to retrace higher and possibly offer another low risk (short) position in the miners via JDST.
The trading actions are being directed by the market. It would be nice to have a slower more well behaved situation. However, that’s not the case and the trading response matches the market (price action) dictates.
Note: Posts on this site are for education purposes only. They provide one firm’s insight on the markets. Not investment advice. See additional disclaimer here.
Note: Posts on this site are for education purposes only. They provide one firm’s insight on the markets. Not investment advice. See additional disclaimer here.
Note: Posts on this site are for education purposes only. They provide one firm’s insight on the markets. Not investment advice. See additional disclaimer here.