Note: Posts on this site are for education purposes only. They provide one firm’s insight on the markets. Not investment advice. See additional disclaimer here.
Note: Posts on this site are for education purposes only. They provide one firm’s insight on the markets. Not investment advice. See additional disclaimer here.
Note: Posts on this site are for education purposes only. They provide one firm’s insight on the markets. Not investment advice. See additional disclaimer here.
The day the SOXX, closed higher but failed to print a new high.
It’s now early in the session (9:55 a.m., EST) and we have a new daily low.
There have been sell signals before but this one has a different ‘feel’ (not advice, not a recommendation).
Yesterday, bonds (TLT) gapped open lower and broke below support; rates are rising … again.
The 1987 Set-Up
Those old enough, remember the set-up. Rates up (bonds down) and market rising to all-time highs at the same time.
A chart of the ’87 crash is here. Note, the high was in August, that year.
Now, a video from Robert Prechter, about the current historic extremes.
‘Not since the South Sea Bubble of the 1700s’
Couple all of that with bonds (TLT) breaking down and we could have that ‘inflection point’, saying we’ve reached the top (not advice, not a recommendation).
The Mania Goes ‘Manic’
Going back to this post, it said to expect the AI proaganda to increase as we reach the top and reverse down.
If yesterday was that day, then we’ve got more articles coming about the downside being a ‘buying opportunity’.
It’s been the same throughout history
From a positioning standpoint and Wyckoff analysis perspective, under such conditions, one is to pick the weakest market to short and not the strongest (not advice, not a recommendation).
Junior Gold Miners, GDXJ, Bear Market
The last update showed how positions can be de-risked.
There’s always uncertainty but working long enough in the markets and eventually an understanding is formed on how the game is played.
Fake, fabricated or ‘serendipitous’ news articles getting the public on the wrong side, are just part of the game.
In the early session, the GDXJ, is continuing its move lower.
Note: Posts on this site are for education purposes only. They provide one firm’s insight on the markets. Not investment advice. See additional disclaimer here.
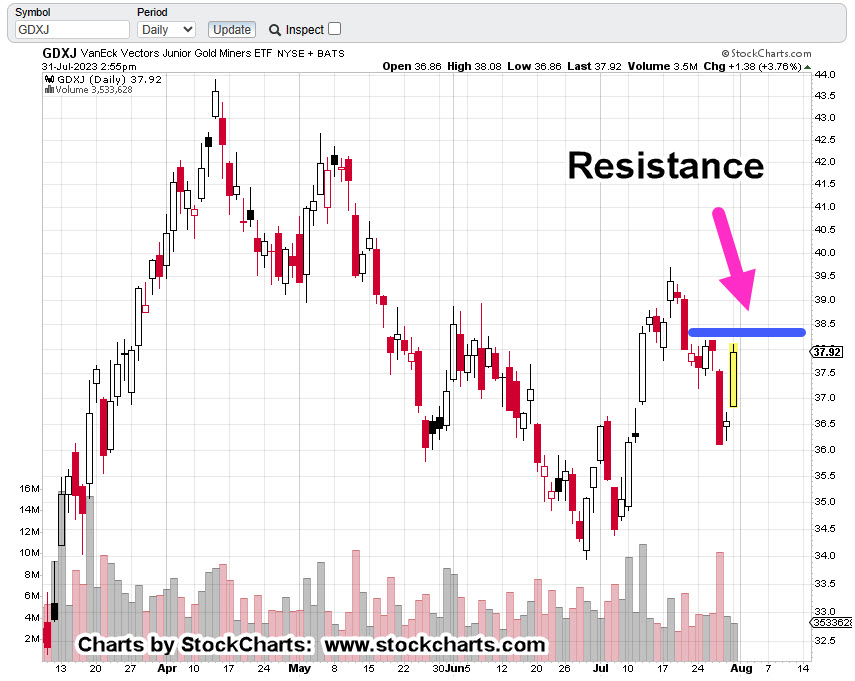
A military coup in Niger results in gold shipment suspension.
Correspondingly, the mining sector along with gold and silver, are higher.
The real question is, will gold, silver, and the miners continue upward or is this just an excuse to force out the weak (short-positioned) hands?
If we look at the facts, such as Niger’s gold output compared to the rest of the world, it’s miniscule; hardly a blip and production is decreasing.
Add in, the mining sector has not been in a bull market for years, and we’ll surmise, the current move higher has low probability of continuing (not advice, not a recommendation).
For today’s session (as of 3:11 p.m., EST), price action has effectively been slammed into resistance as shown.
Junior Gold Miners GDXJ, Daily
For positioning short (via JDST) this is potentially a low-risk area (not advice, not a recommendation).
There would need to be continued demand for a move higher past the resistance area (blue line).
Note: Posts on this site are for education purposes only. They provide one firm’s insight on the markets. Not investment advice. See additional disclaimer here.
From a strategic standpoint, this past Friday was the end of the Quarter and possibly the lowest risk spot to short the semis (not advice, not a recommendation).
‘Low risk’, does not mean, ‘no risk’.
We’ll look at the chart below for the SOXX, but first some housekeeping on the Junior Miners, GDXJ.
As stated in the last update, if there was more GDXJ, upside, shorts (via JDST) would be exited. That’s what happened with an overall gain of + 3.57%, on the series (beginning 6/16/23).
Now, on to the next circus … Artificial Intelligence; more specifically, NVDA and its cohort, the SOXX.
Where’s The Money?
With the quarter over, money managers have dutifully shown they’re like everyone else, ‘investing’ in AI.
That’s out of the way, so let’s move on to the specifics:
Referring back to the excellent investigation done by The Maverick, in his view, the $11 Billion, is “Fantasy”.
The tricky part from a chart standpoint, is to identify when or if that fantasy is going to be exposed.
Semiconductor SOXX, Weekly (Inverted)
We’ve taken the weekly chart of SOXX, and inverted it as if going long the leveraged inverse SOXS (not advice, not a recommendation).
Downside force dissipating with each major thrust.
Last week was an ‘inside week’; price action could not make a new weekly low.
Couple that with end of quarter, potential ‘window dressing’ and this past Friday, may have been the lowest risk point, for shorting via SOXS (not advice, not a recommendation).
Analysis … not Advice
This site cannot and will not give advice.
What it can do, is provide analysis and strategy so that you can make your own determination on the market.
With that said, the ‘heads-up’ for a top in the SOXX, was posted on June 17th, link here.
Since that time, the SOXX reversed down and has now come back to test.
Positioning
On Friday, the SOXX, was shorted by entering long the inverse fund SOXS, at 10.01.
Soft stop (trader discretion) for the position is the session low at 9.75, and hard stop (no excuses exit) at all-time low of 9.48 (not advice, not a recommendation).
The coming weeks may prove interesting. All eyes will be on that ‘$11-Billion’.
Note: Posts on this site are for education purposes only. They provide one firm’s insight on the markets. Not investment advice. See additional disclaimer here.
One has to wonder if the mainstream will ever acknowledge we’re in a deflation impulse.
The ‘inflation’ we’re seeing is (potentially) more associated with supply, product, and population destruction than any ‘money printing’ (not advice, not a recommendation).
As ‘Winston’ says at this link (time stamp (1:21:48),
‘People are allergic to the truth.’
The truth for the day, concerning the Junior Mining Index GDXJ, is that we’re testing the right-side trend line, the supply side.
Junior Miners GDXJ, Daily Candle
Today’s price action is technically a ‘Key reversal’.
As such, the typical response is continuation to the upside during the coming days and or weeks.
Key reversals are not perfect and at times, will fail.
The important session for GDXJ, is tomorrow, Friday.
Continued upside most likely results in exit of short positions (not advice, not a recommendation).
Note: Posts on this site are for education purposes only. They provide one firm’s insight on the markets. Not investment advice. See additional disclaimer here.
‘Real (market) opportunities are rare. When one is found, it must be used to its fullest extent’; Gerald M. Loeb, the late, and former Vice Chairman, of E.F. Hutton
What a refreshing quote that is, back in the day when we had ‘Chairmen.’.
So, are the Miners the Juniors GDXJ, that opportunity?
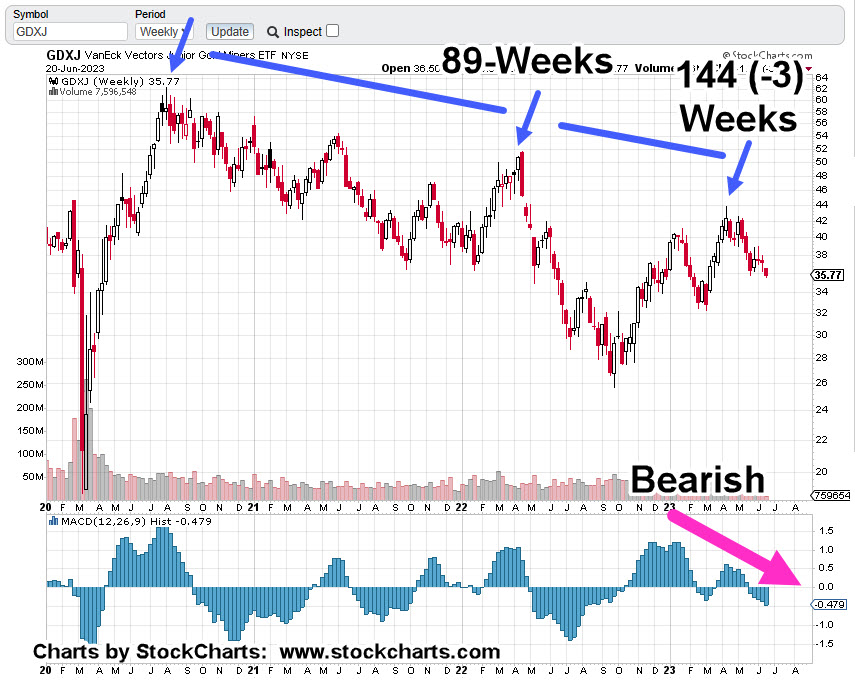
From a technical standpoint, there’s the bearish divergence on MACD when looking at the weekly. Then, we have Fibonacci correlation on the weekly as well (shown below).
The daily has the short entry signal given yesterday (not advice, not a recommendation).
Fundamentals Collapse
Next, we have industrial demand in collapse, not to mention the world economies. If industrial demand is collapsing for photovoltaic components (link here), then silver demand must be collapsing.
The ‘Gap’
The analysis was working fine in the pre-market for shorting the GDXJ (not advice, not a recommendation), but then at the open, there was the gap.
Let’s address that but first get started with the weekly chart of GDXJ
Junior Miners, GDXJ, Weekly
The technical details are clear: Bearish divergence on MACD as well as Fibonacci time correlation.
The original Fibonacci 89-weeks was covered in this post.
Yesterday, there was a gap-lower open and price action kept posting lower.
Will this gap be filled? That’s the question.
Junior Miners GDXJ, Daily
As the chart implies, was yesterday a breakaway gap?
Price action’s right at support … or slightly below, which technically put us in Wyckoff ‘spring’ position.
The ‘Probabilities’
Given the bearish overall condition of this sector both on a technical and fundamental basis, a gap-fill is unlikely … but one has to be prepared.
As stated in the last update, the short position via leveraged inverse JDST was increased (not advice, not a recommendation).
To account for possible gap closure on the inverse JDST, a soft stop (trader discretion) is at 6.80 and below, with an absolute hard stop (no excuses exit) at 6.38 (not advice, not a recommendation).
Note: Posts on this site are for education purposes only. They provide one firm’s insight on the markets. Not investment advice. See additional disclaimer here.
It’s rare to get a ‘textbook’ signal … but every now and then, it does happen.
The last update on the Junior Miners, GDXJ, said a short position in the sector was re-established.
Today’s trading action may be straightforward; we either get stopped-out, or the market gives the signal to enter a full (sized) position (not advice, not a recommendation).
The bearish case for the miners has already been established many times over. Recent posts are here, here, here and here.
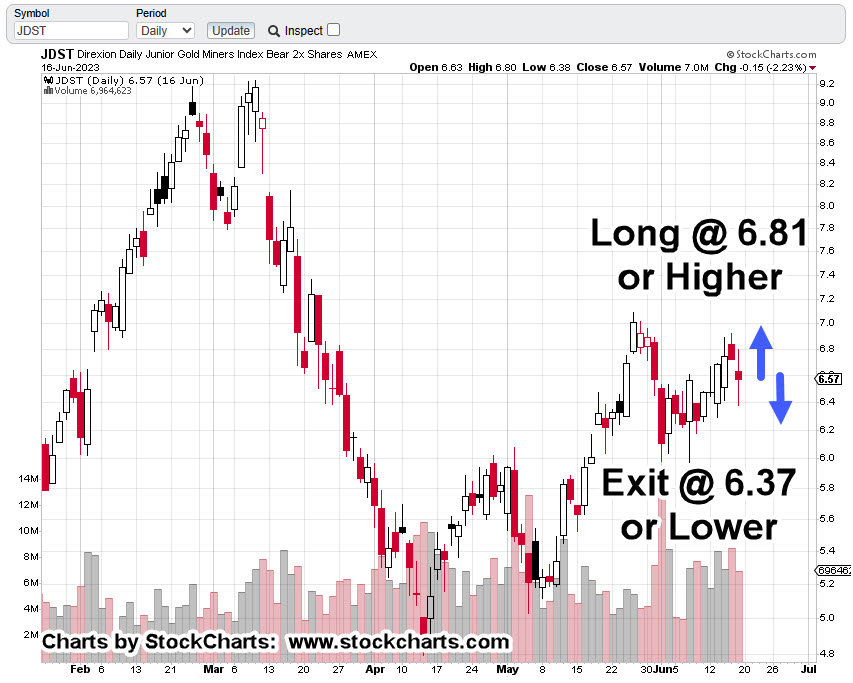
Since we’re looking at the sector from the short side, we’ll use the chart for the leveraged inverse fund JDST.
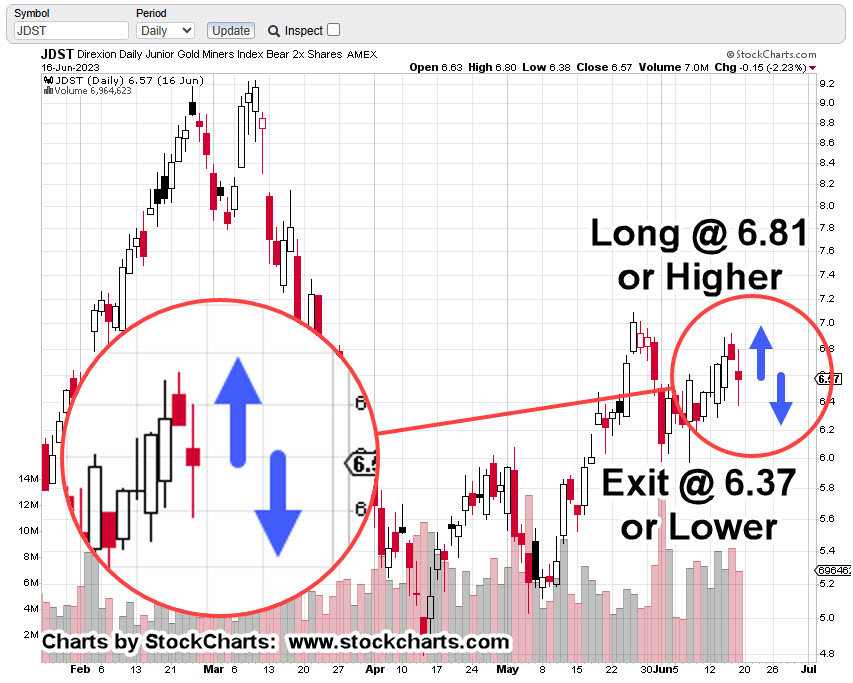
Junior Miners, Leveraged Inverse JDST, Daily
As said at the top, it’s (potentially) straightforward.
If JDST, price action exceeds 6.81, a full position will be entered with hard stop at this session’s low (determined at the close of the day).
If price action declines to 6.37, or lower, the existing (small) position is closed out.
Closer in, with a zoom of the price action.
As of this post (8:41 a.m., EST) JDST is trading in the pre-market slightly higher at, 6.65 which is + 0.08, or + 1.22%.
Note: Posts on this site are for education purposes only. They provide one firm’s insight on the markets. Not investment advice. See additional disclaimer here.
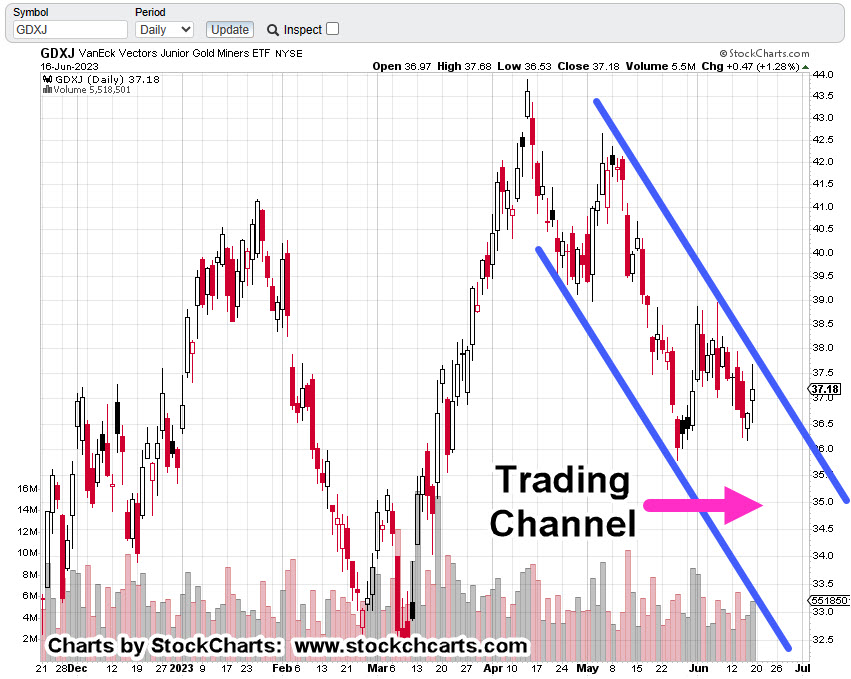
It’s time for an ‘adjustment’ to the trading channel identified in the prior update.
The Juniors GDXJ, are still in a downtrend.
Last Friday, they hit and retraced from the (adjusted) right side trading channel shown below.
The weekly MACD histogram (not shown) remains in a bearish divergence, indicating probabilities still favor the downside.
Price action will have to decisively break the downtrend to negate the bearish potential.
Junior Miners GDXJ, Daily Candle
From a trading perspective, existing short positions were closed out this past Friday and then re-established (partially) towards the end of the session (not advice, not a recommendation).
Dollar Death … Not Yet
Just like the A.I. propaganda, it’s popular to get hysterical about ‘de-dollarization’.
Two perspectives that are not part of the crowd are here and here.
They give a more sober look at what is really happening on a world-wide, dollar basis.
Note: Posts on this site are for education purposes only. They provide one firm’s insight on the markets. Not investment advice. See additional disclaimer here.