Key Reversal … Yet Again

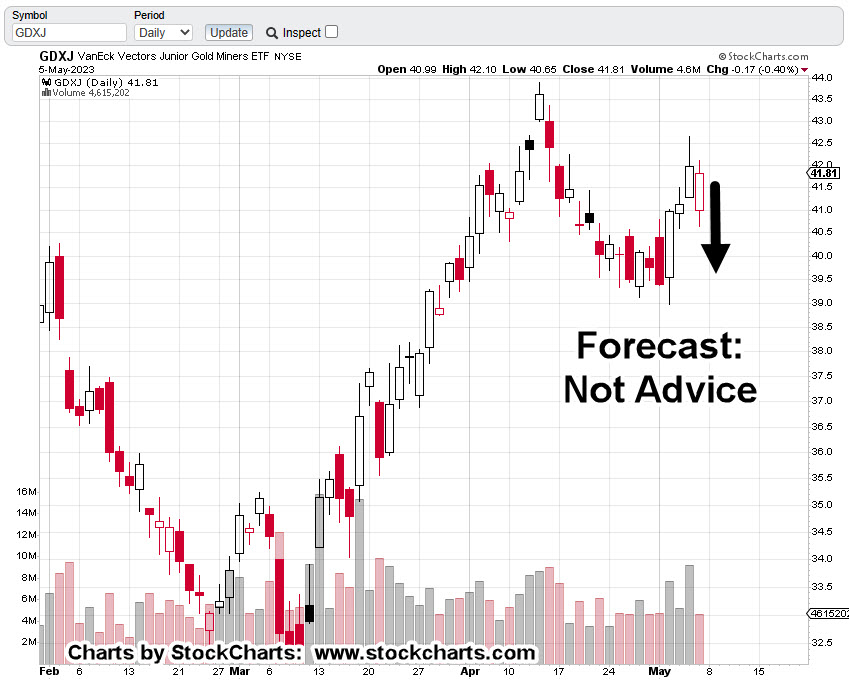
Junior Miners Take Another Hit

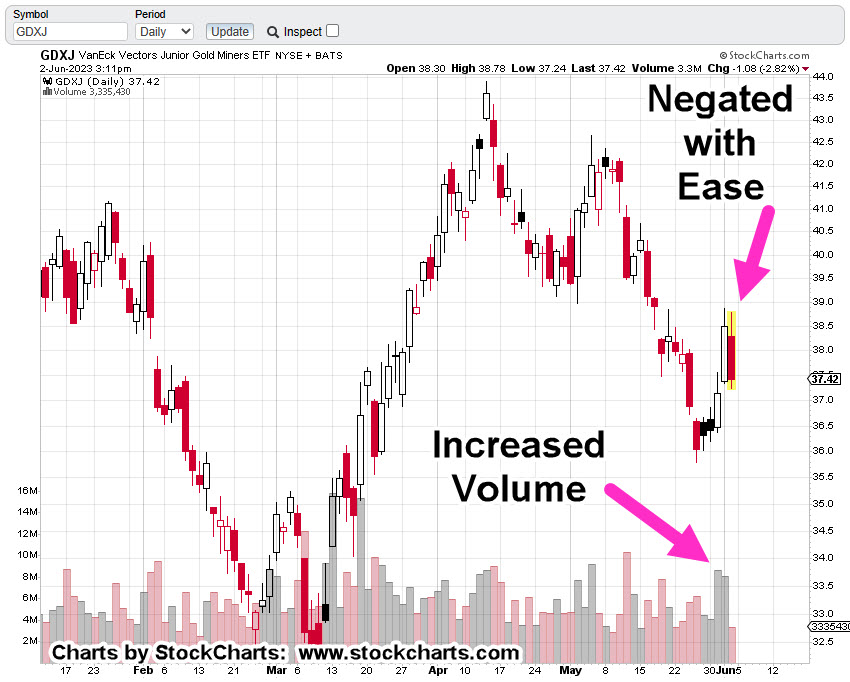
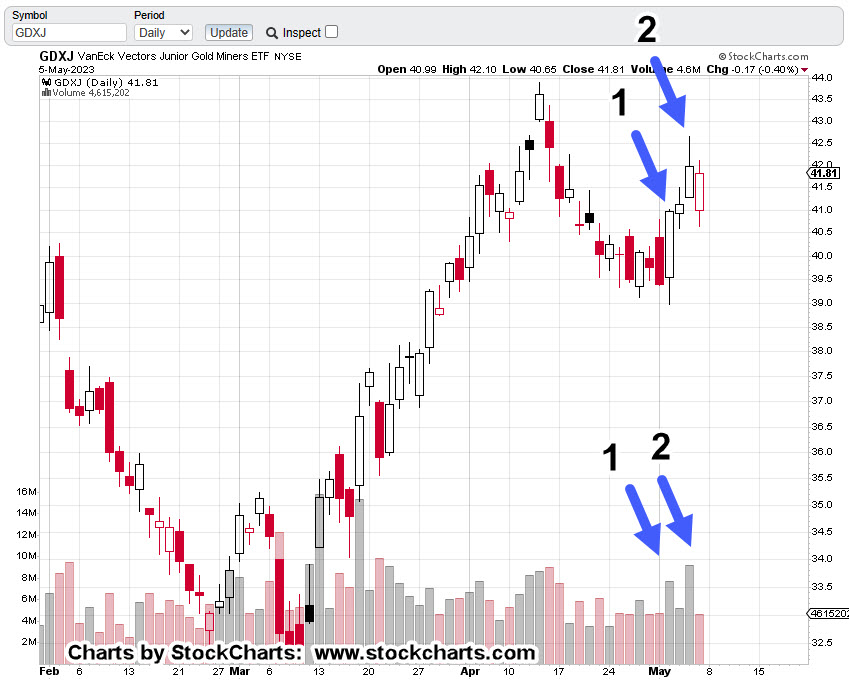
With today’s outside-down (as of 2:43 p.m., EST), that makes it two key reversals for GDXJ, in the past five trading days.

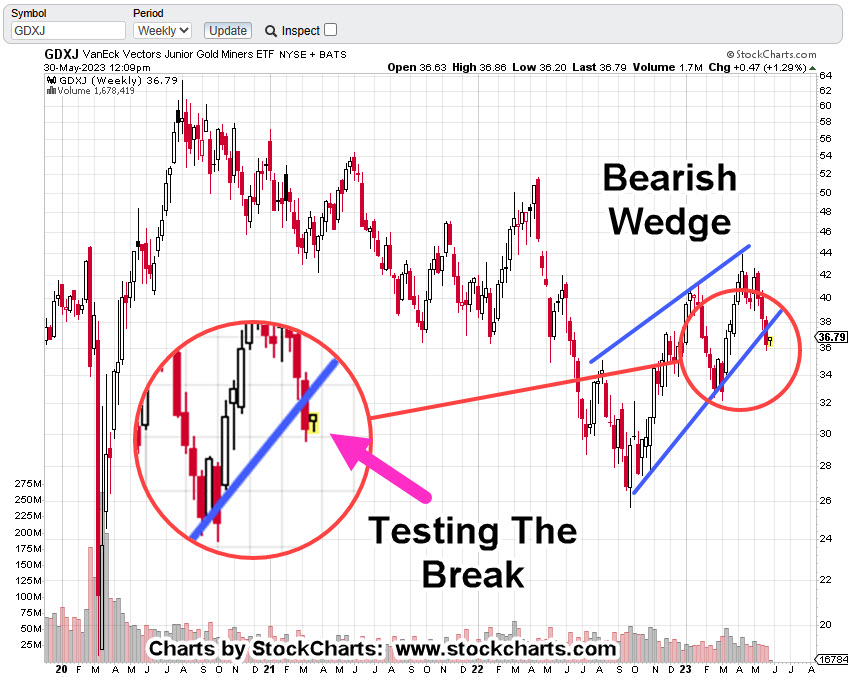
While it looks like the whole herd is focused on the new mania, Artificial Intelligence, back at the ranch, the miners are painting an ominous picture.

Rendezvous With Destiny

The first two-minutes and ten seconds, at this link, are all that’s needed to get the idea of what’s likely to come.

The market recovered (fairly quickly) from 1987 … this time, may indeed be different.

The Elephant Sleeps

Ah, yes. The elephant no one talks about … or more accurately, are afraid to talk about.

Three links here, here and here, show us the elephant may be about to awake.

Even Fox News admits, it was all a lie.

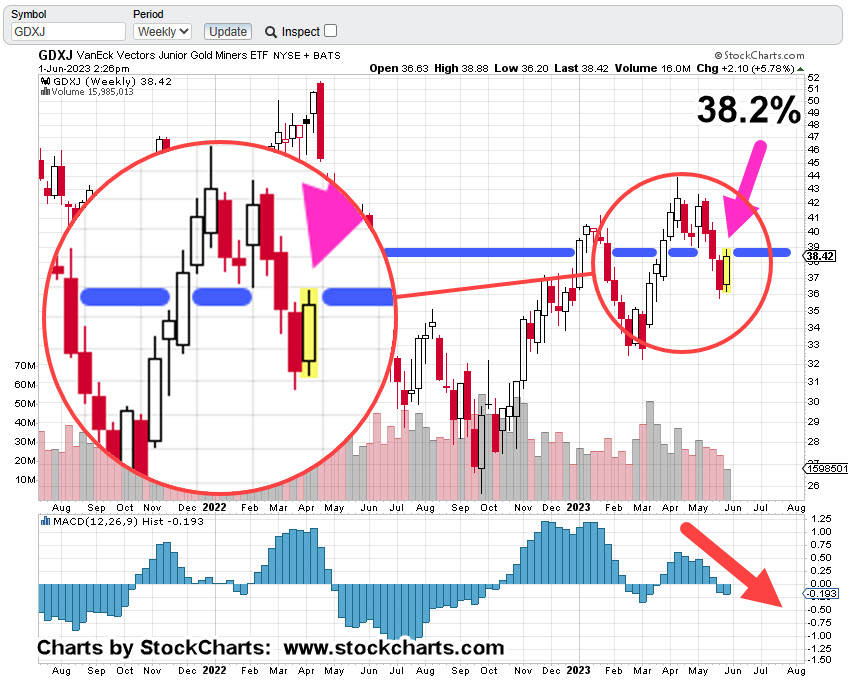
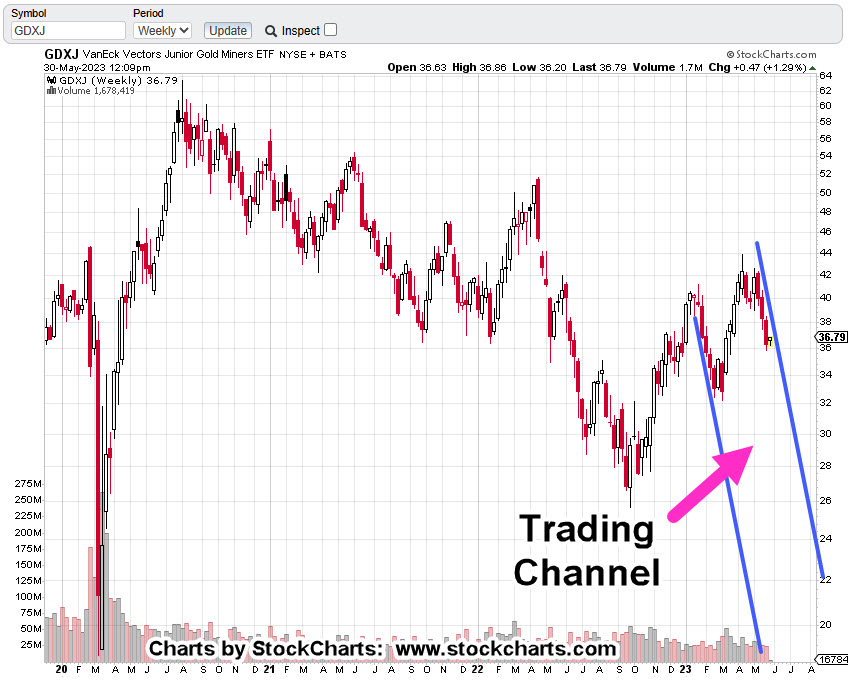
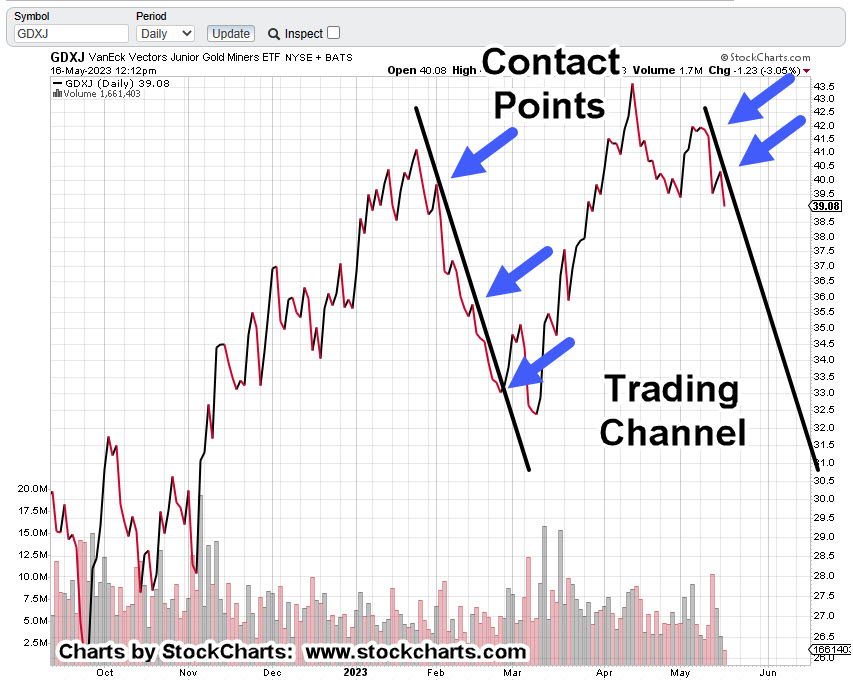
Junior Miners GDXJ, Trend & Channel

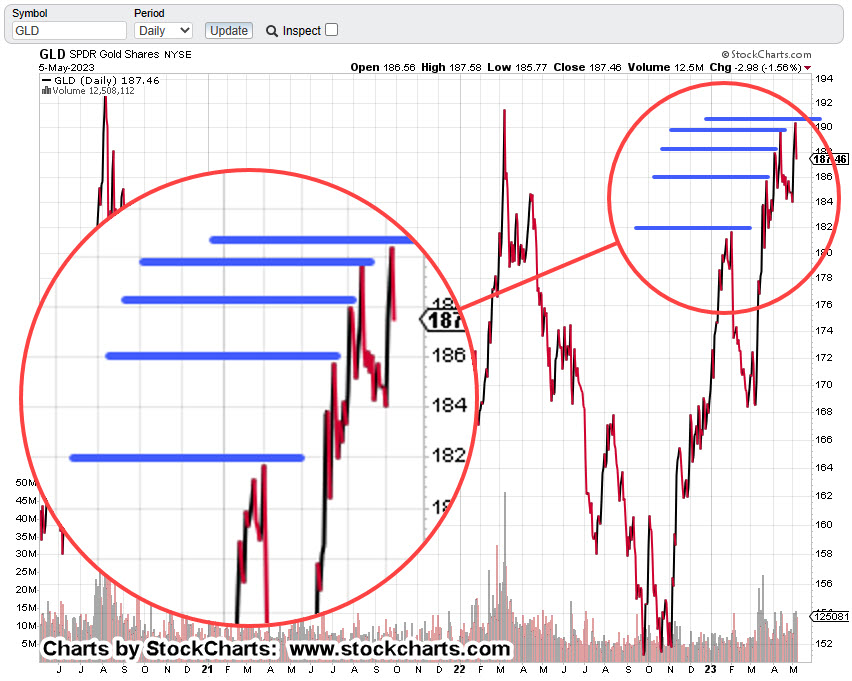
From the bottom, May 25th to now, is a Fibonacci 13-Days.

Is that important?

Here’s a prior analysis on Real Estate IYR, that shows how Fibonacci can identify the pivot point, trend and/or trading channel.

Now, back to the Juniors.

The mining sector appears to be under pressure. Each attempt to rally is being thwarted.

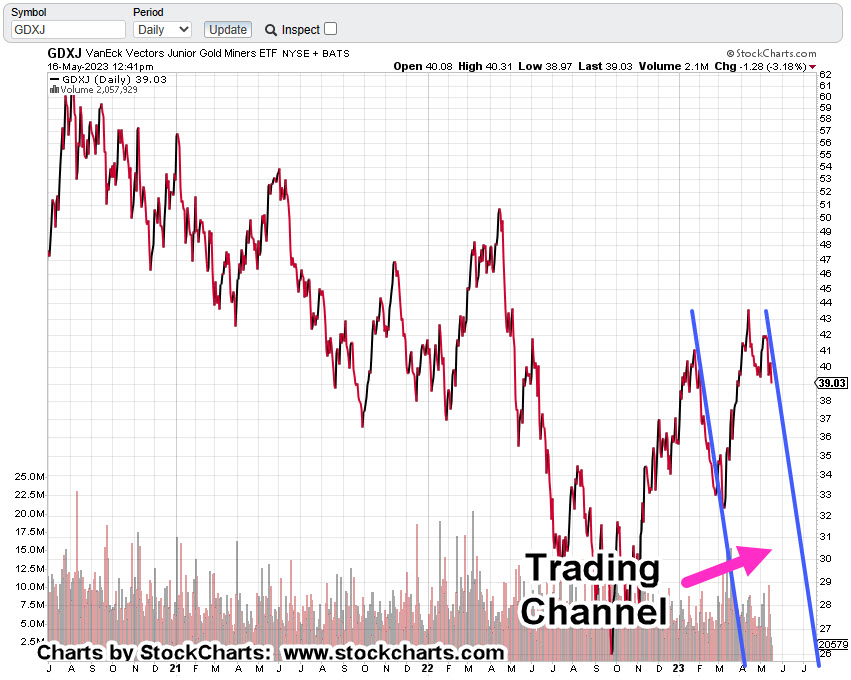
Compressed view of the channel, below.

The Fed announcement at 2:00 p.m., EST tomorrow, may or may not have any material effect. The sector may just continue lower …. slowly, without much fanfare (not advice, not a recommendation).

Stay Tuned

Charts by StockCharts

Note:  Posts on this site are for education purposes only.  They provide one firm’s insight on the markets.  Not investment advice.  See additional disclaimer here.

The Danger Point®, trade mark: No. 6,505,279

Gold Miners … Stealth Reversal

Narrow Open & Close Price Action

If you’re not looking for it … you’ll miss it.

Early in today’s session, the Junior Miners GDXJ, posted a new daily low and new weekly low. That helps the downside probabilities (not advice, not a recommendation).

As mentioned in the prior update, when price action penetrates existing lows, there’s a good chance of ‘spring’ action as a result. The market attempts to rally.

Sometimes it’s successful; other times, not.

The attempt to rally after posting new lows is what GDXJ is doing now (as of 2:15 p.m., EST).

Junior Gold Miners GDXJ, Weekly Bar

In the weekly chart below, note how the close, then open, then close and then open again, are to each other.

That ‘narrowness’ signifies either resistance or support, in this case, resistance.

Where the sector closes for the day may an important clue if we’ll continue to the downside.

Next update, the trend-lines.

Stay Tuned

Charts by StockCharts

Note:  Posts on this site are for education purposes only.  They provide one firm’s insight on the markets.  Not investment advice.  See additional disclaimer here.

The Danger Point®, trade mark: No. 6,505,279

Key Reversal … Gold Miners

New Daily Lows

We’re now about mid-way into the session.

The daily lows of the past four trading days have been penetrated: thus, defining today as a ‘key reversal’ or ‘outside-down’.

Spring Position

Ironically, since those lows have been penetrated, it sets up the GDXJ, in Wyckoff ‘Spring’ position.

There’s a possibility of some type of rising action as we get near the close … but don’t count on it (not advice, not a recommendation).

The weekly MACD, is in a bearish divergence (not shown) and it looks like the daily upside testing is complete.

This bearish set up may continue to develop into a significant downside move or just as easily, dissipate into randomness.

Junior Miners GDXJ, Daily Candle

If this turns out to be an important directional move, we’re still early (not advice, not a recommendation).

Following updates will present trendlines and support/resistance areas.

Stay Tuned

Charts by StockCharts

Note:  Posts on this site are for education purposes only.  They provide one firm’s insight on the markets.  Not investment advice.  See additional disclaimer here.

The Danger Point®, trade mark: No. 6,505,279

‘Bump & Run’ … Gold Miners

Upside Test Can’t Hold

With less than an hour into the session, Junior Miners (GDXJ), have tapped upper resistance, pushed past by just 0.07-points, and are now eroding to the downside.

If the index continues lower, it has the classic near textbook look of ‘bump and run’.

It’s a price action response to stops placed just above resistance that get executed and then the market continues lower.

If that’s the case, it could get very serious to the downside (not advice, not a recommendation)

Short positions via JDST, have been maintained with a hard stop at today’s JDST, low of 5.974 (not advice, not a recommendation).

Charts to follow.

Stay Tuned

Charts by StockCharts

Note:  Posts on this site are for education purposes only.  They provide one firm’s insight on the markets.  Not investment advice.  See additional disclaimer here.

The Danger Point®, trade mark: No. 6,505,279

Effort & Reward … Gold Miners

Lots of Volume … Little Progress

For the past two days Junior Miners GDXJ, launched higher on increased volume and then whacked itself right into resistance.

The daily chart shows the heavy up-volume, relatively wide price bars and then today’s decline (and new daily low) that took place with ease.

Wyckoff called this, ‘effort vs. reward’; lots of upward thrust (volume) that so far, can’t hold.

We’re about thirty minutes before the close and anything can happen; with that said, GDXJ is on track to close near the lows of the day.

Junior Miners GDXJ, Daily Candle

The ‘Inverse’ Clues

While the GDXJ, was declining with apparent ease, interesting things were happening with the leveraged inverse fund JDST.

That is, huge block trades were posted on the tape.

At least two blocks of 150,000 shares were observed scrolling on the tape within seconds of each other.

At the executed trade price, 150,000 shares represent a commitment of $972,000

Two of them is $1.94-million; a ‘modest’ position. 🙂

It should be noted that yesterday’s volume in JDST, was the second highest (edit … 4th, highest), ever.

In addition, those block trades mentioned above, took place in the middle of the day … highly unusual.

It all could be a ruse or for real. Either way, something big may be about to happen (not advice, not a recommendation).

Stay Tuned

Charts by StockCharts

Note:  Posts on this site are for education purposes only.  They provide one firm’s insight on the markets.  Not investment advice.  See additional disclaimer here.

The Danger Point®, trade mark: No. 6,505,279

Miners GDXJ, Tests 38% Retrace

Frustration Enough To Pull Your Hair Out

If it’s frustrating for the bears, it’s got to be frustrating for the bulls as well.

Pulling back and looking at GDXJ action without emotion, it’s clear we’re still in the ‘test’ (as we’ll see below) that’s been the topic of discussion over the past several updates.

The weekly chart of GDXJ, shows that even with today’s (as of 3:04 p.m., EST) retrace and test, we’re still in a negative divergence on the MACD (orange arrow).

Junior Miners GDXJ, Weekly

The horizontal blue line is not only an axis/resistance line, it’s also the Fibonacci 38.2% retrace of the GDXJ down move, April 13th, to May 25th.

We’re about an hour before the close and price action’s starting to erode from the highs.

If the downtrend is to continue, this may be a low-risk area for the shorts via JDST (not advice, not recommendation).

Stay Tuned

Charts by StockCharts

Note:  Posts on this site are for education purposes only.  They provide one firm’s insight on the markets.  Not investment advice.  See additional disclaimer here.

The Danger Point®, trade mark: No. 6,505,279

‘Mania’ or ‘Money’ … Your Choice

The Challenge Vs., The Money

The ‘Artificial Intelligence’ (AI) clown show’s in full swing with a ‘predicted‘ single quarter target of $11-Billion, from NVDA.

That’s not to be confused with the budget clown show just ended in Washinton D.C.

And where does that leave Tesla? They seem to be left out of the latest round of cult-like insanity.

Back in the day, Dr. Alexander Elder stated, professionals don’t look for the ‘challenge’ in the markets (trying to figure out the NVDA, top), they look for the ‘money’ … there’s a huge difference.

Junior Miners GDXJ, Weekly Candle

As of 12:35 p.m., EST, from a technical perspective, even though we’re up for the day (so far), MACD momentum’s increasing to the downside (magenta arrow).

Nobody seems to be paying attention to gold and silver; all eyes are focused on the next shiny object.

Pulling out a bit farther on the weekly, there’s no question we’re in a channel.

The question is, are we (GDXJ) going to say in that channel or reverse from here?

The last update said we’d likely be testing the wedge break and that’s what’s happening.

A ‘test’ will take however long is needed. It’s either pass or fail. Pass in this case is resumption to the downside.

Technical conditions (MACD, wedge break) favor the downside (not advice, not a recommendation).

In addition, we need to keep in mind there’s a new circus in town; the miners may be well on their way to more downside before anyone steps out of the big-top to notice.

Stay Tuned

Charts by StockCharts

Note:  Posts on this site are for education purposes only.  They provide one firm’s insight on the markets.  Not investment advice.  See additional disclaimer here.

The Danger Point®, trade mark: No. 6,505,279

Miner’s Reversal … Still Early

A Long Way To Go

If this is the ‘big one’ that everyone’s talking about, the miners have a long way to go to the downside (not advice, not a recommendation).

When there’s a viable, bearish (or bullish) divergence, then price action has the potential to go much farther and the move last much longer than anyone would expect.

Junior Miners GDXJ (as well as GDX), have posted a bearish MACD divergence on the weekly time frame … very significant.

That divergence is shown below:

Junior Miners GDXJ, Weekly Candle

Price action goes one way (i.e., up) while MACD goes the other … down.

Other posts have already covered details of the current set-up, now reversal, links here and here.

Not covered yet, is the apparent repeating trendline and potential trading channel.

That is shown on the daily close chart of GDXJ, below:

Junior Miners GDXJ, Daily Close

At the minimum, on the right side of the chart we have a down trendline. An upside break of this line would negate any short positions … (not advice, not a recommendation).

The compressed chart of GDXJ (below), shows the potential.

As of this post (12:57 p.m., EST) GDXJ, continues to move decisively lower. Gold (GLD) and silver (SLV) have reversed to the downside.

Gold’s reversal potential has been discussed previously here, and here.

No one expects a significant reversal in gold …. no one.

Stay Tuned

Charts by StockCharts

Note:  Posts on this site are for education purposes only.  They provide one firm’s insight on the markets.  Not investment advice.  See additional disclaimer here.

The Danger Point®, trade mark: No. 6,505,279

Hanging By A Thread … GDXJ

At The Next Open

If we’re at the downside pivot for gold and the miners, there’s only one right answer for the next market session.

That answer is:

Lower open, lower high, lower close.

Not advice, not a recommendation.

However, it is an assessment of where we are in the market cycle for gold and the miners.

The focus is on the Juniors GDXJ, as they are the weakest of both gold GLD, and the Seniors GDX.

If GDXJ, does not open lower, there’s something else happening; that would mean the downside reversal potential is in question and/or it could morph into more testing at the Axis Line, previously discussed.

Here’s a close-up of the sector.

Junior Miners GDXJ, Daily

Volume bar No. 1, corresponded with a solid up move for that session; shown as Price Bar No. 1.

Volume Bar No. 2, is where it gets interesting.

Specifically, higher volume, more narrow range (net distance) and a close well off the high.

Wyckoff called this: ‘effort vs. reward’.

Lots of effort (volume) with less reward (distance) than the previous move.

The next session confirmed that assessment by opening gap-down and then spending the entire day attempting to close higher … which did not happen.

That day (last Friday) may have been short covering. If so, we’re about to find out.

Junior Miners, GDXJ, Daily (forecast)

If we’re in a reversal (a big if), then we’ll get some variation of the price bar (black arrow) as shown (not advice, not a recommendation).

For the bearish option to remain intact, GDXJ needs to open lower and close lower for the day.

However, it does not need to post a new daily low, although that would help the case for more downside.

Anything other than what’s just described, would indicate a more complex price action environment.

If that happens, an update will be released.

Stay Tuned

Charts by StockCharts

Note:  Posts on this site are for education purposes only.  They provide one firm’s insight on the markets.  Not investment advice.  See additional disclaimer here.

The Danger Point®, trade mark: No. 6,505,279

Gold Bulls … Exhausted

The Volume Speaks

Nearly everyone expects gold to go higher; much higher.

You want ‘clicks’ on your website? Then talk about how gold’s going to the moon.

It’s an easy grift. Everybody’s doing it.

However, gold’s truth is in the price action, not the grift.

We’re going to look at that truth and more specifically, what gold’s (GLD) volume is telling us.

With full understanding that anything can happen, gold could go higher, there’s a case for a significant downside reversal (not advice, not a recommendation).

Gold GLD, Weekly

In Wyckoff analysis terms, volume is the energy behind the move. It’s the commitment … or lack thereof.

Last week’s volume is far below the prior spike high set during the ‘invasion’.

It’s down over 56% from the ‘invasion’ spike and down 26% from the most recent spike.

Demand, commitment and thrust energy, are backing away from the gold market.

Moving down to the daily, we see the net distance traveled with each significant thrust is shorter than the last.

Gold GLD, Daily Close

Wyckoff wrote about this observation a century ago when discussing how to spot the end (or absorption phase) of a move.

He called it ‘shortening of the thrust’.

So, there it is. The weekly chart shows each major volume spike is less than the last.

The daily close has net distance traveled less than the last.

Add in the mining sector’s GDXJ, posting its most recent peak four weeks ago (week ended April 10th).

Last week’s action in the Junior’s appeared to be an act of desperation by the bulls.

We’ll cover that sector in the next update.

Stay Tuned

Charts by StockCharts

Note:  Posts on this site are for education purposes only.  They provide one firm’s insight on the markets.  Not investment advice.  See additional disclaimer here.

The Danger Point®, trade mark: No. 6,505,279