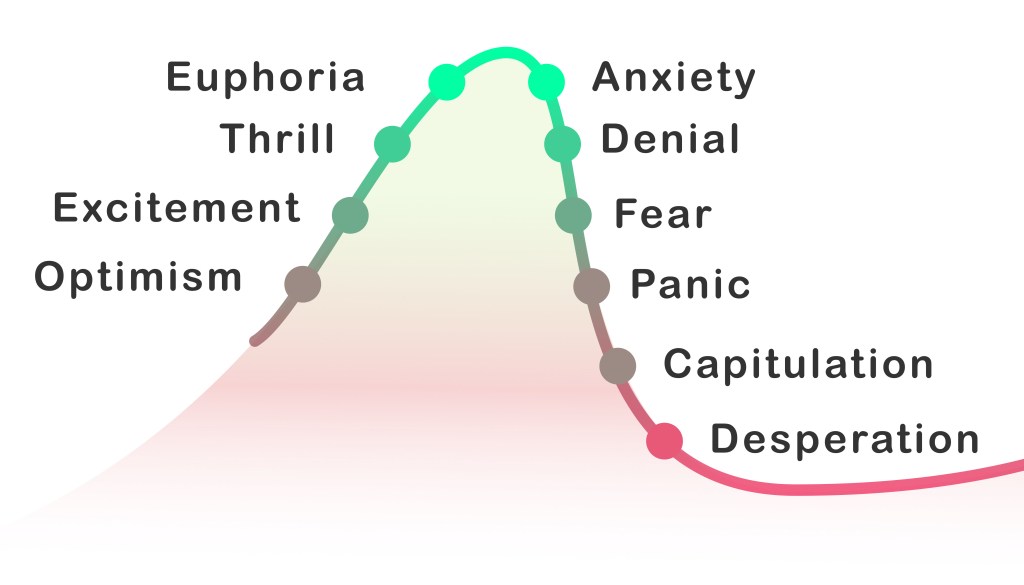
The Challenge Vs., The Money

The ‘Artificial Intelligence’ (AI) clown show’s in full swing with a ‘predicted‘ single quarter target of $11-Billion, from NVDA.
That’s not to be confused with the budget clown show just ended in Washinton D.C.
And where does that leave Tesla? They seem to be left out of the latest round of cult-like insanity.
Back in the day, Dr. Alexander Elder stated, professionals don’t look for the ‘challenge’ in the markets (trying to figure out the NVDA, top), they look for the ‘money’ … there’s a huge difference.
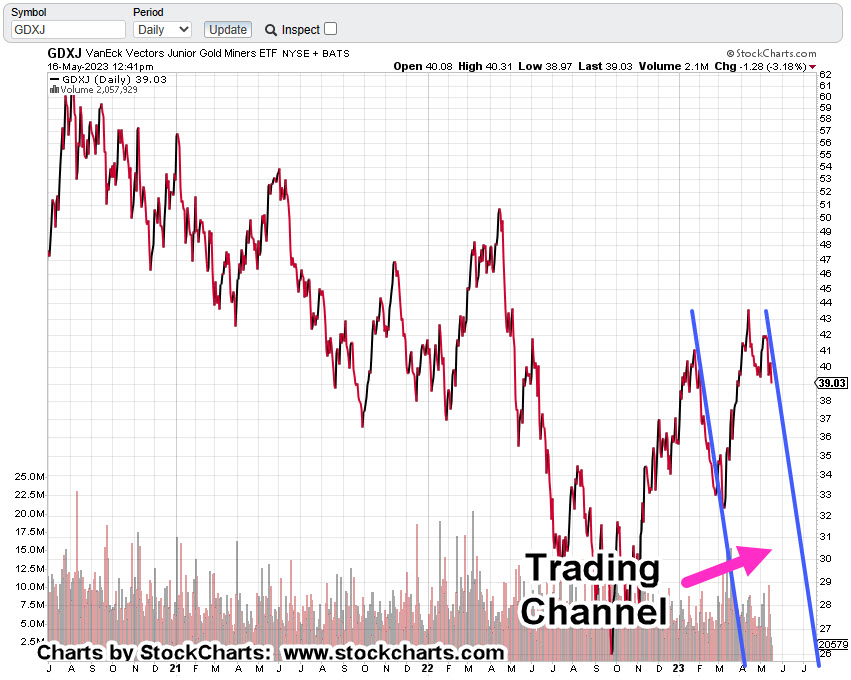
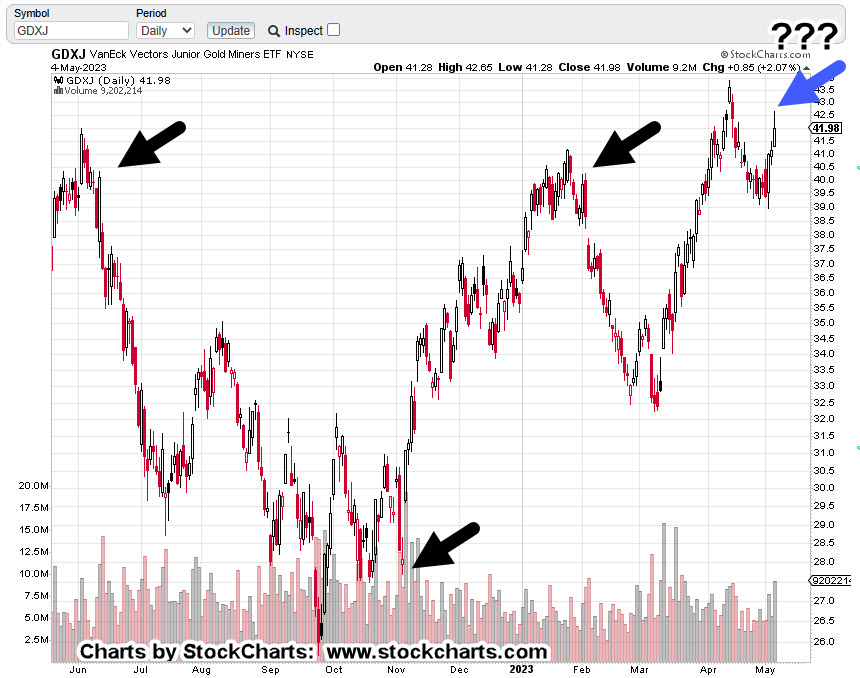
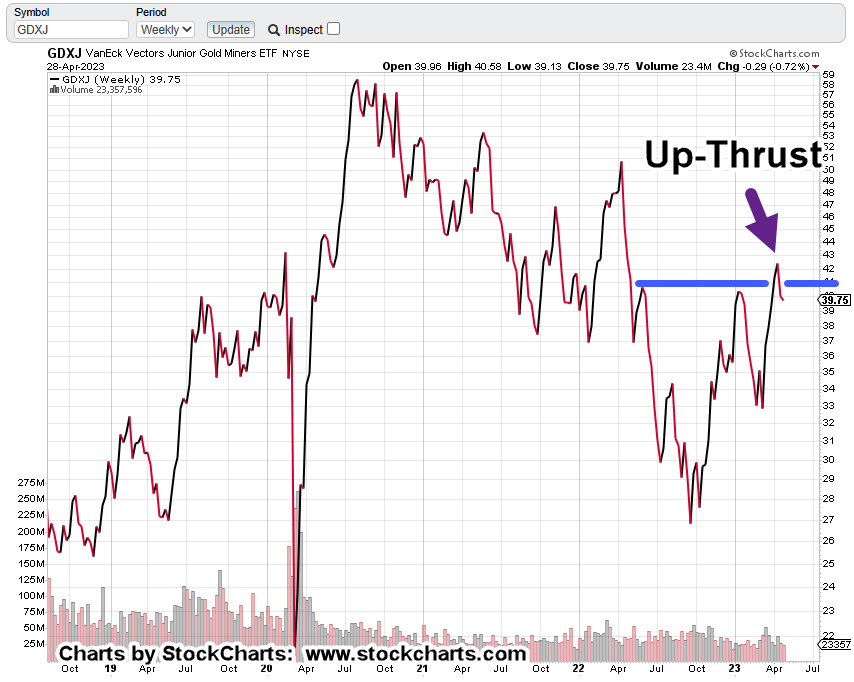
Junior Miners GDXJ, Weekly Candle
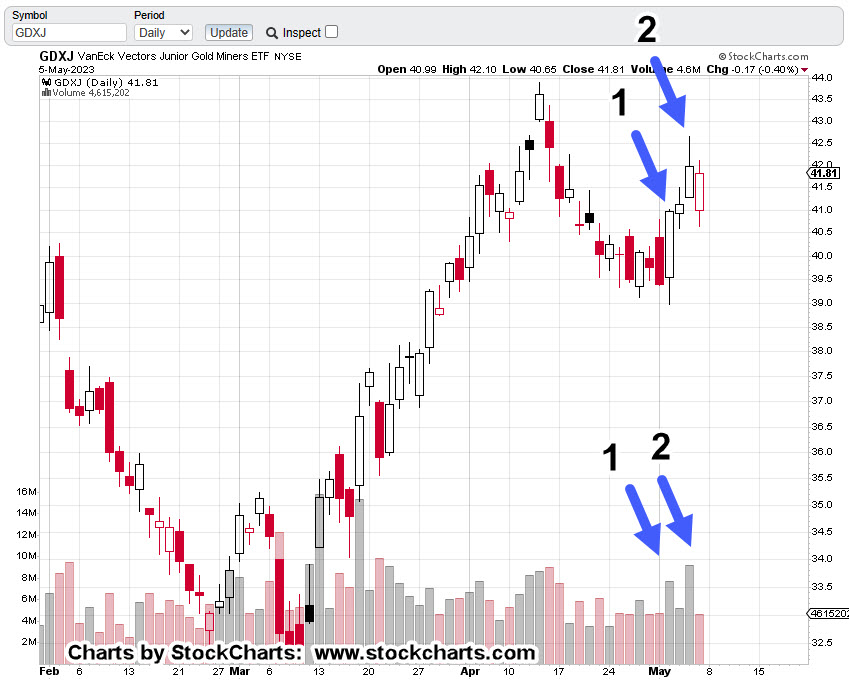
As of 12:35 p.m., EST, from a technical perspective, even though we’re up for the day (so far), MACD momentum’s increasing to the downside (magenta arrow).

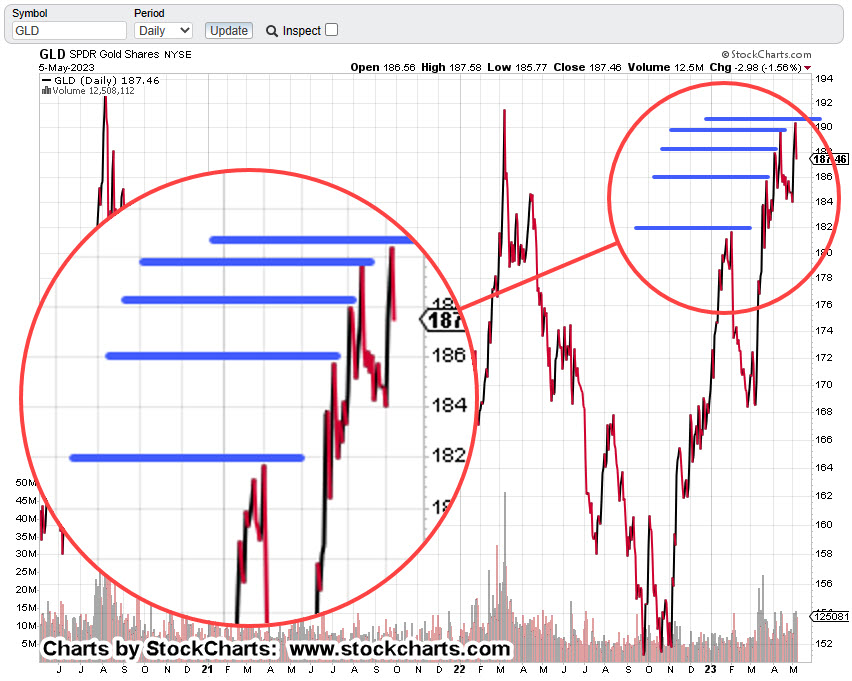
Nobody seems to be paying attention to gold and silver; all eyes are focused on the next shiny object.
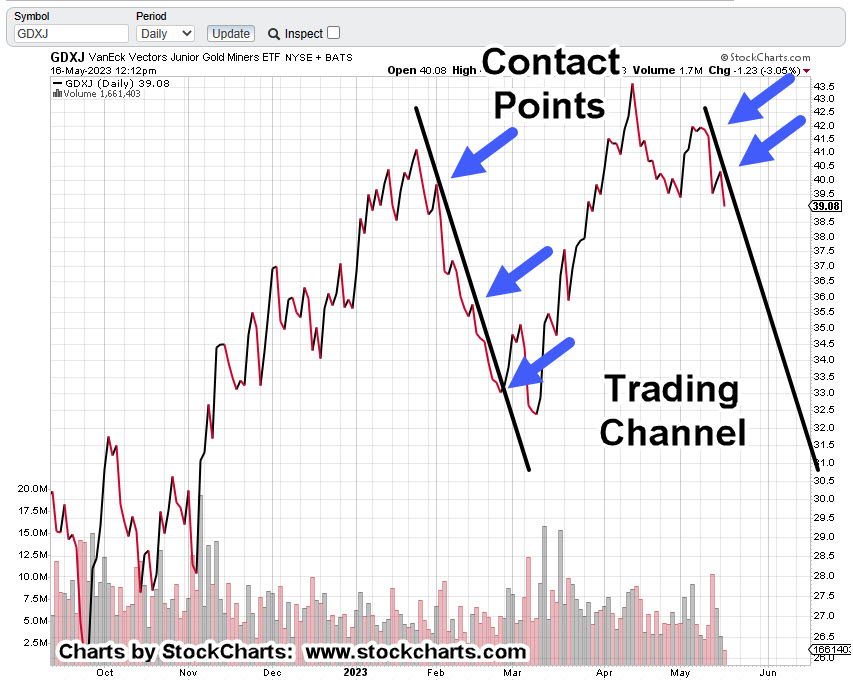
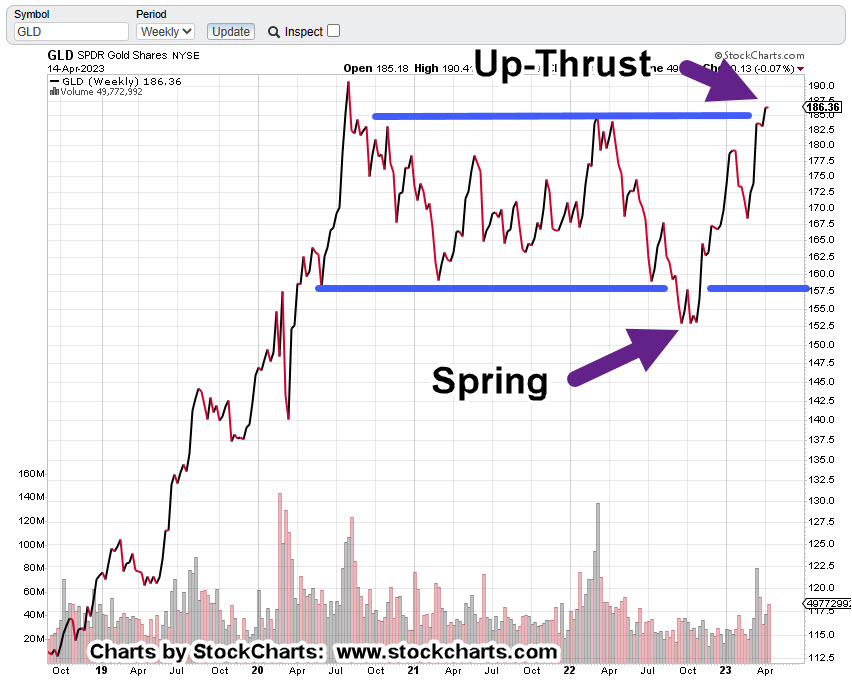
Pulling out a bit farther on the weekly, there’s no question we’re in a channel.
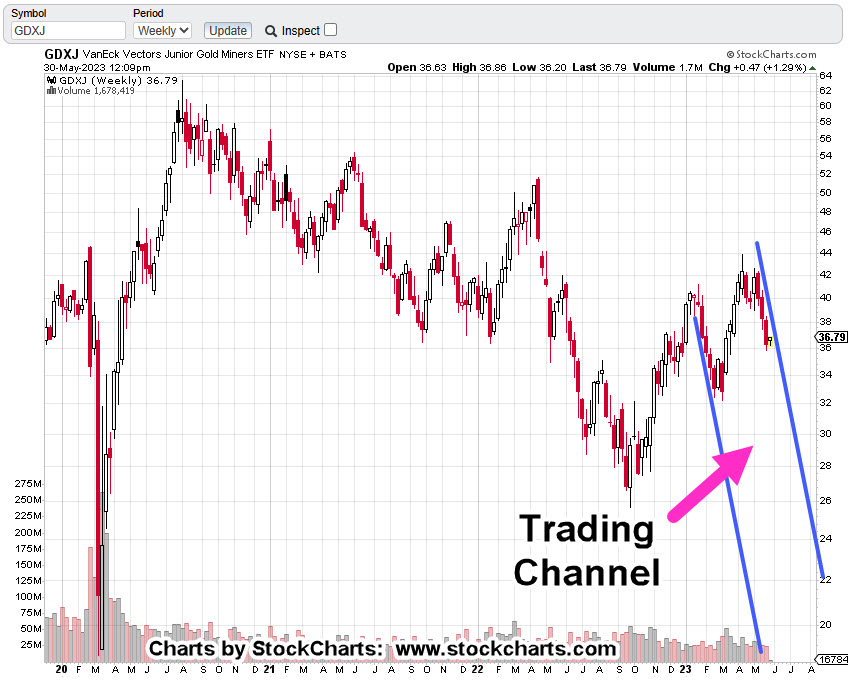
The question is, are we (GDXJ) going to say in that channel or reverse from here?
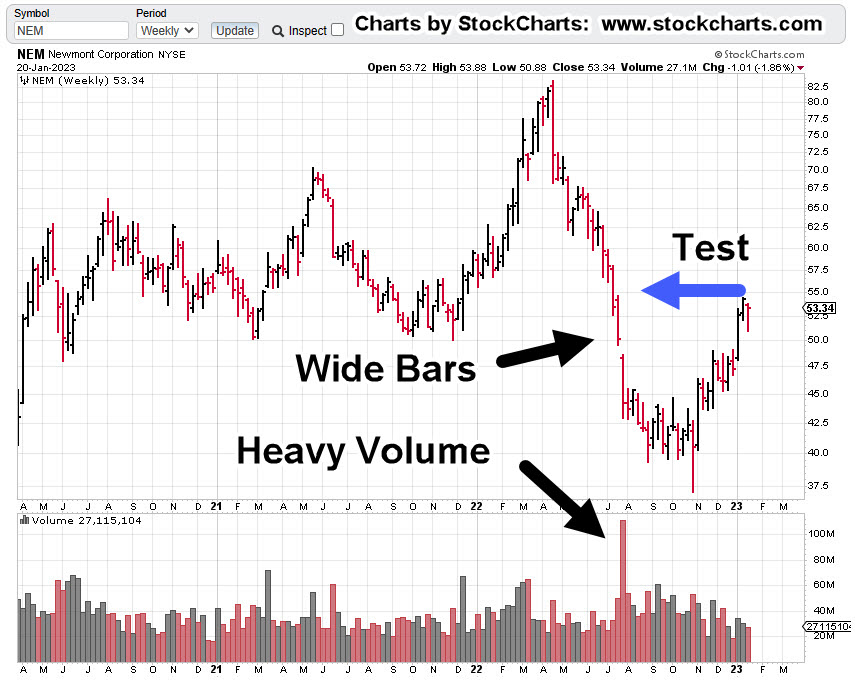
The last update said we’d likely be testing the wedge break and that’s what’s happening.
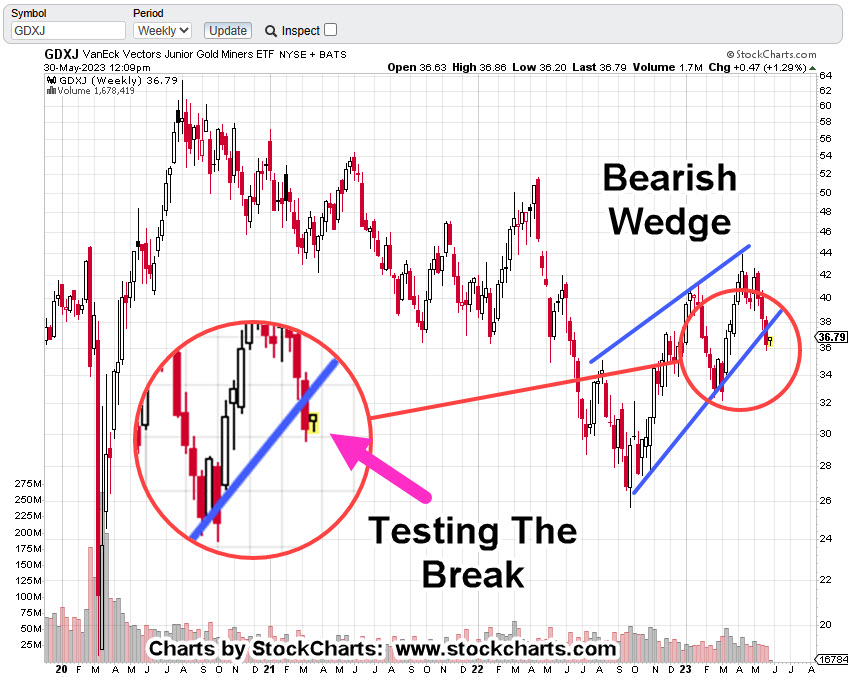
A ‘test’ will take however long is needed. It’s either pass or fail. Pass in this case is resumption to the downside.
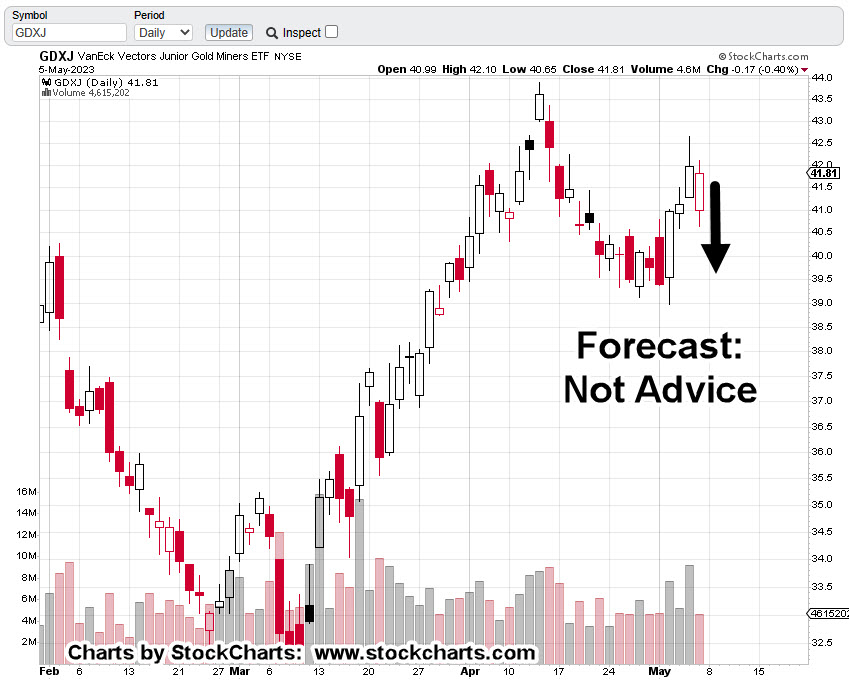
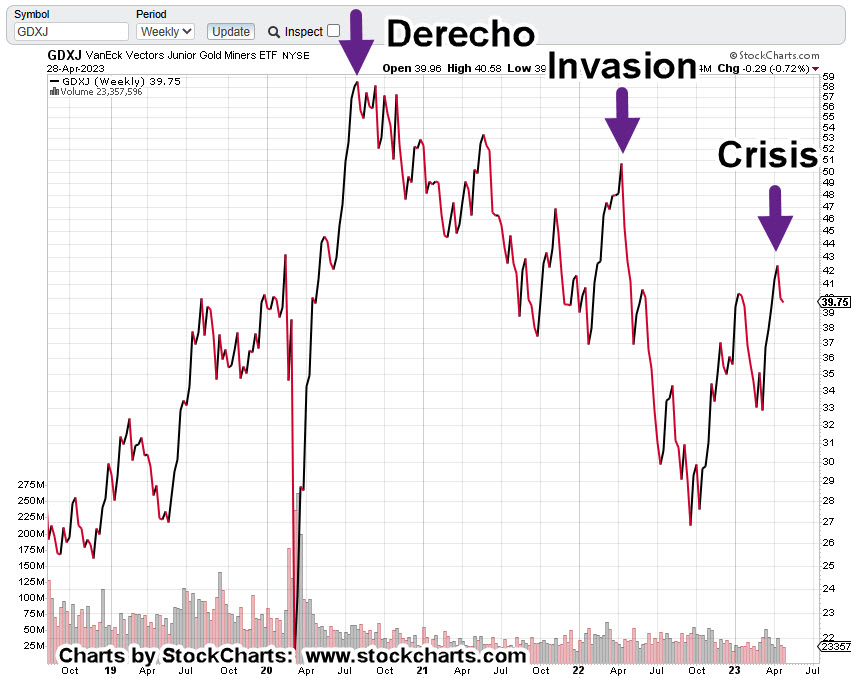
Technical conditions (MACD, wedge break) favor the downside (not advice, not a recommendation).
In addition, we need to keep in mind there’s a new circus in town; the miners may be well on their way to more downside before anyone steps out of the big-top to notice.
Stay Tuned
Charts by StockCharts
Note: Posts on this site are for education purposes only. They provide one firm’s insight on the markets. Not investment advice. See additional disclaimer here.
The Danger Point®, trade mark: No. 6,505,279