So, here we are nearly on the eve of the most significant reversal, ever:
September 3rd, 1929
That is, maybe, until now.
Today’s downside action may turn out to be just a blip; much ado about nothing.
Or it could be the harbinger of a top. Maybe the top (not advice, not a recommendation).
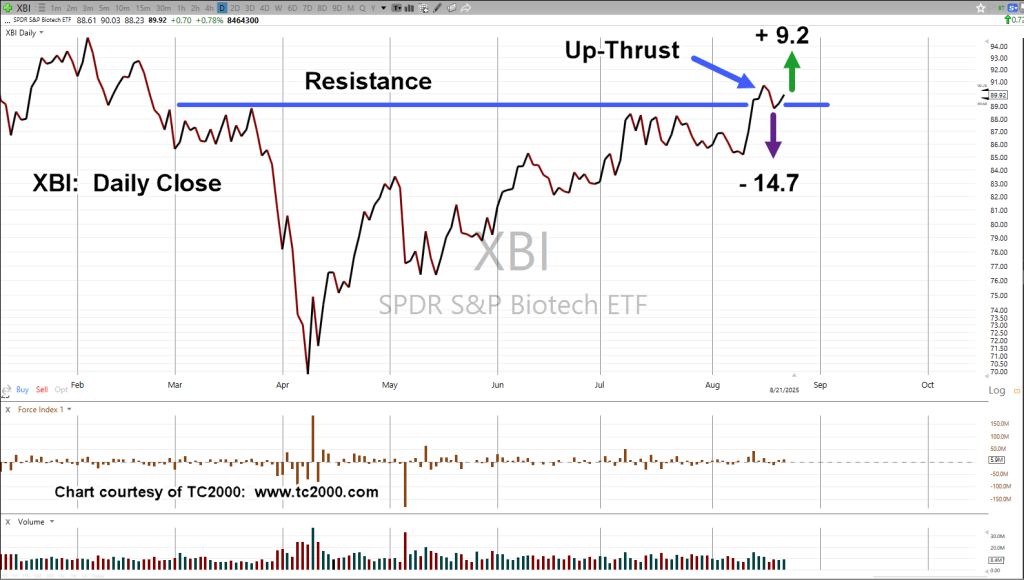
Biotech sector XBI, appears to be losing steam while at the same time, being in up-thrust (potential false breakout) condition.
As of this post (12:10 p.m., EST), XBI is down -0.63%, and has posted a new daily low. Short position XBI-25-03, remains active (not advice, not a recommendation).
We’ll discuss this index and others over the long weekend.
Note: Posts on this site are for education purposes only. They provide one firm’s insight on the markets. Not investment advice. See additional disclaimer here.
Each market session provides another data point, bull, bear, or congestion.
Yesterday’s position in XLF, was stopped out the same day with a minuscule loss.
That trade was an excellent example of operating at the market’s edge and maintaining discipline.
Another data point.
However, one market not making new highs, or threatening the current short position (yet), was biotech, XBI; short trade XBI-25-03.
So, let’s take a look at what’s really going on.
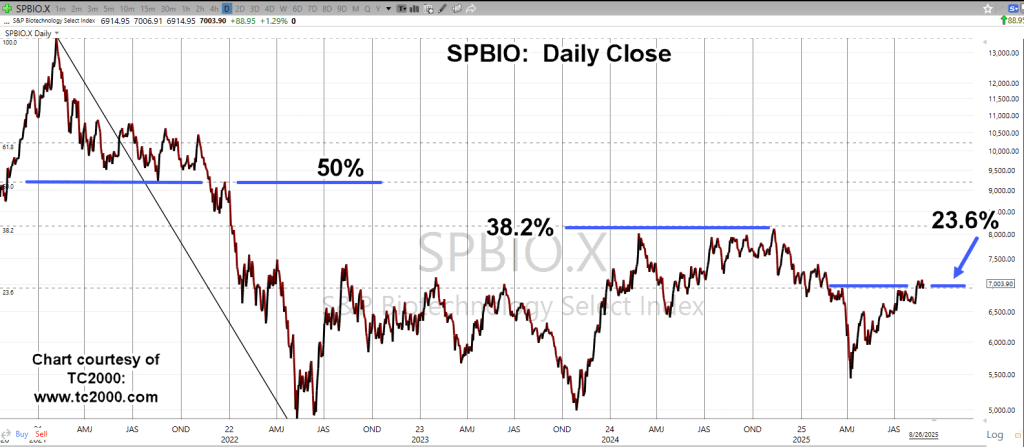
Biotech Sector SPBIO, Daily Close
We’re far away from all-time highs.
The Fibonacci retracements are shown.
At this point, we’re oscillating around the 23.6%, and in up-thrust condition.
The second chart zooms-in on the set-up.
Set-ups don’t guarantee anything.
They just mean the market has reached a point where risk could be at a minimum.
Bull or Bear
With the SPBIO (XBI as the proxy), we either have a breakout above resistance or an up-thrust as previously mentioned.
Until the market proves otherwise by making new daily highs, the condition continues to be traded as a potential (significant) downside reversal (not advice, not a recommendation).
Note: Posts on this site are for education purposes only. They provide one firm’s insight on the markets. Not investment advice. See additional disclaimer here.
The last update on Financial Sector, XLF, said it was in potential up-thrust (false breakout) condition.
Monday’s action was slightly down and today; we have a new daily low.
In addition, as we’ll see in the chart, all of this action is taking place below established resistance.
Financial Sector XLF, Daily
We’re at the ‘edge of the lake’, as David Weis used to call it. This is where the risk of being wrong is least.
Since the market’s posted a new daily low, risk on a short position is well defined, i.e. yesterday’s high (not advice, not a recommendation).
Currently short this sector as XLF-25-06, with stop in the vicinity of XLF 53.58. After the close of this session, the stop (if not exceeded) will be moved lower to the high of today’s session (not advice, not a recommendation).
Note: Posts on this site are for education purposes only. They provide one firm’s insight on the markets. Not investment advice. See additional disclaimer here.
Note: Posts on this site are for education purposes only. They provide one firm’s insight on the markets. Not investment advice. See additional disclaimer here.
Remember, markets typically move in the opposite direction first after the Fed, then resume their main trend.
On Friday, markets were generally higher on interest rate hopes. It’s called ‘hope’, as the Fed’s not actually done anything.
Let’s word that more accurately. The bond market has not (yet) told the Fed to lower rates. When it does (if it does), they will follow and present their case as if they are leading the market.
Decades ago, Robert Prechter Jr., in a research paper, proved this point. More recently, Ed Dowd repeats the fact, link here (time stamp: 37:48).
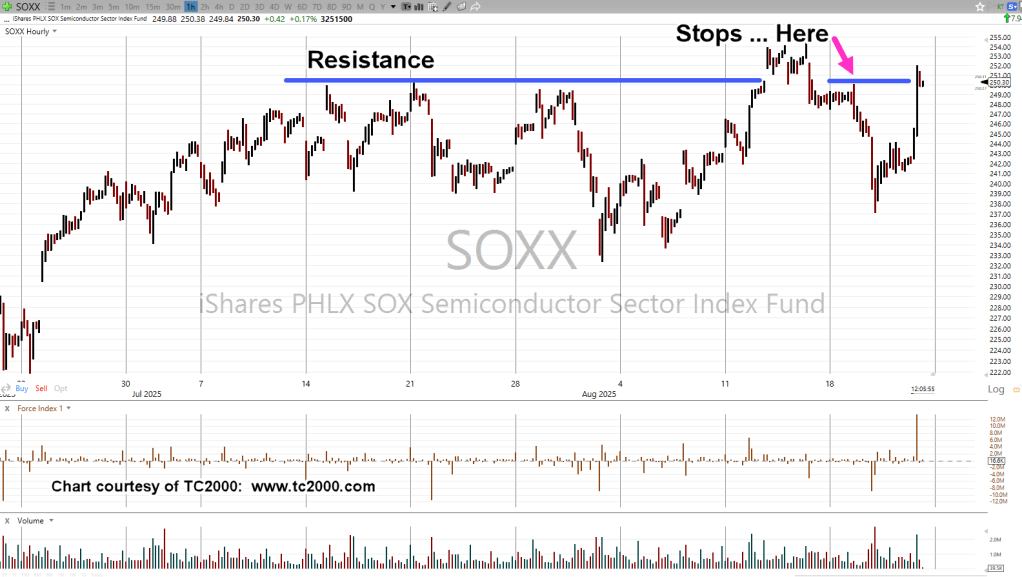
Markets were higher, including the SOXX, covered here, and in this update, airline sector Delta (DAL).
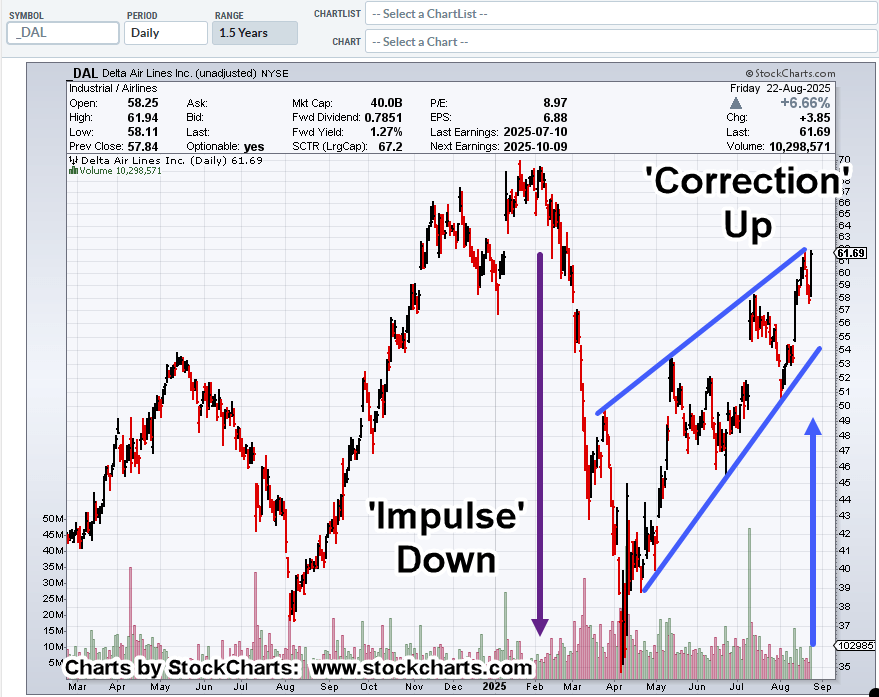
Delta Airlines, DAL, Daily
If there’s any one chart showing why this site primarily works the short side, this is it.
The last major move was an impulse downward, taking less than three-months.
The corrective move against the trend, has so far been nearly five months in choppy overlapping action.
DAL, finished on Friday at the Fibonacci 78.6%, retrace level (not shown). Unless the market decides otherwise, we’re in a terminating wedge.
Currently short DAL, as DAL-25-03, with stop just above Friday’s high (not advice, not a recommendation).
Weekend Wait
Now, the worrying starts … we can almost write the mainstream media script for the next few days.
Why will the Fed need to lower rates? Is unemployment going to continue higher? What about all the mass layoffs? How will the consumer be affected … and on and on.
As a reminder, ‘alternate’ (real) unemployment numbers are here. We’re already at 25%, Depression era levels.
Note: Posts on this site are for education purposes only. They provide one firm’s insight on the markets. Not investment advice. See additional disclaimer here.
Note: Posts on this site are for education purposes only. They provide one firm’s insight on the markets. Not investment advice. See additional disclaimer here.
Today’s higher action in XBI, closed the gap opened on the 19th.
Technically speaking, for short trade, XBI-25-02, the original stop has not been moved (still at the 8/18th, high).
The expectation from this site’s perspective, we’re in an up-thrust condition that may ultimately resolve itself downward (not advice, not a recommendation).
With that said, we’re about to find out.
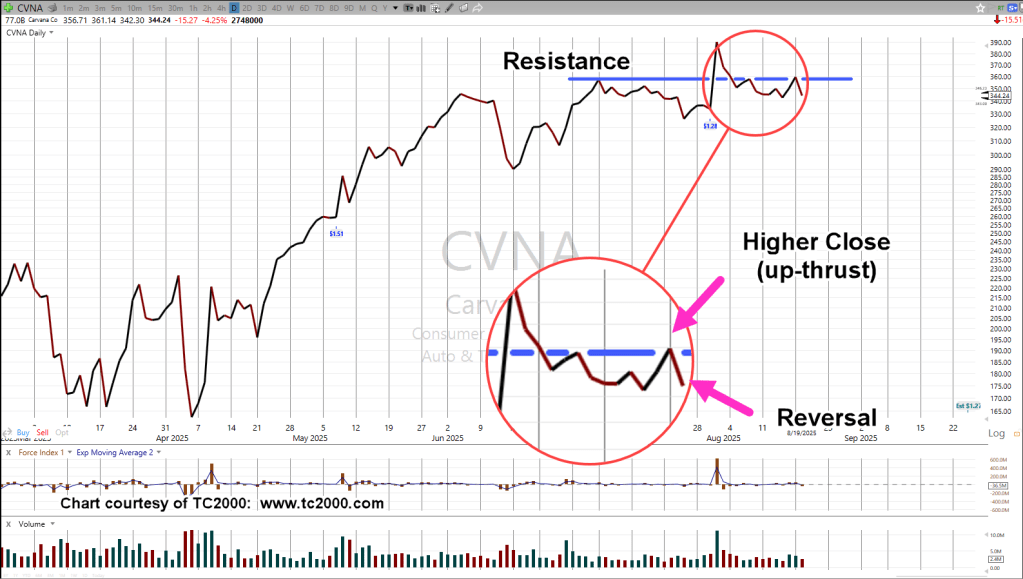
Bitoech XBI, Daily Close
At this juncture, downward thrust energy (Force Index) is larger than upward.
After hours, has the XBI, trading slightly higher.
So, we’re at The Danger Point®, where the risk of being wrong on a short position is least (not advice, not a recommendation).
Tomorrow is Fibonacci ‘Day 5’, from the August 18th, high. There could be a slight opening ‘pop’, then reversal.
If not, then time to exit (not advice, not a recommendiaotn).
Note: Posts on this site are for education purposes only. They provide one firm’s insight on the markets. Not investment advice. See additional disclaimer here.
Note: Posts on this site are for education purposes only. They provide one firm’s insight on the markets. Not investment advice. See additional disclaimer here.
Note: Posts on this site are for education purposes only. They provide one firm’s insight on the markets. Not investment advice. See additional disclaimer here.
Long or short, this is the spot where anything can happen.
Friday’s action in XBI, made it Fibonacci 89 Days, from the April 9th, lows.
Today printed higher, reversed (slightly), closing lower, making this Fibonacci Week 21 (-1) from the April lows.
Trading Coach … Livermore
Getting back to trading insights from Livermore (last update), he stresses the adage, ‘If it meets requirements, then execute’.
At this point that’s the case for biotech, XBI.
Biotech Short (again)
We’re in Up-Thrust position (above resistance) have met a Fibonacci count, then printed a reversal bar; the trading action is/was to go short (not advice, not a recommendation).
Trade: XBI-25-02, stop in the vicinity of today’s high (not advice, not are recommendation).
Note: Posts on this site are for education purposes only. They provide one firm’s insight on the markets. Not investment advice. See additional disclaimer here.