Putting aside the YouTube ‘silver to the moon’ hype, ‘dollar destruction’, and ‘economic collapse’ narratives, along with every other form of hysteria or mania du jour, we’re going to try something novel; like just looking at the chart of silver (SLV), itself.
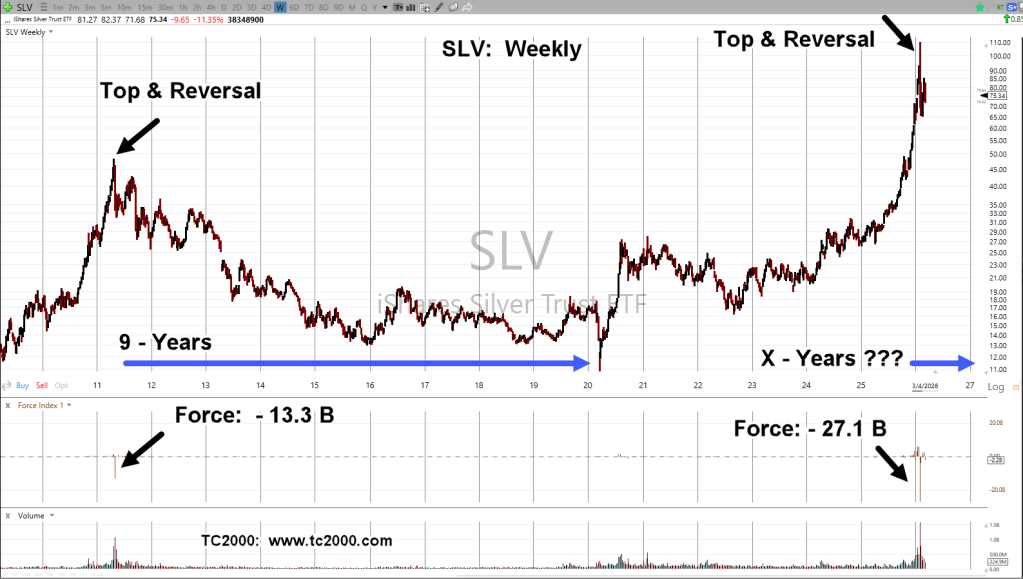
Silver Tracking ETF, SLV: Weekly
There it is.
The last top and reversal, kicked off a bear market lasting about nine-years.
This time around, downward thrust pressure (Force Index) is more than double that of the previous reversal (not advice, not a recommendation).
It’s interesting, we don’t hear any more stories about silver bullion being flown to the LME.
That’s because the last such flight was (reportedly) way back in October, link here.
Note: Posts on this site are for education purposes only. They provide one firm’s insight on the markets. Not investment advice. See additional disclaimer here.
Let’s go all the way back (nearly four years ago) to this post, and the following:
“Think of the irony. The ‘stackers’ (and maybe the rest of us), having to exchange actual money, gold and silver, for worthless fiat just so they/we can buy food to stay alive.”
Fast forward to now and this link, time stamp: 6:35.
How close is that to the post from way back when?
Strategy, First
The About section presents the priorities of this site.
Strategy, Tactics, Focus; with three market masters, that were masters of each.
The insight, years ago, was that we’re in a situation not unlike that of Genesis 41. It’s the food supply first, then gold and silver (not advice, not a recommendation).
With updates like this just out, it’s becoming clear, food is the focus (not advice, not a recommendation).
Silver Update
The last update on silver (SLV) was back in early October, link here.
Silver’s down over -16%, since then.
It’s even worse for the bulls, including the Rod Stweart reference:
Note: Posts on this site are for education purposes only. They provide one firm’s insight on the markets. Not investment advice. See additional disclaimer here.
Note: Posts on this site are for education purposes only. They provide one firm’s insight on the markets. Not investment advice. See additional disclaimer here.
There’s been something wrong with the precious metal’s, gold and silver, for years.
Gold and silver used to move essentially in tandem, over the long term; not anymore.
This link shows there’s a huge divergence in the correlation between the two metals. Gold has launched higher, while silver has lagged.
Right around June of 2020, the correlation began to break down. What else was going on (or being ‘rolled out’) around June of 2020?
Recall, silver’s primarily an industrial metal; affected much more (than gold) by manufacturing demand.
Strategy First
Shown by the market itself, direct correlation between silver and gold no longer applies (or has somehow changed into a new construct), silver’s not confirming the ‘inflation’ shtick, possibly influenced more by industrial demand.
Thus, we have the following.
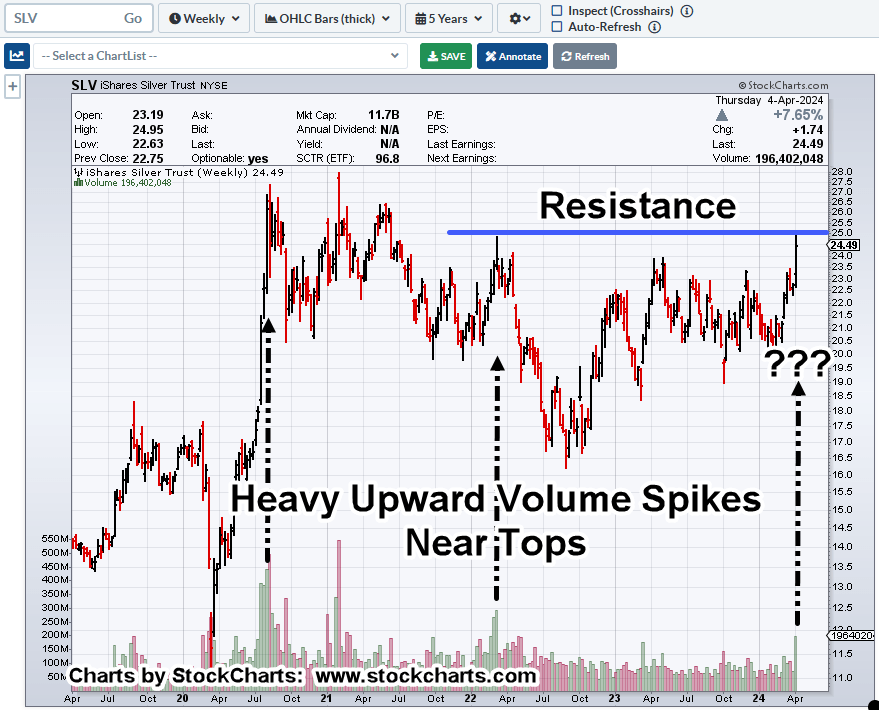
Silver SLV, Weekly
Just listening to what the market’s telling us, it says, when SLV, reaches a top and inflection point (to reverse lower), it tends to print heavy upside volume bar(s).
Looking at the chart, price action’s all over the place. Wide bars, volume spikes, the gamut.
Markets like this are unstable and usually can’t mount a sustained move in either direction.
Typically, if there’s going to be a breakout (or breakdown), price action tends to get tight, or get itself into a ‘coil’.
Even so, we need to account for the market itself.
Having traded silver futures contracts during the last run up and meltdown from 2011 – 2014, the silver market is thin and likes to ‘spike’.
That (spike) behavior is confirmed by Ed Seykota in Market Wizards and David Wies in his (formerly) daily market updates.
We may be at the beginning of a set-up for a Wyckoff up-thrust (above resistance) and then reversal.
A possible measured move for SLV (to be covered in another update), puts the tracking ETF, right around 25.60, about 2-pts. from where we are now (not advice, not a recommendation).
Note: Posts on this site are for education purposes only. They provide one firm’s insight on the markets. Not investment advice. See additional disclaimer here.
Warehouse vacancy space in California’s industrial sector is increasing and the consumer, may have finally spent themselves into oblivion.
Let’s throw on top, the food supply continues to contract just as forecast.
With all that, one can ask:
‘Just how’s silver going to enter into a bull market under these conditions?’
So far, since this post and this one, over two years ago, it hasn’t (not advice, not a recommendation).
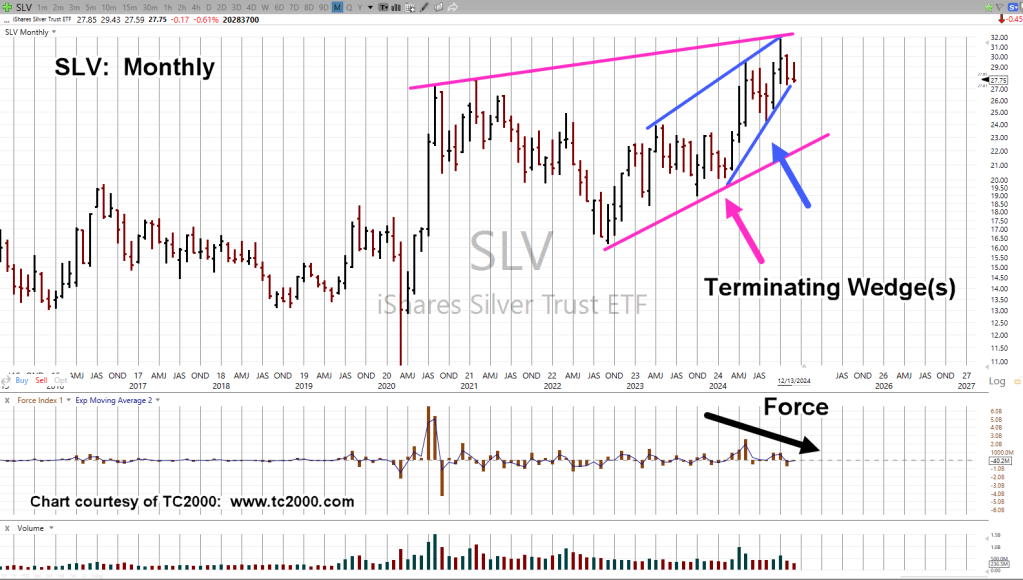
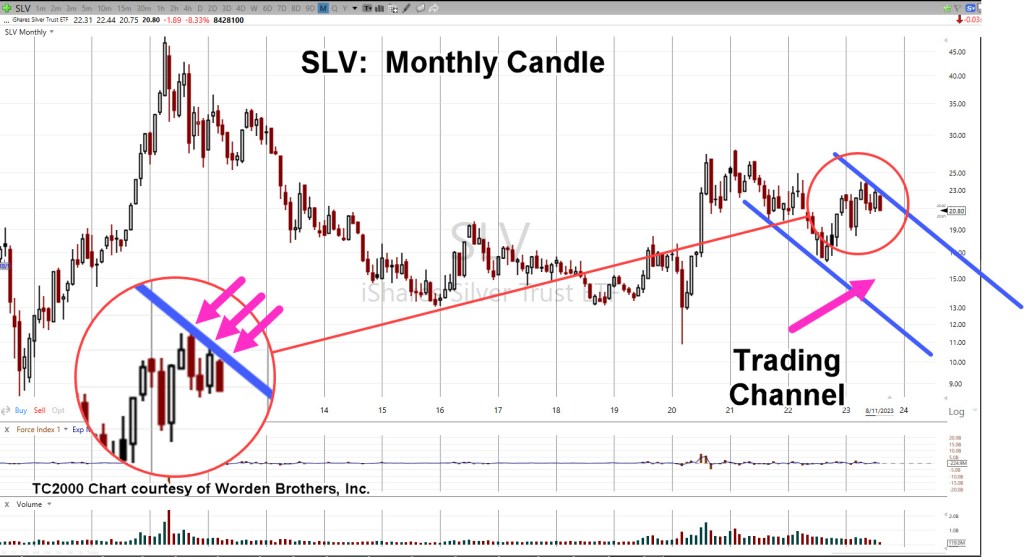
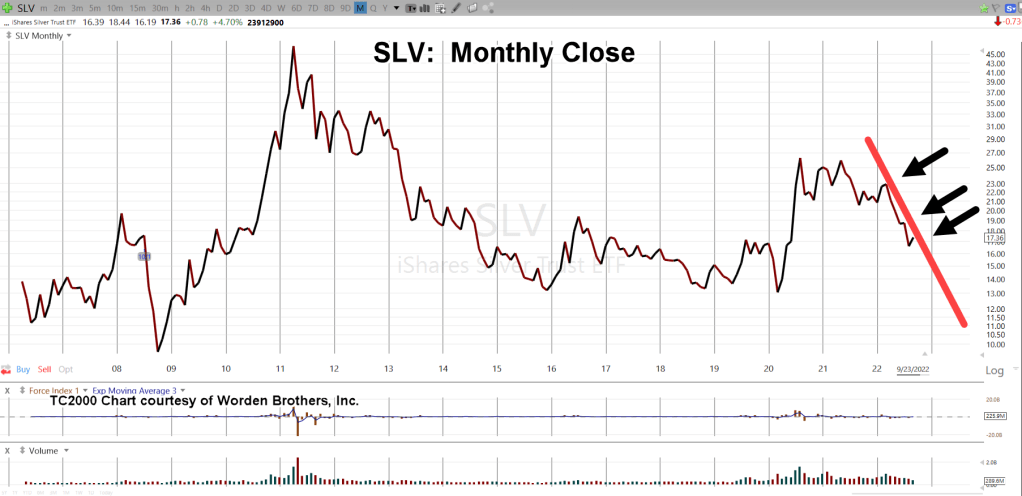
A New Down Channel
Silver continues its bear market that started way back in April, of 2011.
However, early-May and late-July peaks in SLV, appear to confirm the right side of a new down channel.
Silver SLV, Monthly Candle
With successive hits on the right side, trending down, there appears to be a significant barrier to moving higher.
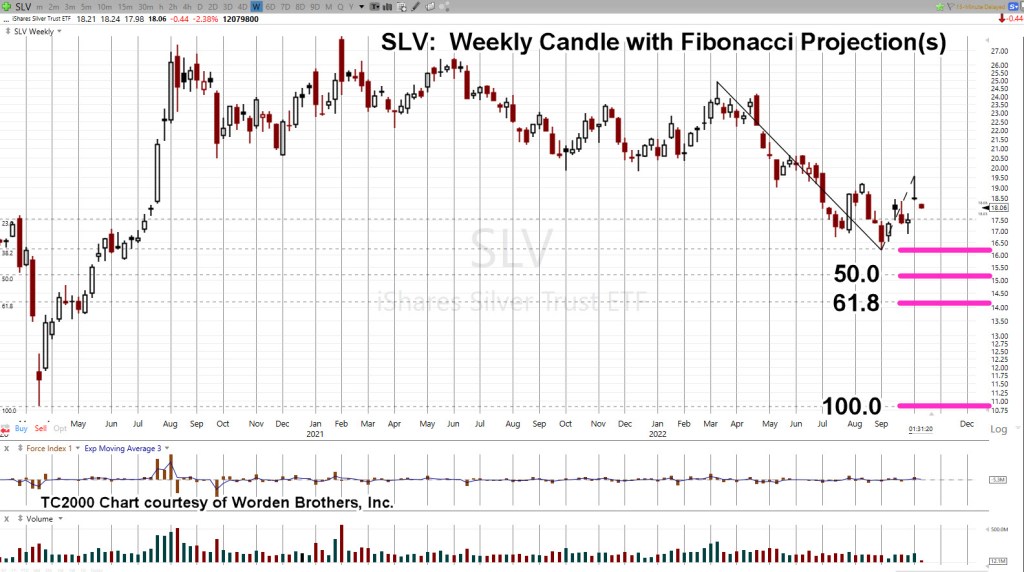
The next chart uses a standard Fibonacci projection tool, showing potential downside targets.
The critical area on the chart is the ‘23.6%’ projection to the SLV 19-area.
If price action retraces to this level and then starts to change character, it’s a possible bullish indication.
If not, and we push lower, SLV then continues on with its decade-long decline.
Sovereign Default … Waiting
There’s a lot of world-wide debt built up in the system.
China appears ready to collapse into a real estate depression … probably co-incident with our own.
Couple that with record level stock valuations, record margin borrowing and mass psychosis, not seen since at least South Sea Bubble of 1720.
Could it be, among many trigger-events, we get a sovereign debt crisis (assets dumped to pay debt) that send both gold and silver to much lower levels?
Note: Posts on this site are for education purposes only. They provide one firm’s insight on the markets. Not investment advice. See additional disclaimer here.
How is it possible to have silver stocks sold out here and here, yet silver bears have trapped the bulls.
As we’ll show below, this morning’s action in SLV, has confirmed the reversal; a Wyckoff up-thrust, pointing silver’s probability to lower levels.
For starters, let’s recap on how this (trading) game is played.
That is, the public i.e., the masses, need to be led to and fro so they are continuously on the wrong side of the trade.
That’s it.
So it is with precious metals and specifically silver.
The media came out recently, effectively telling everyone ‘Now is the time to buy gold’.
Where were these guys in 2001, when gold bottomed around $271/oz.
No, they show up at the end of the move … not the start.
Public Buys Hype, Not Facts
So the public has bought into the hype and run the silver coffers dry. Everyone excepts an immediate currency collapse and certainly anything can happen.
The original (bullish reversal) analysis is now supported by the facts; it’s been nearly two-years since that post and the dollar (UUP) is still headed higher.
So, let’s find out where silver is likely to go. For that, we go to the weekly chart.
It’s a repeating pattern found across the markets.
Price action gets itself into a spring condition by penetrating support which subsequently sets up the reversal; the up-thrust.
Next, we’ll use the Fibonacci Projection Tool, showing likely areas for downside destination.
A full 1 : 1 projection gets us right back to where we started the whole ‘short-squeeze’.
If SLV, gets back down to the 10.50 – 11.0, level, one can only imagine what type of hype will be in vogue.
However, at those levels, it’s reasonable to expect the local bullion dealer will be begging for sales … they might even offer their product at, or near, spot. 🙂
Note: Posts on this site are for education purposes only. They provide one firm’s insight on the markets. Not investment advice. See additional disclaimer here.
As with the Texas Freeze, the last thing on anybody’s mind was their “stack” of silver.
The humanitarian crisis is happening now, if not soon. Currency collapse may be months if not years away.
Which brings us to the precious metals and specifically silver, SLV.
The past few trading sessions have formed a repeating set-up: Spring-To-Up-Thrust.
Silver SLV, Daily
Note, the Pre-Market activity is far below yesterday’s high; the bulls may be trapped.
Typically the first order of business is an attempt to close the gap. If that happens, price action is then narrowing the risk on a short entry (not advice, not a recommendation).
One typical trading vehicle for shorting silver (other than the futures market) is 2X Inverse Fund ZSL.
Summary
The bulls think it’s finally the launch they have been waiting for … all these years.
It could be … anything can happen.
However, that does not take away from the fact we’ve got a trade set-up that may offer a low-risk short entry (not advice, not a recommendation).
Note: Posts on this site are for education purposes only. They provide one firm’s insight on the markets. Not investment advice. See additional disclaimer here.
Note: Posts on this site are for education purposes only. They provide one firm’s insight on the markets. Not investment advice. See additional disclaimer here.
No one expects the Spanish Inquisition like no one expects a collapse in silver.
From a contrarian standpoint, just because it’s not expected does not in itself, mean it’s going to happen.
However, this site’s been building a strategic premise for years, food supplies come first then precious metals (not advice, not a recommendation).
Here are links that span over two-years; successively building on the case, we’re (potentially) in a ‘Genesis 41‘ situation first more than a Wimar Republic event.
“As we continue on, it’s becoming clear that single-mindedly stockpiling inedible metal in hopes of surviving what’s here now, and what’s coming, is a major (if not potentially fatal) blunder”.
Being on the right side of the trade means by definition (nearly) everyone else, is on the wrong side.
The last report said that both silver and gold are at The Danger Point®; The location where risk is least for positioning either long or short (not advice not a recommendation).
Based on prior analysis, the expectation is for a continued decline in the precious metals.
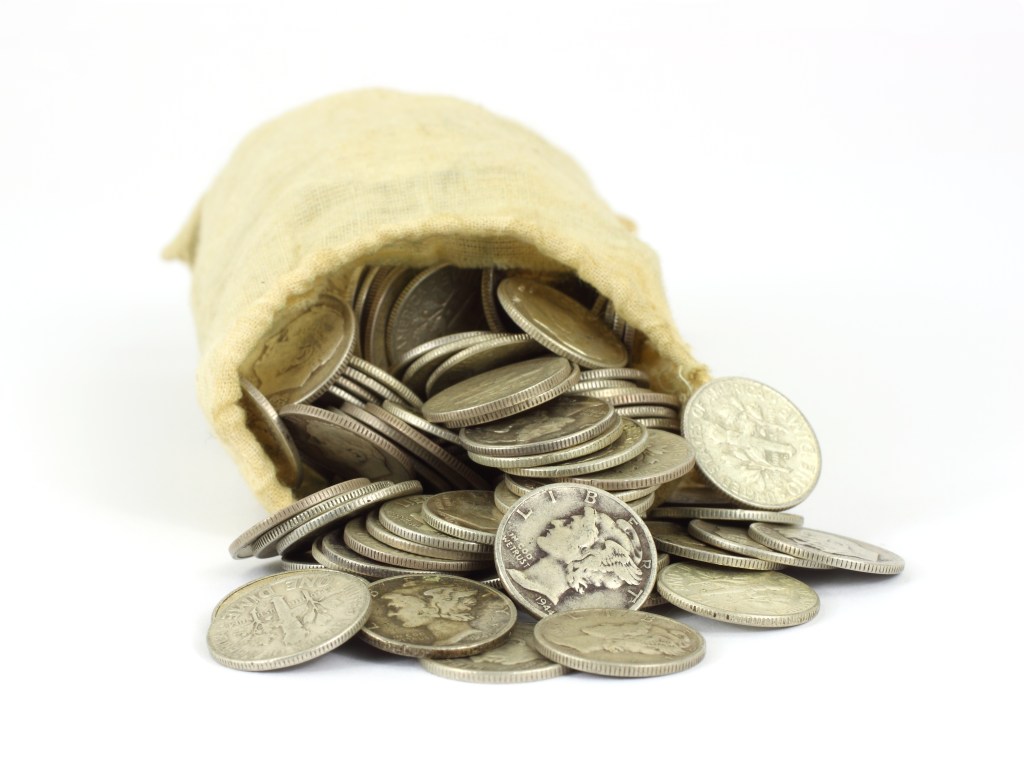
Silver Trading ‘Vehicles’
There are many ways to work the silver market.
Several trading vehicles are silver futures (mini futures), silver ETFs, options on ETFs, leveraged bull and bear ETFs and lastly, the physical metal itself.
As of this date (9/18/22), quotes for a typical bag of ‘junk silver’ are below:
Note: Posts on this site are for education purposes only. They provide one firm’s insight on the markets. Not investment advice. See additional disclaimer here.