‘He’s Dead, Jim’

What’s the MAERSK message?
The economy has collapsed.
He’s Dead, Jim
But wait! We’ve already written the script on what happens next:
Buy the dip, soft landing, no collapse until after the ‘elections’, stocks to soar, bull market just starting.
The Propaganda, Bot
A Bull Market Is Coming
Morgan Stanley thinks it’s a buying opportunity
Have Patience, Intel Investors!
Is this the crash-proof economy?
Not Time to Worry
The AI, Bot
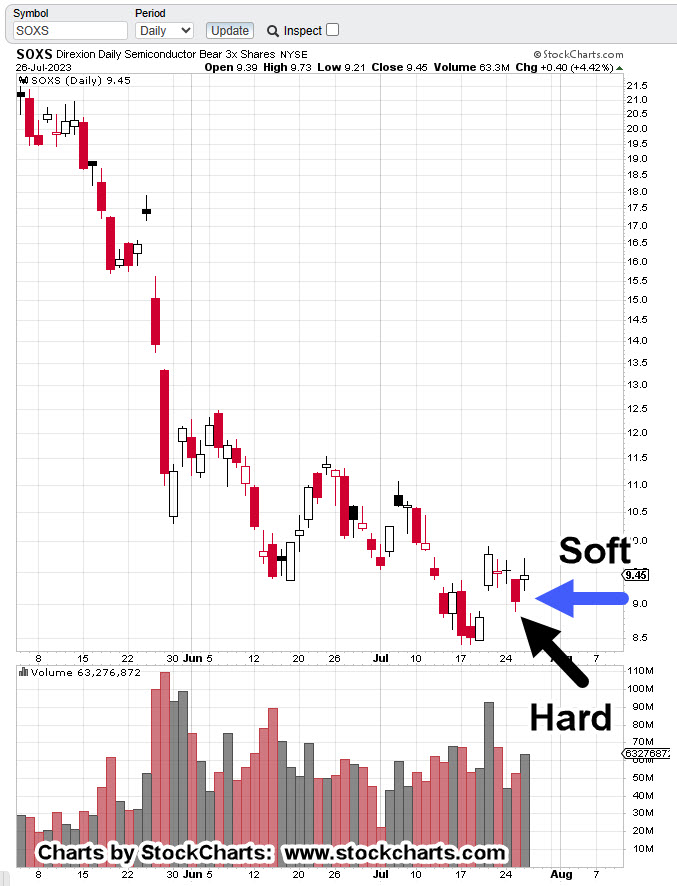
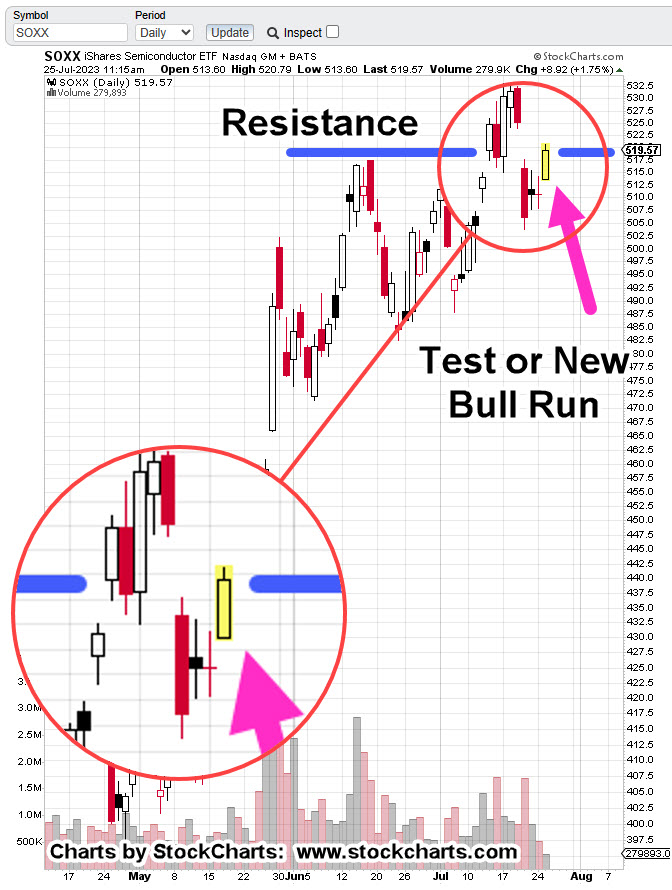
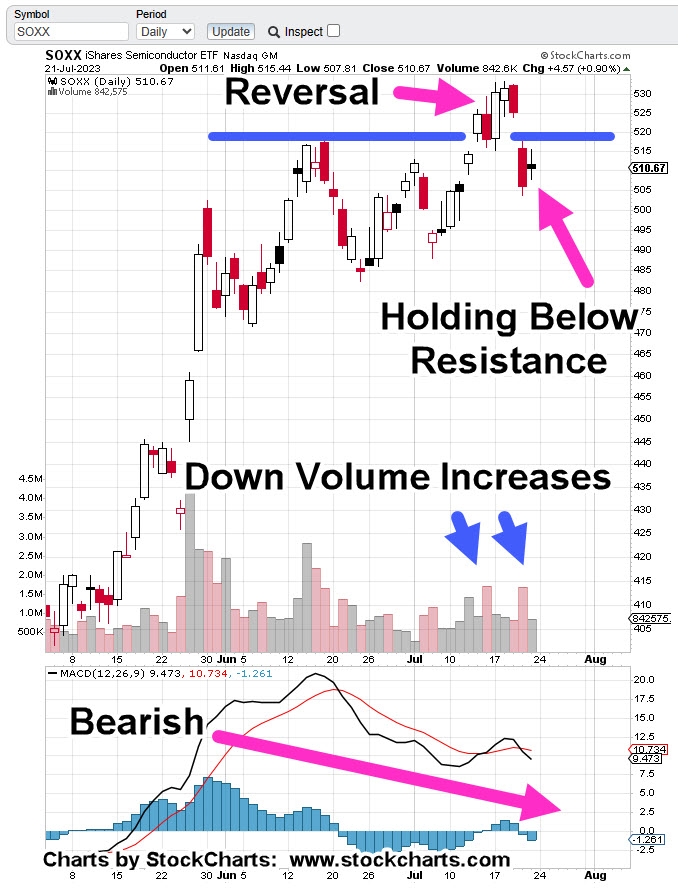
Meanwhile, the SOXX and its loyal henchman, the AI bot, may have just ‘changed hands’.
Well, actually leveraged inverse SOXS, could be changing hands, shown below on the weekly chart.
Semiconductors Leveraged Inverse SOXS, Weekly
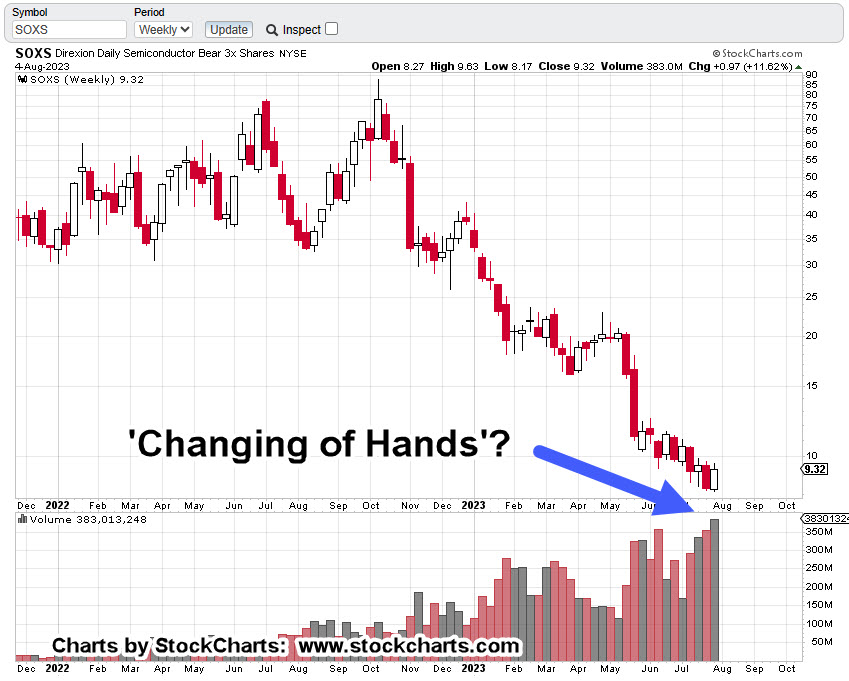
The massive volume in SOXS, over 369-million shares for the week represents (at the closing price) over $3.4-bln.
That may be the inflection point (not advice, not a recommendation).
As a reminder, here’s another example of ‘changing of hands’, link here. Since then, GLD has not topped that level.
Three-Hundred, Three Years (33)
Not since the South Sea Bubble of 1720, has there been an environment such as this.
Reference time stamp 11:10, in the link.
NVDA Earnings, Tick-Tock, Closer
One has to wonder, how NVDA, is going to ‘spin’ its upcoming earnings release and how the market will react.
Will it be, ‘buy the rumor, sell the news’, or just good ‘ol fashioned ‘sell’. Maybe it will be ‘buy, then sell’. 🙂
Who knows but it looks like the rest of the market’s not waiting around to find out (not advice, not a recommendation).
Stay Tuned
Charts by StockCharts
Note: Posts on this site are for education purposes only. They provide one firm’s insight on the markets. Not investment advice. See additional disclaimer here.
The Danger Point®, trade mark: No. 6,505,279