One Side, is Exhausted

Today was the day when the airline sector was supposed to resume its uptrend into a (possible) new high.
Early in the session, that move has failed (not advice, not a recommendation).
Instead of moving higher, price action printed a new daily low.
As Dr. Elder said years ago in ‘Come Into My Trading Room‘, when a set-up fails, at times, it’s best to exit (if positioned) and re-enter in the opposite direction.
Airlines Sector, Daily
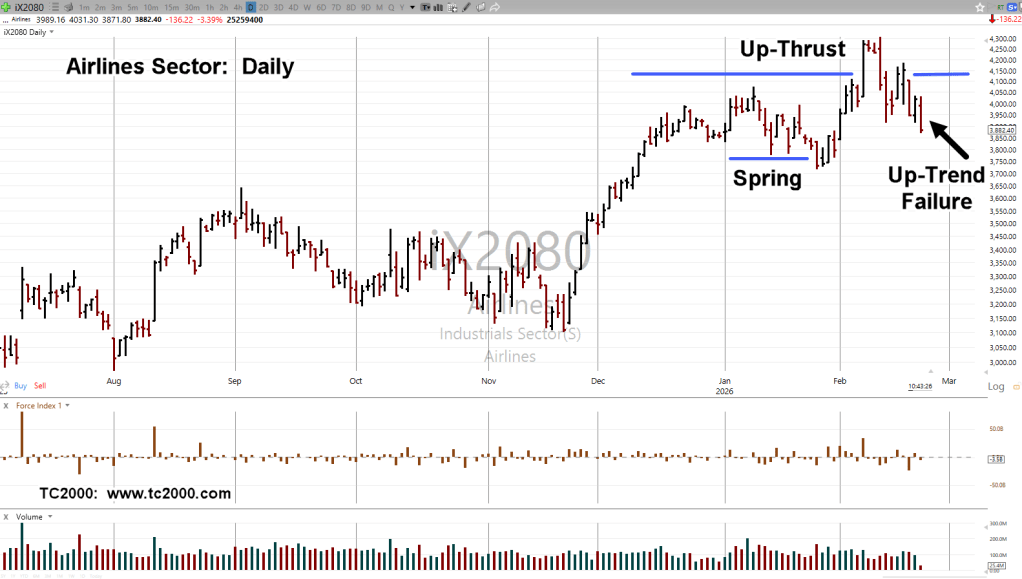
Last Friday’s action was a reversal bar with a higher close. The inference was for continuation to the upside.
As the arrow notes, that move has failed.
The benefit, is a well-defined stop (if short); that is, today’s session high (not advice, not a recommendation).
Stay Tuned
Charts by StockCharts
Note: Posts on this site are for education purposes only. They provide one firm’s insight on the markets. Not investment advice. See additional disclaimer here.
The Danger Point®, trade mark: No. 6,505,279