Note: Posts on this site are for education purposes only. They provide one firm’s insight on the markets. Not investment advice. See additional disclaimer here.
Note: Posts on this site are for education purposes only. They provide one firm’s insight on the markets. Not investment advice. See additional disclaimer here.
Note: Posts on this site are for education purposes only. They provide one firm’s insight on the markets. Not investment advice. See additional disclaimer here.
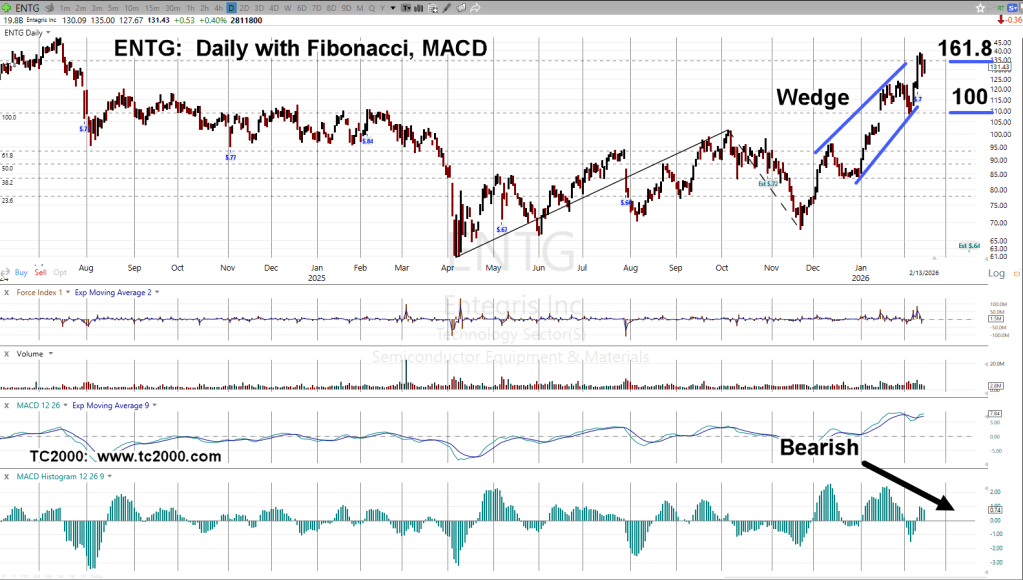
Entegris reported earnings last week, on the tenth.
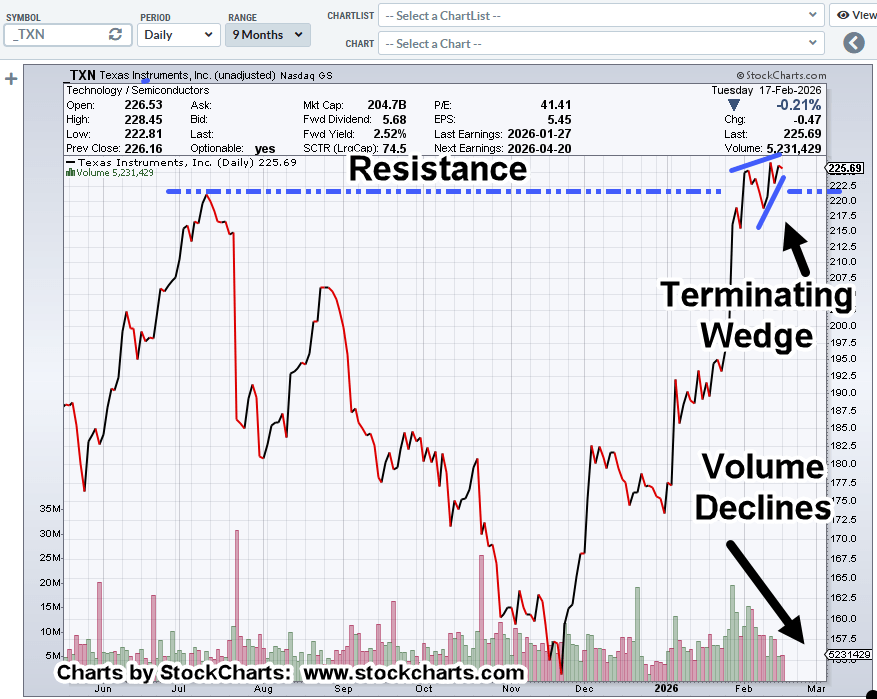
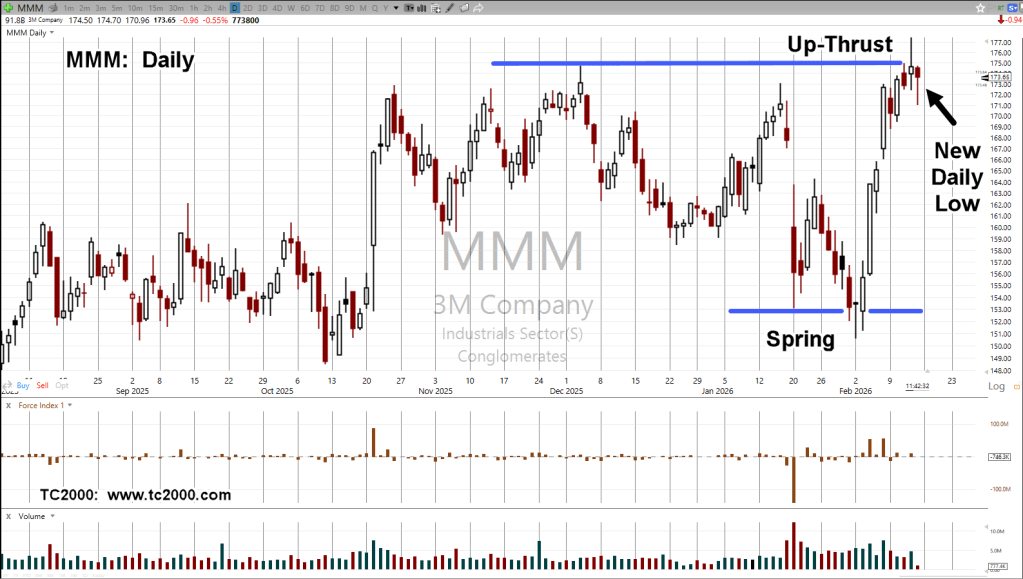
Market response was to launch into and up-thrust condition along with hitting the top of a terminating wedge, as well as printing a Fibonacci 161.8%, projection.
Technical details (up-thrust, removed for clarity) are shown on the daily chart below.
Entegris Inc., ENTG Daily
We’re looking for a new daily low at the next session (not advice, not a recommendation).
Note: Posts on this site are for education purposes only. They provide one firm’s insight on the markets. Not investment advice. See additional disclaimer here.
Note: Posts on this site are for education purposes only. They provide one firm’s insight on the markets. Not investment advice. See additional disclaimer here.
Note: Posts on this site are for education purposes only. They provide one firm’s insight on the markets. Not investment advice. See additional disclaimer here.
Note: Posts on this site are for education purposes only. They provide one firm’s insight on the markets. Not investment advice. See additional disclaimer here.
“It’s possible there might be higher action (staying below the session high) into, during, or just after the Fed announcement (not advice, not a recommendation).”
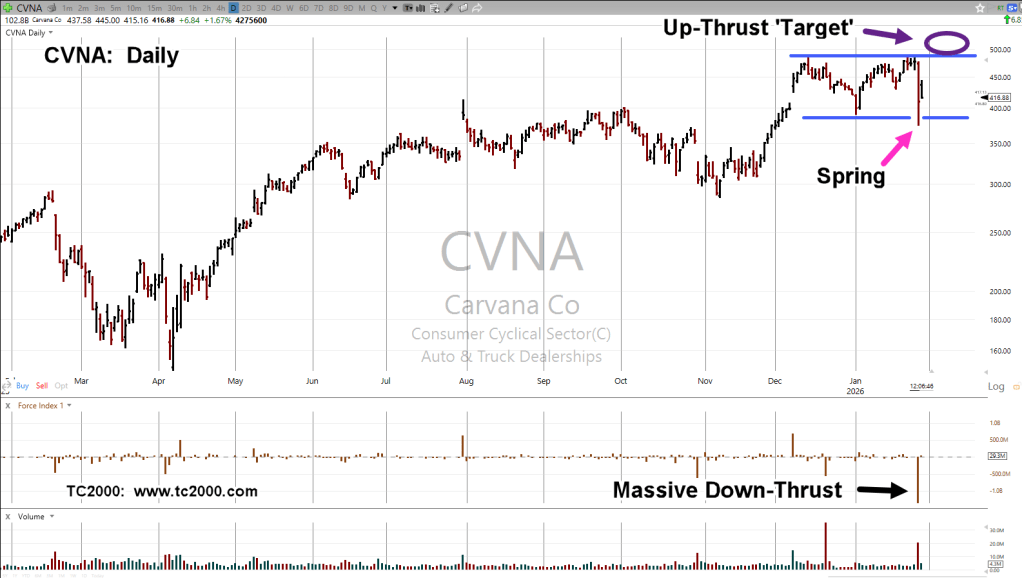
CVNA, continued on lower to penetrate support levels of January 2nd, this year.
After that, was a rebound into the close.
Wyckoff ‘Spring’ Position
With support penetration, rebound higher including today’s action, we’re in Wyckoff ‘spring’ position.
Now, comes the interesting part.
It’s possible, CVNA could move on to a repeating set-up, posting new all-time highs (not advice, not a recommendation).
Carvana CVNA, Daily
Note the massive down-thrust energy. This is possibly the largest ever, for CVNA (data going back to 2/12/20).
Note: Posts on this site are for education purposes only. They provide one firm’s insight on the markets. Not investment advice. See additional disclaimer here.
The last update on Carvana did not see how it was going higher but gave a potential price target, anyway.
At the same time, that update said:
“Note: Today’s break higher, then a pullback, puts CVNA in up-thrust position (not advice, not a recommendation).“
As of this post, CVNA has accelerated lower, penetrating support levels; that puts it in (minor) ‘spring’ position.
It’s possible there might be higher action (staying below the session high) into, during, or just after the Fed announcement (not advice, not a recommendation).
Note: Posts on this site are for education purposes only. They provide one firm’s insight on the markets. Not investment advice. See additional disclaimer here.
Note: Posts on this site are for education purposes only. They provide one firm’s insight on the markets. Not investment advice. See additional disclaimer here.