Sentiment Shift … Biotech

Was Friday, The Day?

Is the tide (finally) going out for biotech?

The end of the prior update, shows a lot coming to the surface.

So much, that it can’t be ignored.

Also coming out on Friday, was this report.

Is it all too much, price action has finally reversed? We’ll analyze that potential below.

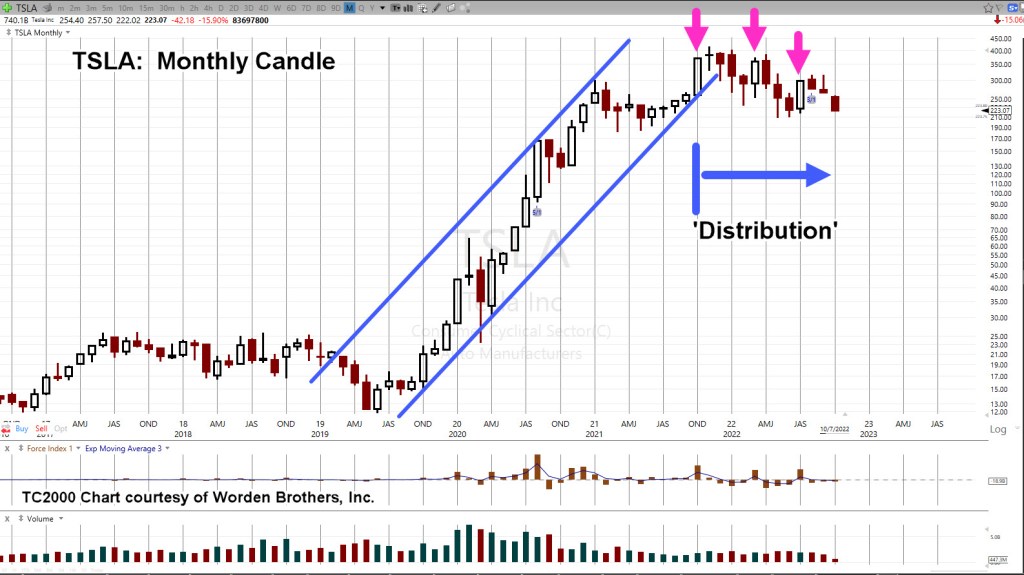
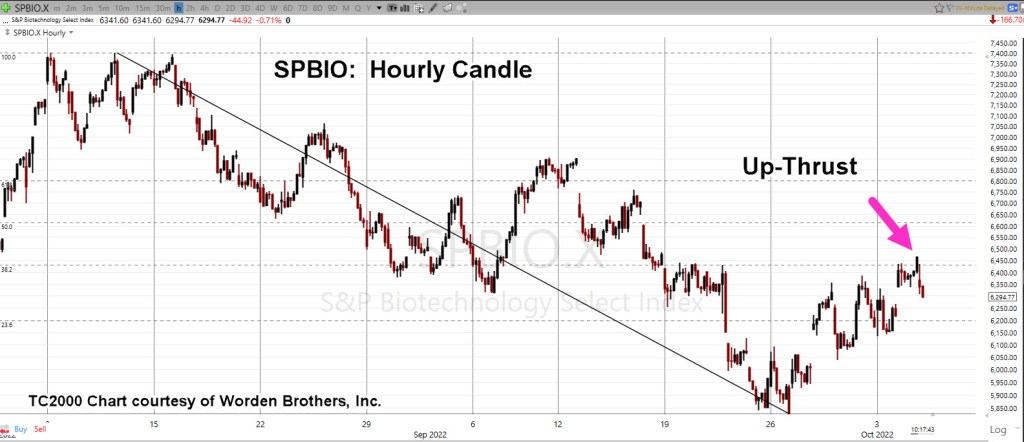
Biotech SPBIO, Quarterly

First, the big picture.

There have been six consecutive lower quarters … the most of any major index

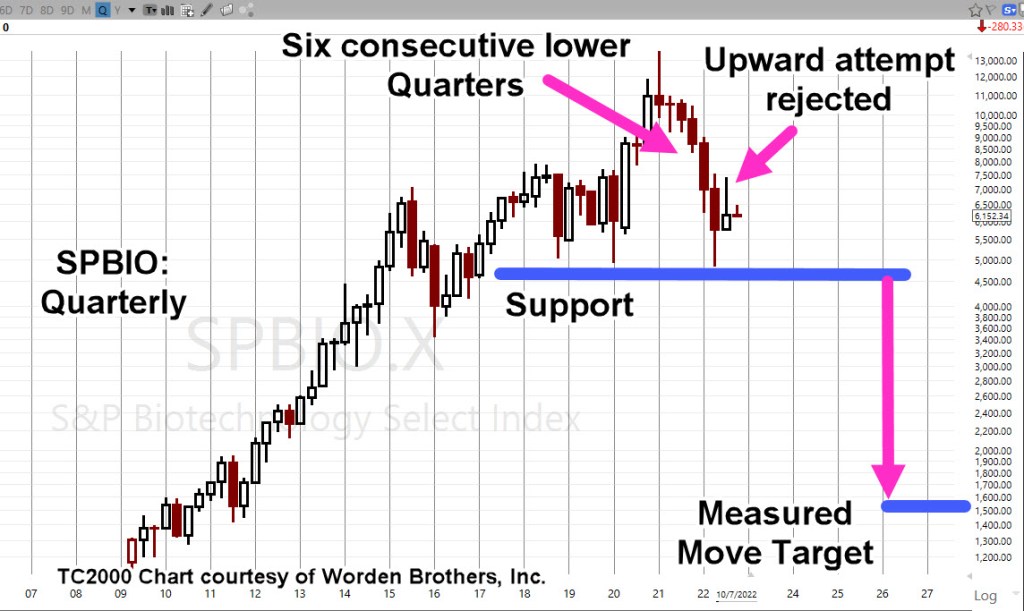
What’s not labeled above, is an apparent Head & Shoulders pattern forming; the arrow showing the rejection of the upward move could be the top of the Right Shoulder.

The left shoulder is considered to be the eight quarters that span, 6/29/18 – 3/31/20.

If it’s an H&S, and if the support is penetrated, the measured move target is shown.

That’s a lot of ‘ifs’.

Moving on to the weekly, we see confirmation of the right-side trendline. Also shown is the potential trading channel.

Biotech SPBIO, Weekly

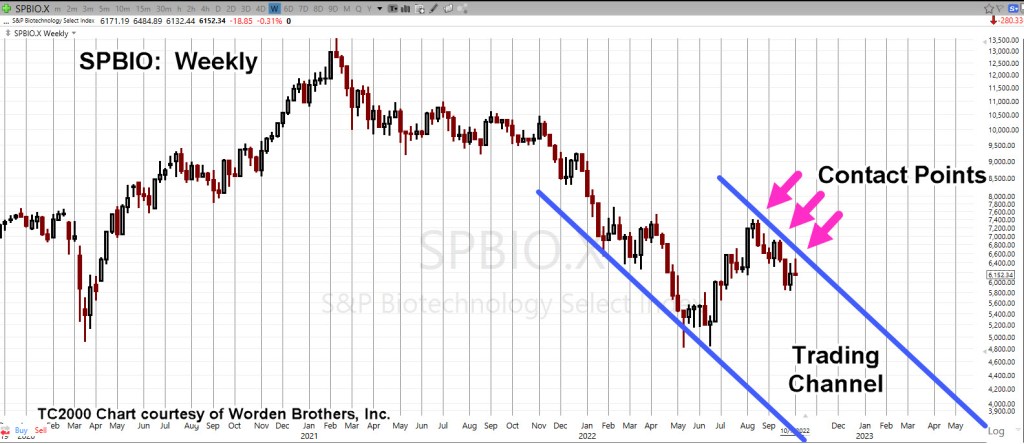
Price action could still break out to the upside from the channel line.

For that to happen, there would need to be some kind of huge catalyst.

So far, nothing out of the ordinary other than the typical Ebola outbreak and/or, radiation poisoning 🙂

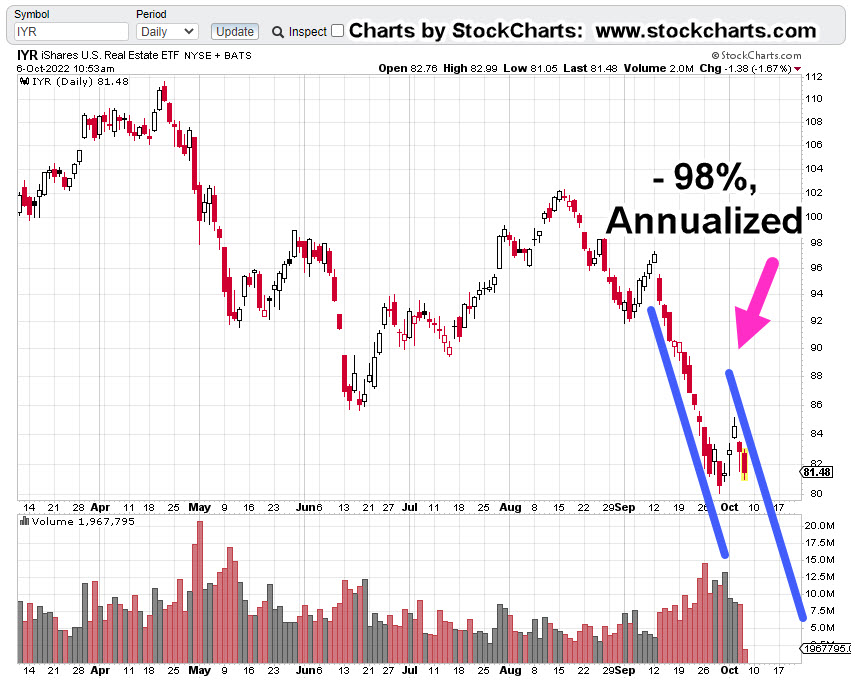
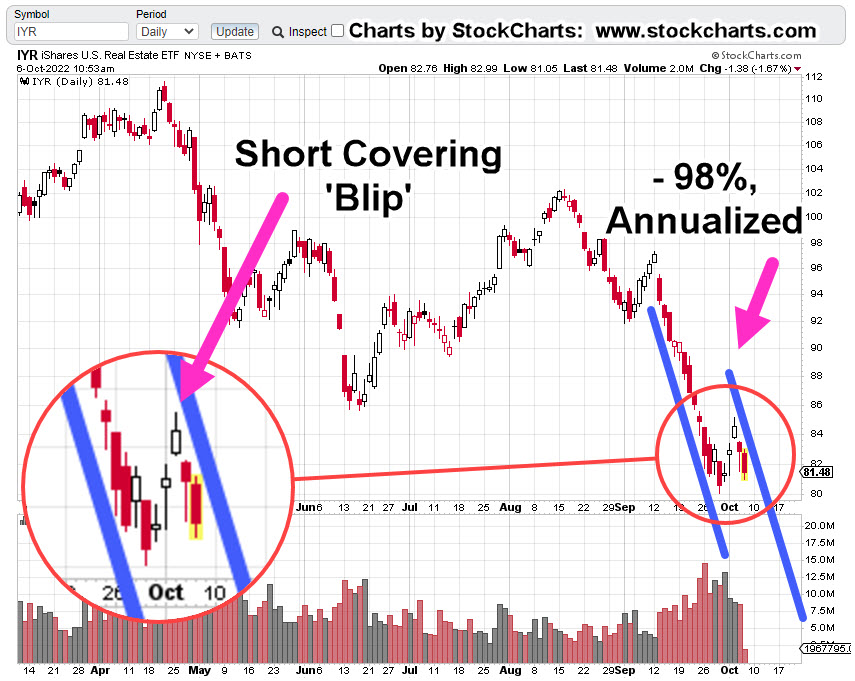
Downside Reversal Probabilities

So, last Friday was decidedly down. If we’re in a reversal, what’s the next likely thing to happen?

For that answer, we go to the daily chart.

Biotech SPBIO, Daily

The blue lines are a minor support zone.

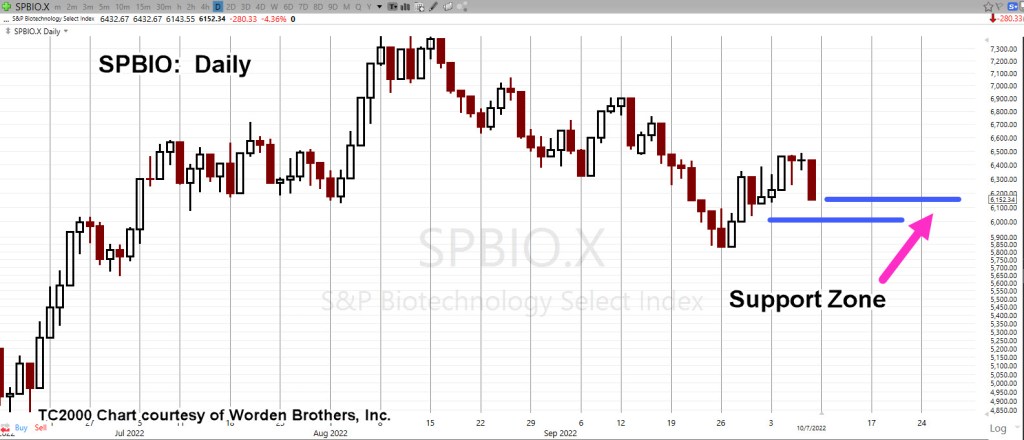
If we are in a reversal, a lower open at the next session (into the support zone) weights probabilities to the downside.

If that happens, expect price action to attempt to ‘test’ Friday’s wide bar by moving higher … at least temporarily.

If there’s a higher open instead, it does not necessarily negate the reversal, but it does weaken the case.

It may mean there’s more upside testing and/or, the beginnings of a move to much higher levels.

Stay Tuned

Charts by StockCharts

Note:  Posts on this site are for education purposes only.  They provide one firm’s insight on the markets.  Not investment advice.  See additional disclaimer here.

The Danger Point®, trade mark: No. 6,505,279

Tesla … Set To Implode

Watch The Tape

Two-year uptrend, broken.

A year’s-worth of ‘distribution’ from strong hands to weak.

Ten days from now is the next TSLA, earnings release.

With TSLA, price action approaching The Danger Point®, that earnings release is likely to be a catalyst.

The monthly chart has the trendline (and channel) break along with the distribution phase.

Tesla TSLA, Monthly

Note, each thrust attempt higher (magenta arrows) has subsequently failed.

Thrusts following the first one, are at lower levels.

The weekly chart below, shows what we’re looking for; penetration of support to potentially set up a short-trade (not advice, not a recommendation).

Tesla TSLA, Weekly

When or if that penetration takes place, depending on the depth of the thrust, we’ll have a Wyckoff spring set up … that ultimately is expected to fail.

Ways To Trade

As if on cue and possibly in anticipation of TSLA fireworks, there’s a long and short ETF, for just this ticker.

Released just months ago; TSLS, a 1X inverse (bear) TSLA. The bull side has 1.5X leverage with TSLL.

TSLS, has a 100% maintenance requirement and TSLL, has the same.

Or, one can short directly.

There’s no dividend and the broker used by my firm shows TSLA, has no borrowing restrictions other than a 40% maintenance requirement (not advice, not a recommendation).

Then, there are options … we’ll discuss those if some kind of high probability opportunity presents itself.

The Masses

Let’s not forget the herd. What are they doing/saying?

With that in mind, a random check of our favorite holding pen, SeekingAlpha, has oodles of TLSA analysis.

The most recent is actually quite good from a thoroughness perspective. It admits/discusses the downward pressures and identifies the support/resistance levels discussed above.

The problem is the mass psychosis.

It’s the EVs are the way’ mantra as if Bhagwan Shree Rajneesh himself, was communicating directly.

With the winter carnage in Europe just weeks away, we’re about to find out how green ‘electrics’ hold up when there is, well, no electricity.

Back to Biotech

While all of the above is transpiring, the real Black Swan continues to emerge; the latest here, here and here.

This event is happening now; the effects of which will last our lifetimes.

It’s massive and world-wide; likely to override any mainstream (traditional 60/40, type) analysis.

After letting go of the biotech short for the seventh time, two days later, this past Friday, it decides to reverse.

We’ll cover that in the next update.

Stay Tuned

Charts by StockCharts

Note:  Posts on this site are for education purposes only.  They provide one firm’s insight on the markets.  Not investment advice.  See additional disclaimer here.

The Danger Point®, trade mark: No. 6,505,279

ProLogis … Real Estate Proxy

The Work Has Already Been Done

This is how it pays off.

Work was done months ago, on ProLogis (logistics/warehouse, real estate) which at the time, was the largest cap in the IYR.

It’s now No.2, just behind AMT, but the effort is still valid.

From that post last May, the behavior of ProLogis during a bear market was summed up with the following:

“It’s straightforward.

Using 2008 – 2009, timeframe as the proxy, PLD was vaporized; straight down for two-months.”

Well, that was back in ’08 – ’09.

Let’s see how our ‘vaporization’ is going now.

ProLogis PLD, Monthly

Price action is at support.

Downward pressure is immense.

We should all be able to agree, this time is worse than last time (’08 – ’09).

There’s no money left for a ‘save’, and our chief cook and bottle washer, the Fed, seems to be on a different agenda.

So, let’s remind ourselves of the potential for this down-move should it come to fruition.

The weekly chart of PLD, and distance traveled below the 200-wk Moving Average, gives us a sense of the enormity.

ProLogis PLD, Weekly

To position for a potential event, there may be plenty of time, or no time.

Either way, when things really get started to the downside, confusion, panic, locked-up brokerages, internet outages, will likely be the norm.

Positions & Current Stance (courtesy only, not advice).

The following is the positioning of my firm’s main (largest) account.

DRV-22-04:

Entry @ 66.463, Stop @ 63.98

ZSL-22-01:

Entry @ 28.08, Stop @ 28.53***

***, Indicates change

Note: Positions may be increased, decreased, entered, or exited at any time.

Stay Tuned

Charts by StockCharts

Note:  Posts on this site are for education purposes only.  They provide one firm’s insight on the markets.  Not investment advice.  See additional disclaimer here.

The Danger Point®, trade mark: No. 6,505,279

Real Estate ‘Crash Channel’

Not Saying That Lightly

For real estate, the crash may be happening as we speak.

Even if it’s not, the sector (IYR) has developed an aggressive trading channel as we’ll see below.

First, we’ll look at ‘big picture’ potential on the weekly chart.

Real Estate IYR Weekly

The distance traveled from the 200 Week Moving Average during the crash of ’08 – ’09, is shown.

That same distance is projected on the current situation.

Everybody’s ‘looking for the bottom’ … well, there it is. 🙂

Of course, that’s only a potential bottom.

Where it gets really scary is the channel that’s been confirmed on the daily chart, shown below.

The zoom version shows the weak blip higher … potential short covering that looks complete.

One caveat is that as (or if) IYR price action approaches the lows, technically speaking, it’s a support level.

That’s the time to watch the right-side channel line to see if it’s penetrated, thus negating the aggressive downtrend.

Positioning

Everyone has their own style and this is NOT financial advice.

However, a short was initiated early this session in Leveraged Inverse Fund DRV, labeled DRV-22-04.

Opened @ 66.4633, with a stop at session low, 63.98

Stay Tuned

Charts by StockCharts

Note:  Posts on this site are for education purposes only.  They provide one firm’s insight on the markets.  Not investment advice.  See additional disclaimer here.

The Danger Point®, trade mark: No. 6,505,279

After The Close …

The Tape Is Always Right

Once again, stopped-out of the biotech short (not advice, not a recommendation).

Call it bad timing, incorrect analysis or whatever. Every opportunity for SPBIO, to go lower is being thwarted … so, no more for now.

On the flip side, the potential collapse in silver has been discussed over the past few weeks, here, here, here and here.

Looking at the chart below, not only do we have a Wyckoff Up-Thrust, but unless it’s negated by subsequent price action, we’ve got an ‘island gap reversal’ as well.

Prices can’t be sustained at yesterday’s higher level.

Silver SLV, Daily

As previously discussed, very late in the session as SLV, price action rose higher, reducing the risk, a short was entered via Leveraged Inverse Fund ZSL @ 28.08 (not advice, not a recommendation).

The trade is identified as ZSL-22-01.

An obvious hard-stop would be yesterday’s high in SLV, or the corresponding low in ZSL @ 26.55.

Stay Tuned

Charts by StockCharts

Note:  Posts on this site are for education purposes only.  They provide one firm’s insight on the markets.  Not investment advice.  See additional disclaimer here.

The Danger Point®, trade mark: No. 6,505,279

Biotech Reversal … The Big One ?

Seventh Time A Charm

‘Get right and sit tight’ … Livermore

Well, it’s the ‘get right’ part that’s the challenge.

As for Biotech SPBIO, it’s no secret it’s been on again, off again, then back on again.

So, it is. Based on current price acton, yesterday was a head-fake into the 38% retrace.

This morning’s session attempted to move higher but was rejected within the first 3-minutes.

Once again, the short trade via LABD, has been re-established (not advice, not a recommendation).

We have LABD-22-07; entered at 21.88, with a stop at the session low of 20.88.

At this juncture (10:50 a.m., EST), Inverse Fund LABD, is pushing higher.

The hourly chart of SPBIO, shows the 38% retrace and reversal.

Biotech SPBIO, Hourly

Expanded version.

As of this post (10:50 a.m., EST) price action has just filled the gap from yesterday’s session. Some amount of SPBIO, retrace higher (below this morning’s highs) is reasonable.

Summary

The groundwork has already been laid over the past few months and even as far back as one year, why this sector may be set for a stupendous decline.

Of course, we don’t know if ‘this is it’, until it’s all over.

For now, the LABD position is in the green with a hard stop at the session low of 20.88 (not advice, not a recommendation).

Stay Tuned

Charts by StockCharts

Note:  Posts on this site are for education purposes only.  They provide one firm’s insight on the markets.  Not investment advice.  See additional disclaimer here.

The Danger Point®, trade mark: No. 6,505,279

The Silver Set-Up

Repeating: Spring-To-Up-Thrust

Which comes first: Freezing and starving to death, or currency collapse?

Is that a hyperbolic statement?

Short answer, is no.

Here are at least two boots-on-the-ground sources that paint an incredibly bleak picture of what is to come in just weeks for Europe.

Links are here and here.

As with the Texas Freeze, the last thing on anybody’s mind was their “stack” of silver.

The humanitarian crisis is happening now, if not soon. Currency collapse may be months if not years away.

Which brings us to the precious metals and specifically silver, SLV.

The past few trading sessions have formed a repeating set-up: Spring-To-Up-Thrust.

Silver SLV, Daily

Note, the Pre-Market activity is far below yesterday’s high; the bulls may be trapped.

Typically the first order of business is an attempt to close the gap. If that happens, price action is then narrowing the risk on a short entry (not advice, not a recommendation).

One typical trading vehicle for shorting silver (other than the futures market) is 2X Inverse Fund ZSL.

Summary

The bulls think it’s finally the launch they have been waiting for … all these years.

It could be … anything can happen.

However, that does not take away from the fact we’ve got a trade set-up that may offer a low-risk short entry (not advice, not a recommendation).

Stay Tuned

Charts by StockCharts

Note:  Posts on this site are for education purposes only.  They provide one firm’s insight on the markets.  Not investment advice.  See additional disclaimer here.

The Danger Point®, trade mark: No. 6,505,279

Sanity, Amidst Chaos

Biotech About To Go ‘Up-Thrust’

With about three-minutes to go before the close, the stop was hit at LABD: 20.90.

Short position LABD-22-06, is closed (not advice, not a recommendation).

The ‘timing‘ analysis was overridden by the market about mid-session; there’s obviously something at work on a longer timeframe.

We’ll look at what that might be with the 4-Hour chart of biotech SPBIO.

SPBIO, 4-Hour Candle

The chart shows price action pushing past the 38% level just before the close.

Unless there’s a major gap lower at tomorrow’s open, the stage is set for SPBIO, to push on higher to the 50%, retrace.

However, another set-up could be in the works.

We’re going back to our usual trick of taking the above chart an inverting it to show what inverse fund LABD would look like with no tracking errors.

SPBIO, 4-Hour Candle (Inverted)

Now we see what may be happening.

A decisive push below support, puts the inverted chart (i.e., LABD) in ‘spring’ position.

Conversely, SPBIO, would be in ‘up-thrust’ condition at the same time.

Stay Tuned

Charts by StockCharts

Note:  Posts on this site are for education purposes only.  They provide one firm’s insight on the markets.  Not investment advice.  See additional disclaimer here.

The Danger Point®, trade mark: No. 6,505,279

Timing The Market

Less Time Pushing Higher

The danger of this situation can’t be over emphasized.

Not only do market levels and depth of penetration need to be watched but also the time; time spent pushing higher or lower.

Biotech SPBIO, indeed moved higher and penetrated our previously stated 6,384.50 level; here’s the important part: As of now (11:34 a.m., EST), it’s struggling to hold that level.

Looking at leveraged inverse fund LABD, on a 30-minute basis, the market itself is showing, each successive thrust lower (higher for SPBIO), spends less and less time at the new level.

Like a drowning swimmer coming up for less air each time.

The market (SPBIO) may get itself together and somehow continue higher.

However, at this point, we’ve got a hard stop; this morning’s LABD low, of 20.90 (not advice, not a recommendation).

SPBIO, Leveraged Inverse Fund LABD: 30-minutes

Today’s close is likely to be important.

A failure to push lower for LABD, may indicate “we’re done” and now ready for a decisive reversal.

Stay Tuned

Charts by StockCharts

Note:  Posts on this site are for education purposes only.  They provide one firm’s insight on the markets.  Not investment advice.  See additional disclaimer here.

The Danger Point®, trade mark: No. 6,505,279

Between Sucess … and … Failure

‘Inside Days’ For Biotech

The market will attempt to hypnotize all participants.

That’s what’s happening now.

This, just out from ZeroHedge; buying ‘puts’ at the bottom and selling out or timing-out at the highs.

Typical bear market behavior

Our chosen sector for going short, biotech (SPBIO), is not immune to hypnotic action (not advice, not a recommendation).

Yesterday was an ‘inside day’, staying within the confines of the prior day’s action.

We’re still at The Danger Point®; it can go either way.

In the pre-market (8:55 a.m., EST), biotech along with the overall market is set to open higher.

How much higher, is the key as we’ll see below.

Biotech SPBIO ($SPSIBI), Daily

The daily chart includes our ‘trick’ previously discussed of using LABD volume to show supply/demand forces.

As price action rose to test the top of the range, volume decreased significantly.

Commitment to the upside is weak (at this point).

The zoom version below shows more detail.

From the LABD pre-market action, the best that can be determined, we’re still within the range of Friday’s (9/30/22), bar.

As shown, the level to watch is the SPBIO high of 6,384.50.

A decisive penetration of this high indicates potential retrace to 50%, at least.

In that case, the short in LABD (LABD-22-06), will be exited (not advice, not a recommendation).

Stay Tuned

Charts by StockCharts

Note:  Posts on this site are for education purposes only.  They provide one firm’s insight on the markets.  Not investment advice.  See additional disclaimer here.

The Danger Point®, trade mark: No. 6,505,279

.